


Last updated:
The core forex MACD strategy is to trade momentum shifts using three signals — the signal-line crossover, the zero-line cross, and MACD divergence — with divergence as the highest-probability setup. Enter when a divergence is confirmed by a crossover, place the stop beyond the swing that formed the divergence, and target the next structural level at a minimum 1:2 risk-to-reward.
Key takeaways
- Three entry methods: the signal-line crossover, the zero-line cross, and divergence. Divergence is the core of this page because it catches a momentum shift before price confirms it.
- Divergence is a warning, not a trigger. MACD and price disagreeing means momentum is fading — not that the reversal has started. Wait for a crossover or a broken swing to confirm before you enter.
- Every entry needs a stop beyond the swing that formed the signal — below the divergence low for a long, above the high for a short — and a target at the next level, aiming for at least 1:2.
- Default settings stay at 12/26/9: the MACD line (12-EMA minus 26-EMA), the signal line (9-EMA of it), and the histogram (the gap). Changing them rarely helps; managing risk always does.
- MACD lags in ranges. Built from moving averages, it whipsaws in flat markets and confirms late in fast reversals. Filter it with support/resistance and the higher-timeframe trend to make it tradeable.
What MACD actually signals
MACD (Moving Average Convergence Divergence) is a trend-following momentum indicator built from three parts: the MACD line (the 12-period EMA minus the 26-period EMA), the signal line (a 9-period EMA of the MACD line), and the histogram (the gap between the two). When the averages pull apart, momentum is building; when they converge, it is fading.
That is all you need for the setups below. For the full mechanics — how each component is calculated and how to read the line, signal, and histogram on a chart — see our companion explainer on what the MACD indicator is and how it works. This page assumes you know that and focuses on the strategy: how to enter, stop, and exit a trade, with divergence as the core method.
The 3 MACD entry methods
MACD gives you three ways into a trade. They fire at different speeds and carry different weight.
1. The signal-line crossover. The MACD line crossing above the signal line is a bullish trigger; crossing below is bearish. It is the fastest and most common MACD entry — and the noisiest. In a flat market it fires constantly and most of those signals fail. Take crossovers only in the direction of the higher-timeframe trend and most of the whipsaw disappears.
2. The zero-line cross. When the MACD line crosses above zero, the 12-EMA has moved above the 26-EMA — the short-term trend has flipped up. Below zero is the reverse. Zero-line crosses are slower but carry more weight, because they reflect an actual trend change. Use them to set bias, not to time a precise entry.
3. Divergence. Divergence is when price makes a new high or low but MACD does not. It is the highest-probability of the three because it reads a momentum shift before price confirms it — and it is the focus of this page. The rest of the guide builds the divergence setup, entry, stop, and target.
What is MACD divergence?
MACD divergence is a disagreement between price and momentum. Price pushes to a new extreme, but the MACD line or histogram fails to follow — the gap says the move is running on less fuel than it looks. There are two kinds, and they mirror each other:
- Bullish divergence — price makes a lower low, but MACD makes a higher low. Sellers hit a new low with less downside momentum than before; the down-move is tiring. This flags a potential bottom.
- Bearish divergence — price makes a higher high, but MACD makes a lower high. Buyers hit a new high with fading momentum. This flags a potential top.
Read divergence off two clear, comparable swings — low to next low, or high to next high. Skip messy, overlapping candles; a divergence you have to squint to see is not one.
The single most important rule: divergence is a warning, not a trigger. Trending markets print divergence repeatedly and keep going, so you wait for confirmation before you enter — and the next two sections define exactly what that confirmation is.
Bullish divergence setup (entry, stop, target)
The bullish divergence setup is a bottom-fishing trade taken with structure on your side. You are buying a fading down-move, not a falling knife — the difference is the confirmation.
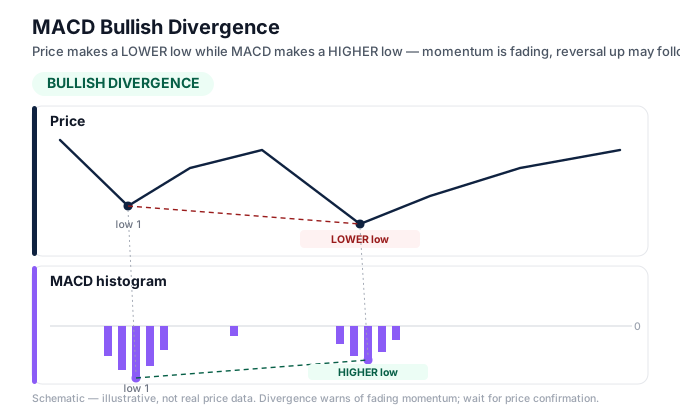
The signal. Price prints a lower low; the MACD line (or histogram) prints a higher low against it. The price lows slope down, the MACD lows slope up. That disagreement is the setup.
The entry. Do not buy the second low itself. Enter only on confirmation — the MACD line crossing back above the signal line, or price breaking the most recent minor swing high. Confirmation is what separates the setup from a guess.
The stop. Place it a few pips below the divergence swing low — the low that produced the signal. If price trades back below it, the divergence has failed and you want out. The swing low, not the entry candle, is the level the trade is built on.
The target. The next structural level above — prior resistance, a swing high, or a supply zone — for a minimum 1:2 risk-to-reward. If the nearest sensible target gives less than 1:1.5, skip the trade.
The setup is strongest when the divergence forms at a level — a support zone, a round number, a prior demand area — rather than in open space. Divergence into support is a far higher-probability buy than divergence mid-leg.
Bearish divergence setup (entry, stop, target)
The bearish divergence setup is the mirror image: you short a fading up-move once structure confirms the top.
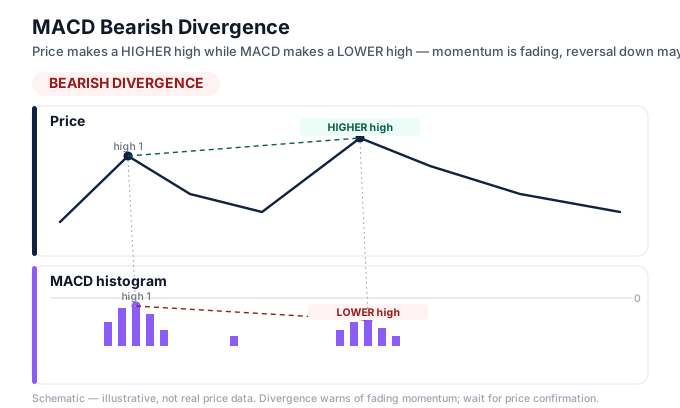
The signal. Price prints a higher high; the MACD line (or histogram) prints a lower high. The price highs slope up, the MACD highs slope down.
The entry. Wait for confirmation — the MACD line crossing back below the signal line, or price breaking the most recent minor swing low.
The stop. A few pips above the divergence swing high — the high that produced the signal. A close back above it invalidates the setup.
The target. The next structural level below — prior support, a swing low, or a demand zone — for at least 1:2. As with the long, if the reward does not clear 1:1.5, pass.
Bearish divergence is strongest into resistance, a round number, or a prior supply zone. The discipline is identical: the divergence warns, the crossover or swing break triggers, and the swing high defines the stop.
A worked example
Here is the full math on a clean bullish-divergence trade, so the sizing is not hand-wavy.
Setup:
- Account balance: $3,000
- Risk per trade: 1% = $30
- Pair: EUR/USD, H1
- Signal: bullish MACD divergence (price lower low, MACD higher low) at a marked support zone, confirmed by a MACD line cross back above the signal line
- Stop-loss distance: 30 pips (a few pips below the divergence swing low)
- Take-profit: 60 pips at the next resistance — a 1:2 risk-to-reward
Step 1 — pip value. On EUR/USD, one pip is 0.0001. On a full standard lot (100,000 units) of a USD-quoted pair, that is $10 per pip, and it scales down with lot size.
Step 2 — position size. The formula is:
Lot size = risk in dollars ÷ (stop in pips × pip value per standard lot)
Lot size = $30 ÷ (30 × $10) = $30 ÷ $300 = 0.10 lot
Step 3 — verify the risk. A 0.10 lot is worth $1.00 per pip (0.10 × $10). A 30-pip stop-out costs 30 × $1.00 = $30 — exactly the 1% limit.
Step 4 — check the reward. The 60-pip take-profit at $1.00 per pip returns 60 × $1.00 = $60, or 2R. Win it and you make $60; lose it and you lose $30.
Run this on every trade before you click buy. Our lot size calculator does the arithmetic instantly, and the risk-reward calculator checks the R:R before you commit. Consistent sizing — not signal-picking — is what keeps an account alive long enough for the edge to show.
Best MACD settings
The default MACD setting is 12, 26, 9 — a 12-period fast EMA, a 26-period slow EMA, and a 9-period signal line. These are the original values and they remain the sensible default on H1 and H4 because they balance responsiveness against false signals.
Resist the urge to optimise. Tweaking MACD to 10/22/7 or 15/30/9 for a cleaner backtest almost always curve-fits to noise. If you scalp on M5 or M1, a faster setting such as 5/13/6 reacts sooner but fires far more false crossovers, so the spread cost eats the extra signals. Leave the settings alone and put the energy into risk management.
On XAU/USD (gold), the 12/26/9 default still works, but gold’s larger daily range and frequent wicks produce more histogram noise than EUR/USD. Treat gold divergences as confirmation only after price also breaks structure, and give gold trades wider stops — its wicks routinely sweep a stop placed as tight as you would on a forex pair.
Filters that cut false signals
MACD on its own whipsaws in ranges. Three filters turn it from a signal generator into a tradeable strategy. Stack at least two before you take a divergence.
- Support and resistance. Only trade divergence at a level you marked before the signal — a support zone for longs, a resistance zone for shorts. A divergence in open space is a coin flip; a divergence at a level is a setup. The level does the heavy lifting; MACD times the entry.
- The higher-timeframe trend. Check the trend one timeframe up. Prefer bullish divergences (longs) when the higher timeframe is turning up or ranging, and bearish divergences (shorts) when it is turning down. Fading a strong, intact trend on divergence alone is how MACD traders get run over.
- RSI confirmation. When RSI shows the same divergence as MACD — say both printing higher lows against a lower price low — the two momentum reads agree and the setup is stronger. Two oscillators confirming one level is confluence; one oscillator alone is a hunch.
The point of the filters is subtraction, not addition — they make you skip the bad divergences, not find more trades. In a strong trend or a dead range, the correct number of MACD trades is often zero.
Common mistakes with the MACD strategy
- Trading divergence as a trigger. The most common and most expensive mistake. Divergence warns; it does not trigger. Fix: wait for the crossover or the swing break before entering.
- Fading a strong trend on divergence alone. In a hard trend MACD prints divergence again and again while price keeps going. Fix: use the higher-timeframe trend filter and only fade with structure confirming.
- Ignoring the level. A divergence in the middle of a leg has no support to lean on. Fix: mark support and resistance first; take divergence only at a level.
- Curve-fitting the settings. Chasing a “perfect” MACD input on a backtest. Fix: keep 12/26/9 and spend the time on risk management.
- Trusting MACD in a range. It lags, so in a flat market crossovers fire and fail constantly. Fix: when price is ranging with no clean structure, stand aside.
- No stop, or a stop too tight. “The reversal is obvious.” Gold wicks and news candles disagree. Fix: stop beyond the divergence swing, position sized to 1% risk.
Frequently asked questions
What is MACD divergence?
MACD divergence is a disagreement between price and momentum. In bullish divergence, price makes a lower low but MACD makes a higher low, hinting the down-move is losing fuel. In bearish divergence, price makes a higher high but MACD makes a lower high. It flags a potential reversal — a warning that momentum is fading, not a confirmed turn.
How do you trade MACD divergence?
Spot the divergence at a marked support or resistance level, then wait for confirmation before entering — a MACD line cross back through the signal line, or a break of the recent swing. Place the stop beyond the divergence swing (below the low for a long, above the high for a short) and target the next structural level at a minimum 1:2 risk-to-reward. Never enter on the divergence alone.
What are the best MACD settings for forex?
The default 12, 26, 9 is the right setting for most traders on H1 and H4 — a 12-period fast EMA, a 26-period slow EMA, and a 9-period signal line. They balance responsiveness against false signals. Scalpers on M5 sometimes use a faster setting like 5/13/6, but it fires more false crossovers. On gold, keep 12/26/9 but wait for a structure break before acting.
Where do you put the stop-loss on a MACD trade?
Place the stop beyond the swing that formed the signal — a few pips below the divergence swing low for a long, above the swing high for a short. That is the level the trade is built on; a break of it means the setup has failed. Then size the position so a full stop-out costs no more than 1% of your account. On XAU/USD, widen the stop because gold’s wicks sweep tight stops.
Is MACD good for scalping?
MACD can be used for scalping on M5 or M1, but not with default settings and not on crossovers alone. A faster input like 5/13/6 reacts sooner but produces many more false signals, and the spread cost erodes the edge on low timeframes. If you scalp with MACD, use it only as confirmation for a level or price-action entry during the active London and New York sessions, never as a standalone trigger.
MACD vs RSI divergence — which is better?
Neither is universally better; they read momentum differently and confirm each other well — RSI divergence uses a bounded 0-100 oscillator and is quick to flag overextended moves. MACD divergence uses the gap between two EMAs and is better tied to the underlying trend. The strongest signal is when both show the same divergence at the same level — that agreement is confluence. Many traders run both, not one.
Why does MACD give false signals?
MACD is built from moving averages, so it lags. In flat, ranging markets the MACD line crosses the signal line back and forth constantly, and most of those crossovers fail. It also prints divergence repeatedly inside strong trends that keep going. The fix is always the same: filter MACD with support/resistance and the higher-timeframe trend, and skip the signals that fire in a range.
Can MACD be used alone?
You can, but you shouldn’t rely on it as a complete system. MACD times momentum well but has no concept of where price is in the structure, so on its own it fires signals that fight the trend and whipsaw in ranges. Filter it with support and resistance, the higher-timeframe trend, and ideally a second momentum read like RSI. Those filters turn a weak standalone signal into a usable edge.
The forex MACD strategy is not one setup but three — the signal-line crossover, the zero-line cross, and divergence — and divergence is the one worth building around because it reads momentum before price confirms it. Treat every divergence as a warning, wait for a crossover or swing break to trigger, take it only at a level with the higher-timeframe trend behind you, and protect it with a stop beyond the swing sized to 1% risk. Start on H1 with the 12/26/9 default. If you are still learning the tool itself, read the MACD indicator explainer first, then use the broader technical-analysis approach and the master technical-analysis beginner’s guide to build the structure reads this strategy leans on.
Forex and CFD trading carries a high level of risk and may not be suitable for all traders. The strategies and indicators described in this article are educational. Past performance does not guarantee future results. Always test on a demo account before risking real capital.
Ready to put this into practice?
Open an account with a regulated broker and apply what you have learned. These are the three brokers we recommend:
Trading forex and CFDs carries a significant risk of loss and is not suitable for everyone. Broker links are affiliate links — we may earn a commission at no cost to you.