



Last updated:
The support and resistance strategy trades price reactions at proven levels three ways: buy the bounce off support (or sell off resistance) with a confirmation candle, trade the breakout on a convincing close through a level, or wait for the retest — the pullback to a broken level as new support or resistance, the most reliable of the three.
Key takeaways
- Three setups, one map. Every support and resistance trade is a bounce (fade the level), a breakout (trade through it), or a retest (trade the pullback after the break). Mark the levels first, then pick the setup that price offers.
- The bounce fades a level. Buy at support or sell at resistance, but only on a confirmation candle — a rejection wick or reversal candle — never on the touch alone.
- The breakout trades through a level. Enter on a convincing body close beyond the level, not an intrabar poke. Your stop goes back inside the range.
- The retest is the highest-reliability version. Price breaks a level, then pulls back to it; the old resistance now acts as support (or vice versa). Entering on the retest filters out most false breakouts.
- A level needs at least 2 touches to count. One touch is a guess; two or more reactions confirm the market respects that price. The EMA-21 gives you a dynamic level when there is no clean horizontal one.
- Every trade gets a defined stop and 1% sizing. Stop a few pips beyond the level (bounce) or back inside the range (breakout), target the next level, and never risk more than 1% of the account on one idea.
A quick recap of support and resistance
Support is a price level where buyers have repeatedly stepped in and stopped a fall; resistance is where sellers have repeatedly capped a rise. When broken, they often swap roles — old resistance becomes new support, and old support becomes new resistance.
That two-sentence version is all you need for the setups below. For the full theory — how levels form, why they hold, and how to draw them cleanly with wicks vs bodies — read our companion explainer on what support and resistance is. This page assumes you already know that and focuses on the strategy: how to actually enter, exit, and manage a trade at a level.
The bounce strategy — trading off the level
The bounce is the setup most traders picture first: price returns to a known level and reverses away from it. You are fading the level, betting that the buyers at support (or sellers at resistance) show up again.
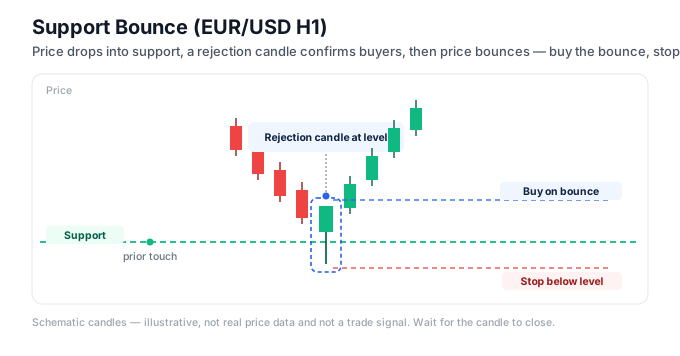
The rule is a two-step. First, price must reach a level you marked in advance — at least two prior touches, so you know the market respects it. Second, wait for a confirmation candle at the level before entering. The touch alone is not the signal; the reaction is.
Good confirmation candles at support are a bullish pin bar (long lower wick, small body), a bullish engulfing candle, or a clear rejection close back above the level. At resistance, look for the mirror image — a bearish pin bar or engulfing candle rejecting the level.
Here is the full trade at support:
- Entry: on the close of the confirmation candle, once price has rejected the level.
- Stop-loss: a few pips below the level and below the confirmation candle’s wick — if price closes through the level, the bounce has failed.
- Target: the next resistance level up. That is your logical exit; the move should run from one level to the next.
At resistance, flip everything: sell on a bearish confirmation candle, stop a few pips above the level, target the next support down.
The bounce works best when the level is fresh and the wider trend agrees — a bounce off support inside an uptrend is far stronger than one fighting a downtrend. Fading a level against a strong trend is the fastest way to get run over.
The breakout strategy — trading through the level
Sometimes price does not respect the level; it drives straight through it. The breakout trades that move, entering as the level gives way and a new leg begins.
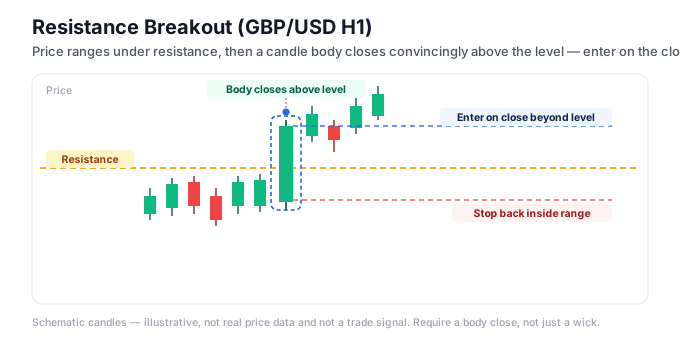
The single most important filter is a convincing body close through the level, not an intrabar spike. Price will often poke a few pips past resistance and snap back — that is a false breakout, and it traps breakout traders. Wait for a candle to close its body clearly beyond the level before you treat the break as real.
The trade for an upside break of resistance:
- Entry: on the close of the candle that closes convincingly above resistance, or on the retest (see the next section for the higher-probability version).
- Stop-loss: back inside the range, below the broken level. If price falls back inside, the breakout has failed and you want out.
- Target: measure the height of the range or consolidation and project it upward from the break, or aim for the next resistance level above.
Volume and momentum help. A breakout on a wide, strong candle after a tight consolidation is more trustworthy than a limp break on a doji. The tighter and longer the range before the break, the cleaner the move that usually follows.
The breakout’s weakness is the false break. In quiet, ranging conditions — the Asian session on non-JPY pairs, or the run-up to high-impact news — levels get pierced and rejected constantly. That is exactly the problem the retest solves.
The retest strategy — the highest-reliability setup
The retest is the same breakout, but you wait for one more move before committing. It is the most reliable of the three setups because it filters out most false breakouts before they cost you.
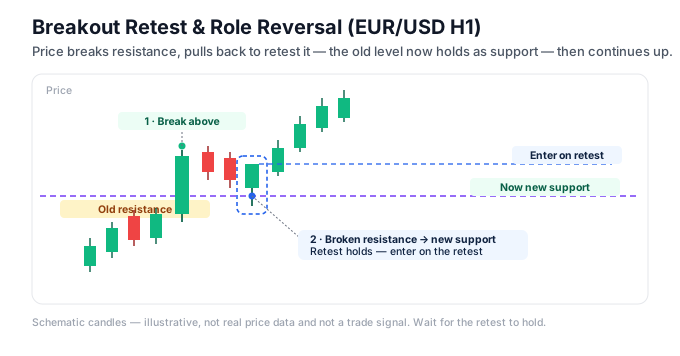
The sequence is: price breaks a level with a convincing close, then pulls back to that same level, which now acts in the opposite role. Broken resistance becomes support; broken support becomes resistance. This role reversal is the core of the setup — the level that once capped price now holds it.
The trade for a broken-resistance-turned-support retest:
- Wait for the break. A candle must close convincingly above resistance first.
- Wait for the pullback. Price returns down to the broken level. Now watch it like you would any support.
- Entry: on a bullish confirmation candle at the retested level — a rejection wick or reversal candle showing the old resistance is now holding as support.
- Stop-loss: below the retested level. If price closes back below it, the role reversal has failed.
- Target: the next resistance up, or the projected range height from the original break.
The retest gives you two things the naked breakout does not: a better entry price (you are buying the pullback, not the top of the break) and confirmation that the level has genuinely flipped roles. The trade-off is that not every breakout pulls back — some run away without you. That is an acceptable cost for skipping the false breaks that the naked entry walks straight into.
Confirmation filters — validating a level and an entry
Two questions decide whether an S/R trade is worth taking: is the level real, and is the entry confirmed? Filters answer both.
Validating the level (at least 2 touches). A level drawn off a single touch is a guess. You need at least two reactions at roughly the same price — two bounces, two rejections — before you trust it. More touches make a stronger level, but they also make it more likely to eventually break, because each test chips away at the orders defending it. Two to three clean touches is the sweet spot.
Confirming the entry (candlestick patterns). Never enter on the level touch alone. Wait for a candlestick signal that shows the reaction is real:
- Pin bar — a long wick rejecting the level, small body. The wick shows price was pushed back.
- Engulfing candle — a candle whose body fully engulfs the prior one, in the direction of your trade.
- Rejection close — price wicks through the level but closes back on your side of it.
Adding a dynamic level (EMA-21). When there is no clean horizontal level, a moving average can act as dynamic support or resistance. The 21-period EMA (Exponential Moving Average) is a reasonable choice on H1 and H4 — in a trend, price often pulls back to the EMA-21 and bounces, giving you a moving level to trade the same three ways. Treat it as confluence with a horizontal level, not a replacement for one.
Confluence is the goal. A bounce off a horizontal support that also lines up with the EMA-21 and a bullish pin bar is a far higher-probability trade than any one of those signals alone. If you trade broader chart reading, our guide to price action trading in forex covers how candlestick signals and levels combine into full setups.
Risk management and position sizing
A setup is only half a trade. The stop and the size are what keep you in the game long enough for the edge to show up. The order matters: define the stop first, then size to it.
Where the stop goes:
- Bounce: a few pips beyond the level and beyond the confirmation candle’s wick. If price closes through the level, the bounce failed.
- Breakout: back inside the range, beyond the broken level. If price re-enters the range, the break failed.
- Retest: beyond the retested level. If the role reversal breaks, you are out.
Where the target goes: the next opposing level, aiming for at least a 1:2 risk-to-reward. If the nearest sensible target gives less than 1:1.5, skip the trade — the math does not justify the risk.
How big the position is: size so that a full stop-out costs no more than 1% of your account. Here is the worked math on a beginner-sized trade so the sizing is not hand-wavy.
Setup:
- Account balance: $3,000
- Risk per trade: 1% = $30
- Pair: EUR/USD
- Setup: bounce off support, confirmed by a bullish engulfing candle
- Stop-loss distance: 20 pips (below the level and the candle’s wick)
- Take-profit: 40 pips away at the next resistance (a 1:2 risk-to-reward)
Step 1 — pip value. On EUR/USD, one pip is 0.0001. On a full standard lot (100,000 units) of a USD-quoted pair, that is $10 per pip, and it scales down with lot size.
Step 2 — position size. The formula is:
Lot size = risk in dollars ÷ (stop in pips × pip value per standard lot)
Lot size = $30 ÷ (20 × $10) = $30 ÷ $200 = 0.15 lot
Step 3 — verify the risk. A 0.15 lot is worth $1.50 per pip (0.15 × $10). A 20-pip stop-out costs 20 × $1.50 = $30 — exactly the 1% limit.
Step 4 — check the reward. The 40-pip take-profit at $1.50 per pip returns 40 × $1.50 = $60, or 2R. Win it and you make $60; lose it and you lose $30.
Run this on every trade. Our lot size calculator does the arithmetic instantly, and the pivot point calculator gives you a set of ready-made support and resistance levels for the session when you have no clean horizontal to work from.
On XAU/USD (gold), the same three setups apply, but give the trade wider stops. Gold’s H1 wicks routinely sweep a stop placed as tight as you would on EUR/USD, so a stop that would sit at 20 pips on a forex pair often needs to be 1.5 to 2 times wider on gold to survive the noise — and you size the smaller lot accordingly to keep the risk at 1%.
When the support and resistance strategy fails
S/R is one of the most durable ideas in trading, but each setup has named conditions where it breaks down.
- The bounce fails in strong trends. Fading resistance in a hard uptrend gets you run over — the level breaks and keeps going. Fix: only take bounces that align with the higher-timeframe trend, or wait for the retest instead.
- The breakout fails in ranges and low volume. In the quiet Asian session on non-JPY pairs, levels get pierced and rejected constantly. Fix: trade breakouts during the London and New York sessions, and demand a convincing body close.
- Both fail around high-impact news. NFP, CPI, and FOMC spikes blow through levels and reverse without warning. Fix: stand aside through the release and let a fresh level form afterward.
- Old levels lose relevance over time. A level from three months ago on a different volatility regime may no longer hold. Fix: prioritise recent, actively tested levels over ancient ones.
- Over-marked charts. Drawing ten levels means price is always “near” one, so every touch looks like a signal. Fix: mark only the two or three cleanest levels per timeframe.
Common support and resistance mistakes to avoid
- Entering on the level touch alone. The touch is not the signal; the reaction is. Fix: always wait for a confirmation candle before entering a bounce or retest.
- Trading a level with only one touch. One reaction is a guess. Fix: require at least two touches before you trust a level.
- Chasing the breakout candle. Buying the top of a wide breakout candle leaves you exposed to the snap-back. Fix: enter on the retest, or on the close, with a stop back inside the range.
- Placing stops exactly at the level. Price often wicks a few pips past a level before reversing. Fix: put the stop a few pips beyond the level and the confirmation wick, not on it.
- Ignoring the trend. Fading a level against a strong trend is low-probability. Fix: take bounces with the trend and breakouts in the trend’s direction.
- No defined target. “I’ll exit when it feels right” is not a plan. Fix: target the next opposing level and size for at least 1:2 before you enter.
Frequently asked questions
How do you trade support and resistance?
Mark the levels first, using at least two prior touches to validate each one. Then trade one of three setups: buy the bounce off support (or sell off resistance) on a confirmation candle, trade the breakout on a convincing body close through the level, or trade the retest after the break. Always place a stop a few pips beyond the level and target the next opposing level, sizing to 1% risk.
What is the bounce strategy in support and resistance?
The bounce fades a level: you buy at support or sell at resistance, betting the level holds again. The rule is a two-step — price must reach a level you marked in advance (at least two touches), then produce a confirmation candle like a pin bar or engulfing candle. Enter on that candle’s close, stop a few pips beyond the level, and target the next opposing level.
How do you trade a support and resistance breakout?
Wait for a candle to close its body convincingly beyond the level, not merely poke through it intrabar — an intrabar spike that snaps back is a false breakout. Enter on that close (or on the retest for a better price), put your stop back inside the range below the broken level, and target the projected range height or the next level. Breakouts are cleaner during the London and New York sessions.
What is a retest and why does it matter?
A retest is when price breaks a level, then pulls back to it before continuing — and the level now acts in the opposite role, with old resistance becoming new support or vice versa. It matters because it filters out most false breakouts: you get confirmation the level has flipped, plus a better entry price than chasing the break. It is the highest-reliability of the three S/R setups.
How many touches make a support or resistance level valid?
At least two. A level drawn off a single touch is a guess; two or more reactions at roughly the same price confirm the market respects it. Two to three clean touches is the sweet spot — enough to trust the level, but not so many that the defending orders are already exhausted and the level is about to break.
Where do you put a stop-loss on a support and resistance trade?
Place it a few pips beyond the level, never exactly on it, because price often wicks past a level before reversing. On a bounce, the stop sits below support (or above resistance) and beyond the confirmation candle’s wick. On a breakout, it goes back inside the range. Then size the position so a full stop-out costs no more than 1% of your account.
What are the best indicators to confirm support and resistance?
Candlestick signals do most of the confirming — pin bars, engulfing candles, and rejection closes at the level. For a dynamic level when there is no clean horizontal one, the 21-period EMA works on H1 and H4. Pivot points give you ready-made session levels. Treat any indicator as confluence with a horizontal level, not a replacement for reading the level itself.
Does support and resistance work on all timeframes?
Support and resistance exists on every timeframe, but higher timeframes give more reliable levels. H1, H4, and D1 levels hold better because each candle represents more trading activity, so the reactions are more meaningful. On M5 and below, levels are noisier and spread erodes tight stops. Learn the setups on H1 and H4, and always respect that a D1 level outranks an M15 one.
Support and resistance is not one trade but three — the bounce, the breakout, and the retest — and each becomes usable only when you validate the level with at least two touches, confirm the entry with a candle, and protect it with a stop beyond the level. Mark two or three clean levels, trade with the trend, aim for at least 1:2, and size every position to 1% risk. Master the retest first; it is the setup that skips the false breaks that catch everyone else.
Forex and CFD trading carries a high level of risk and may not be suitable for all traders. The strategies described in this article are educational. Past performance does not guarantee future results. Always test on a demo account before risking real capital.
Ready to put this into practice?
Open an account with a regulated broker and apply what you have learned. These are the three brokers we recommend:
Trading forex and CFDs carries a significant risk of loss and is not suitable for everyone. Broker links are affiliate links — we may earn a commission at no cost to you.

This is really cool site. Thank you guys higly appreciated.
Regards,
Denzil
There is no better way to trade than what teach on your site. Your strategies are very simple and very effective. Thank you very much.
i learn a lot from this site, thank u
Wow!so awesome ,you guys are the best…. You break it to lay man understand.
This is an awesome site. Very resourceful and professional. Thank you.