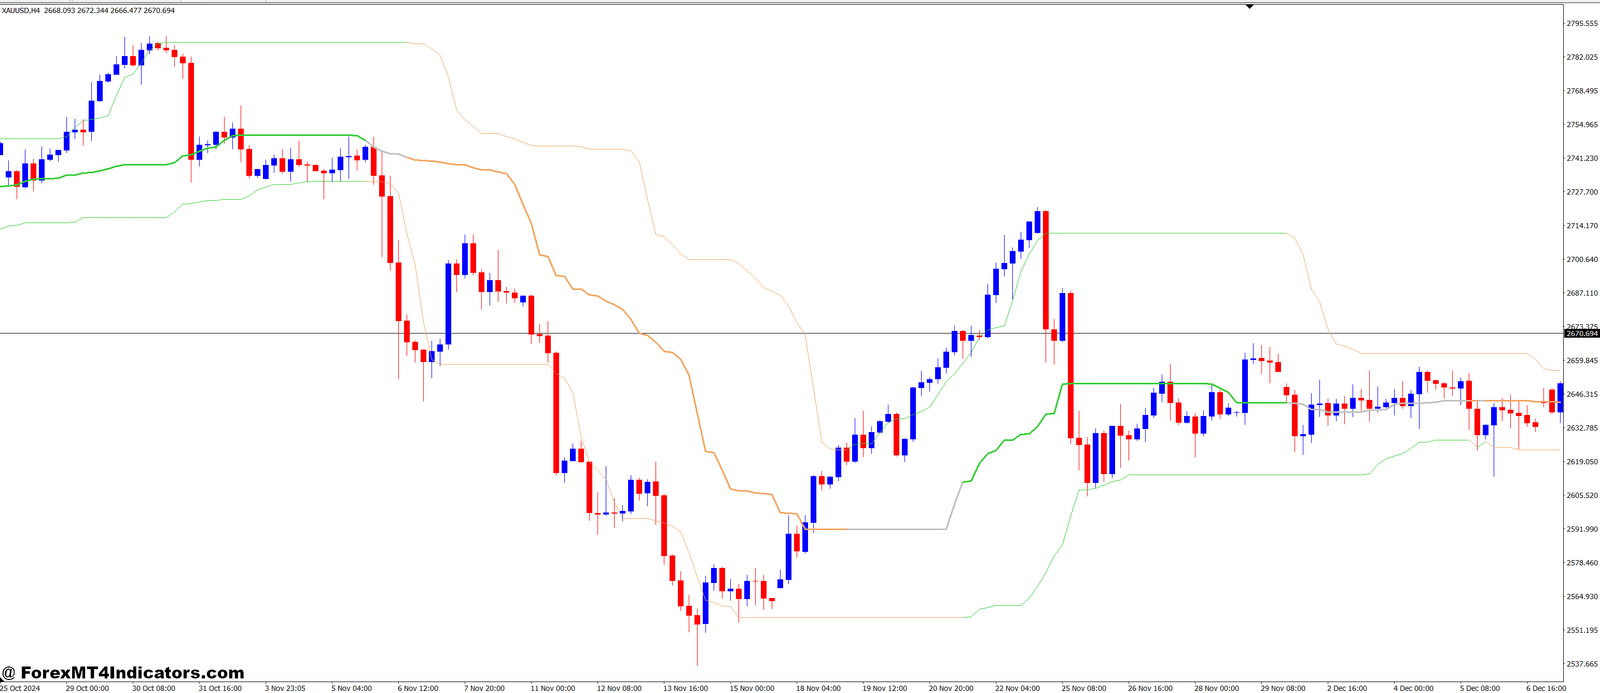
The Quantile Bands MT4 Indicator is one such tool that offers traders a unique way to visualize price movements and statistical probabilities. If you’re looking to enhance your trading strategy and make more informed decisions, understanding how this indicator works can be a game-changer. This article will break down what the Quantile Bands MT4 Indicator is, how it works, and why it can become a crucial part of your trading toolkit.
Understanding the Quantile Bands MT4 Indicator
The Quantile Bands MT4 Indicator is a tool used on the MetaTrader 4 (MT4) platform to represent price fluctuations within defined statistical ranges. It calculates price quantiles, or statistical cut-off points, which help traders identify where the price is likely to fall within a given period. These bands are drawn above and below the price, creating a visual range within which price movements are expected to occur. Essentially, the indicator highlights the upper and lower bounds of price action, offering a clearer picture of market volatility and price levels.
How the Quantile Bands MT4 Indicator Works
The Quantile Bands MT4 Indicator works by analyzing past price data and breaking it down into statistical intervals known as quantiles. These quantiles are used to define upper and lower price levels, creating bands around the price chart. By doing so, the indicator helps traders assess the likelihood of the price reaching certain levels. If the price breaks through the upper band, it may indicate a strong upward trend or overbought conditions. Conversely, if it breaks through the lower band, it might signal a downward trend or oversold conditions. Traders can use this information to time their entries and exits more effectively.
Why Traders Use the Quantile Bands MT4 Indicator
One of the biggest challenges in trading is understanding when to enter or exit a position. Without clear, objective signals, traders are often left relying on gut feelings or subjective judgment, which can lead to costly mistakes. The Quantile Bands MT4 Indicator helps to eliminate this uncertainty by providing a statistically backed view of where the price is likely to go. The indicator offers a more precise approach than traditional support and resistance lines, as it accounts for statistical probabilities rather than simple price levels.
Additionally, the Quantile Bands can be a great tool for risk management. Since it shows the expected price range, traders can set more informed stop-loss orders and better control their risk. The bands also help traders spot overbought or oversold conditions, enabling them to avoid entering trades when the market is too volatile or when the price is likely to reverse.
Benefits of Using the Quantile Bands MT4 Indicator
- Data-Driven Decision Making: Unlike other indicators that rely on subjective analysis, the Quantile Bands are based on statistical calculations, which provide more objective data for decision-making.
- Clear Entry and Exit Points: By identifying upper and lower price bands, the indicator offers clearer signals for when to enter or exit a trade, making it easier for traders to act on opportunities.
- Risk Management: With the ability to spot overbought and oversold conditions, traders can use the Quantile Bands to better manage risk by setting more precise stop-loss levels.
- Enhanced Trading Strategy: Whether you’re a novice or an experienced trader, incorporating the Quantile Bands MT4 Indicator into your trading strategy can improve your overall performance by reducing guesswork and improving market timing.
How to Trade with Quantile Bands MT4 Indicator
Buy Entry
- Price reaches or breaks below the lower Quantile Band: This may indicate that the price is in an oversold condition and could potentially reverse upward.
- Price starts moving upward after touching the lower band: Look for a strong reversal signal (such as a candlestick pattern or a confirmation from another indicator).
- Price closes above the lower band: A confirmation that price is moving back toward the middle or upper quantile, suggesting a possible upward trend.
- Volume increases: If there’s an increase in trading volume after price breaks below the lower band and begins moving upward, it’s a stronger signal to enter a buy trade.
Sell Entry
- Price reaches or breaks above the upper Quantile Band: This indicates that the price may be in an overbought condition and could reverse downward.
- Price starts moving downward after touching the upper band: Look for a strong reversal signal such as a candlestick pattern (e.g., bearish engulfing) or confirmation from other indicators.
- Price closes below the upper band: A confirmation that price is reversing and moving toward the middle or lower quantile, suggesting a potential downward trend.
- Volume increases: If trading volume rises as price begins to reverse downward from the upper band, it strengthens the sell signal.
Conclusion
The Quantile Bands MT4 Indicator is a powerful tool that can greatly enhance a trader’s ability to make data-driven decisions. By providing a clear visualization of expected price ranges, it helps to reduce the uncertainty that often leads to costly mistakes. Whether you’re a beginner looking for guidance or a seasoned trader seeking to refine your strategy, the Quantile Bands MT4 Indicator offers valuable insights that can improve your trading results. By incorporating it into your trading routine, you can navigate the complexities of the market with greater confidence and precision.
Recommended MT4/MT5 Broker
XM Broker
- Free $50 To Start Trading Instantly! (Withdraw-able Profit)
- Deposit Bonus up to $5,000
- Unlimited Loyalty Program
- Award Winning Forex Broker
- Additional Exclusive Bonuses Throughout The Year
- Exclusive 90% VIP Cash Rebates for all Trades!
Already an XM client but missing out on cashback? Open New Real Account and Enter this Partner Code: VIP90
(Free MT4 Indicators Download)

Enter Your Email Address below, download link will be sent to you.


