


Last updated:
A breakout strategy trades the moment price decisively clears a support or resistance level and starts a fresh move. The five main types are the momentum breakout, the opening-range (session) breakout, the channel or range breakout, the pattern breakout, and the pullback-after-breakout. Each clears a level differently — and each needs a real breakout, not a false one.
Key takeaways
- A breakout is price closing beyond a level that held before — a support, resistance, range edge, or trendline — and following through in that direction.
- The five types map to how the level is defined: momentum (volatility expansion), opening-range/session, channel/range, pattern (triangle, flag, S/R), and the pullback-after-breakout re-entry.
- The single biggest killer is the false breakout — price pokes through, triggers stops, then snaps back. Confirmation (a candle close, a volume/volatility rise, or a clean retest) is what separates a real break from a trap.
- Timing matters more than the indicator. Breakouts work best when a session brings volume — the London open and the London/New York overlap (13:00–17:00 GMT) — and stall during the quiet late-Asian hours.
- Stops go on the other side of the level, not a fixed pip count. If the level breaks the other way, the trade is wrong; that is where the stop belongs.
- This is a hub. Each type below links to a full, standalone system you can study and download — start with the type that fits your session and screen time.
What is a breakout in forex?
A breakout in forex happens when price moves beyond a level that has been holding it back — a resistance ceiling, a support floor, the edge of a range, or a trendline — and keeps going in that direction. The level acted as a wall; the breakout is price knocking it down and walking through.
Breakouts matter because levels concentrate orders. Stop-losses, pending orders, and profit targets cluster immediately beyond obvious highs and lows. When price clears the level, those orders fire at once, and that burst of activity is what can turn a small break into a real move.
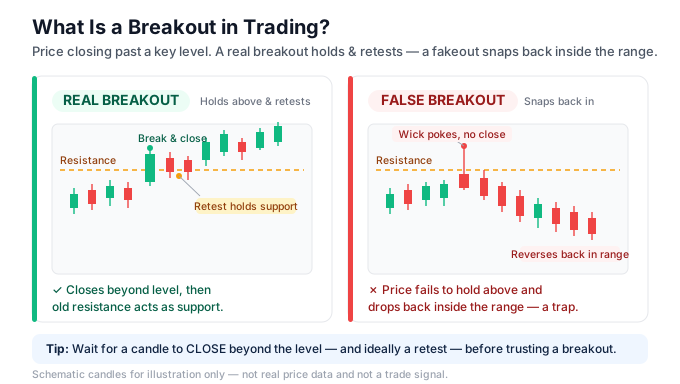
The problem is that not every break is real. Price often pokes a few pips past a level, triggers the resting stops, and then reverses hard — a false breakout, or “fakeout.” Learning to tell a real breakout from a false one is more than half the skill, and we cover it in its own section below.
If you are new to how price and levels work, start with our guide to what is forex trading and our explainer on support and resistance before trading any of the systems here. Everything below assumes you can already mark a level on a chart.
[SCREENSHOT: what-is-a-breakout-in-trading.svg]
The 5 types of breakout strategies
The five setups below are all genuine breakouts, but they differ in how the level is defined and what confirms the break. You do not need all five. Pick the one that matches your session and your screen time, master it, then add another only when you understand why it works.
Each type is a complete standalone system on its own page. This page is the map; the linked pages are the detailed builds, with the indicators, templates, and free downloads.
1. Momentum breakout (ATR volatility expansion)
Type: momentum breakout. This setup ignores static horizontal lines and instead reads volatility expansion. When price has been coiling quietly and then a candle drives beyond the outer edge of an ATR (Average True Range) channel, that surge of range is the momentum breakout — the market has stopped drifting and started moving.
- Timeframe: M15 to H1 works cleanest; the surge is clearer than on M5 noise.
- Tools: an ATR-based channel to frame normal volatility, plus a short-term trend filter (a colour-change trend line or moving average) so you only take breaks in the direction of the immediate bias.
- Rules: wait for a candle to close beyond the outer channel band in the trend-filter’s direction. Enter on that close. Stop back inside the channel, on the other side of the breakout candle; target a multiple of the channel width or the next structure level.
The momentum type is best when a session injects fresh volatility — the London open, or a scheduled release once the first spike settles. It is the most direct expression of the idea that a breakout is a volatility event. For the full logic, our guide to the core forex breakout strategy breaks the momentum entry down step by step.
2. Opening-range / session breakout (congestion release)
Type: opening-range / session breakout. Markets often coil into a tight congestion zone during the quiet hours, then release that energy when a major session arrives. You mark the high and low of the pre-session range (or the first candles after the open) and trade the first clean break of that box.
- Timeframe: M15 for the range and the entry.
- Tools: two horizontal lines marking the range high and low. A momentum confirmation such as a MACD (Moving Average Convergence Divergence) histogram flipping through its zero line adds conviction.
- Rules: mark the congestion box. When a candle closes beyond the box in either direction, enter that way. Stop on the opposite side of the box; target a multiple of the box height. Wait for the close — chasing the first wick out of the box is the classic beginner mistake.
The best-known version is the London open trade, where the Asian-session range breaks as European volume arrives. Our full London breakout forex trading strategy covers the exact session windows and the range-marking rules. For the mechanics of when each session runs, see forex market hours and sessions.
3. Channel / range breakout (swing-defined)
Type: channel/range breakout. Here the level is defined by market structure — the swing highs and lows a ZigZag-style tool marks automatically. Price runs inside a channel or between swing extremes; you place stop-entry orders a few pips beyond the most recent swing and let the breakout fill you.
- Timeframe: H1 to H4, where swings are meaningful rather than noise.
- Tools: a swing/ZigZag indicator to mark the structural high and low, plus a 50 SMA (Simple Moving Average) to confirm which side the trend favours.
- Rules: in an uptrend (price above the 50 SMA), place a buy-stop above the last swing high; the reverse for downtrends. When price breaks the swing, the order fills. Stop below the prior swing; a common take-profit is 1.5× the stop distance, i.e. a 1:1.5 risk-to-reward.
The channel type suits traders who cannot watch the screen all day — the pending orders do the waiting. It is also the cleanest way to trade a market that is stair-stepping in a trend rather than sitting in a flat box.
4. Pattern breakout (support/resistance and reversal)
Type: pattern breakout. This is the classic textbook break: a recognizable structure — a horizontal support/resistance level, a triangle, a flag, or a double top/bottom — resolves in one direction. When the pattern is a reversal at a major level, momentum tools help confirm that the old direction is genuinely exhausted.
- Timeframe: H1 to H4 for the level, dropping to M15 to time the entry.
- Tools: the marked pattern boundary, plus a momentum oscillator (a Fisher-type oscillator or a moving-average ribbon) to confirm the break is backed by a shift in momentum, not a hollow poke.
- Rules: mark the pattern edge. Enter when a candle closes through it and the momentum tool agrees with the break direction. Stop back inside the pattern; target the measured move (the height of the pattern projected from the break point).
The pattern type is the most discretionary of the five — it rewards traders who can read structure. Confirmation is doubly important here, because failed pattern breaks are common and expensive.
5. Pullback-after-breakout (retest re-entry)
Type: pullback-after-breakout. Instead of buying the initial break, you wait for price to clear the level, then come back and retest it before continuing. A broken resistance often becomes support; a broken support often becomes resistance. Entering on that retest gives you a tighter, better-defined stop and filters out most fakeouts.
- Timeframe: M15 to H1.
- Tools: the broken level itself (drawn as a line or a dynamic band such as a SAR-based cloud), plus a reversal-confirmation signal at the retest — a rejection candle, or a SAR oscillator flipping back with the trend.
- Rules: wait for a confirmed break and close beyond the level. Then wait for price to pull back to that level and show rejection (a pin bar, an engulfing candle, or the SAR flip). Enter on the rejection. Stop a few pips beyond the retest low/high; target the next structure level.
The pullback type is the highest-probability of the five for exactly one reason: it sidesteps the false breakout. You are not guessing whether the break is real — you let it prove itself, then join on the retest. The trade-off is that some strong breakouts never pull back, and you miss them. The pullback-after-breakout is a complete method in its own right.
How to confirm a real breakout (and avoid false breakouts)
The false breakout is the reason most breakout traders quit. Price clears the level, you enter, stops get swept, and price snaps back through the level and stops you out. Confirmation is how you cut most of these losses. Three checks do the heavy lifting.
1. Wait for the candle close beyond the level. An intra-bar wick through a level means nothing — wicks poke through and retreat constantly. A candle that closes beyond the level on your trading timeframe is a far stronger signal that the break has commitment behind it. The single most common fakeout mistake is entering on the wick instead of the close.
2. Look for a rise in volatility or volume. A real breakout usually comes with an expansion — a larger candle, a widening ATR reading, or a jump in tick volume. A break on a small, tired candle in thin conditions is suspect. In forex, retail platforms only show tick volume rather than true traded volume, so treat it as a rough activity gauge, not gospel; volatility expansion (candle range, ATR) is often the cleaner read.
3. Prefer a retest. The cleanest confirmation is the pullback-after-breakout in type 5 above: let price break, then come back and respect the level from the other side. A level that flips from resistance to support (or the reverse) and holds on the retest has proven itself. You enter later and miss the runaway breaks, but you avoid the majority of traps.
Timing is its own filter. Breakouts have the best follow-through when a session brings volume — the London open (08:00 GMT) and the London/New York overlap (13:00–17:00 GMT), the most liquid window of the day. Session times are quoted in GMT and shift by one hour when the UK and US observe daylight saving (British Summer Time, roughly late March to late October), so check the clock against your platform. Breakouts attempted during the quiet late-Asian hours fake out far more often, because there is not enough order flow to sustain the move.
[SCREENSHOT: false-breakout-vs-real-breakout.svg]
For a systematic read on how to gauge the odds of a level breaking before you commit, our roundup of the breakout probability indicator shows how these tools frame the same confirmation logic on the chart.
Best indicator, session, and stop for breakout trading
There is no single “best” breakout indicator, because the five types define their level differently. The right tool is the one that frames your level cleanly: an ATR channel for the momentum type, session lines for the opening-range type, a ZigZag for the channel type, pattern lines for the pattern type, and the level-plus-rejection for the pullback type. A momentum oscillator (MACD, or a Fisher-type oscillator) is useful across all five as a confirmation layer — never as the sole trigger.
On stops, the rule is the same for every type: the stop goes on the other side of the level you broke. If a resistance break is real, price should not trade back below the old resistance; if it does, your reason for the trade is gone. Sizing a fixed pip stop and hoping is the wrong order — mark the invalidation level first, then size the position so that distance equals your risk. Our risk-reward calculator and position size calculator do that arithmetic for you.
On XAU/USD (gold), breakouts need wider stops — roughly 1.5× the distance you would use on EUR/USD — because gold’s normal wicks routinely sweep a forex-sized stop before the real move. Gold also fakes out hard around the New York open and high-impact news (NFP, CPI, FOMC), so treat breakouts in those minutes with extra caution.
Common breakout trading mistakes
These are the errors that quietly drain breakout accounts. Each has a specific fix.
- Entering on the wick, not the close. You buy the poke through the level; price closes back inside and stops you out. Fix: wait for a candle to close beyond the level on your timeframe.
- Trading breakouts in dead hours. Forcing a London-style break during the quiet late-Asian session, where there is no volume to sustain it. Fix: trade breaks during the London open or the London/NY overlap.
- Placing the stop too tight, immediately past the level. The retest wicks back to the level and clips you before the move. Fix: put the stop a sensible buffer beyond the level, and size the position to that distance.
- Chasing an extended breakout. Entering ten candles after the break, near the top of the move, into the reversal. Fix: enter on the break-and-close or wait for the retest — never mid-run.
- Ignoring the higher-timeframe context. Taking a long breakout straight into H4 resistance. Fix: check the level one timeframe up before you commit.
- Treating every indicator signal as a trigger. Firing on a MACD cross alone with no level break. Fix: the level break is the trade; the oscillator only confirms it.
How the five types fit together
Think of the five as a toolkit, not a ranking. The momentum and opening-range types get you into fresh moves early but face more false breakouts, so confirmation matters most there. The channel type suits set-and-forget pending orders, and the pattern type rewards structure-reading discretion. The pullback type is the safest re-entry because it lets the break prove itself first.
If you are choosing where to start, match the type to your session. For the London open, use the opening-range/session breakout. If you can only check charts a couple of times a day, the channel breakout with pending orders fits. And if you are cautious and patient, the pullback-after-breakout saves you the most fakeout losses.
Whichever you pick, the discipline is identical across all five: define the level, wait for confirmation, put the stop on the other side of the level, and size to a fixed risk. The setup is the easy part; the confirmation and the risk math are what keep you in the game. For the broader intraday context, see our guide to day trading strategies for the forex market and how to spot trends so you break out with the dominant direction rather than against it.
Frequently asked questions
What is a breakout in forex trading?
A breakout is when price moves decisively beyond a level that was holding it — a support, resistance, range edge, or trendline — and continues in that direction. Levels concentrate orders, so a genuine break often releases a burst of momentum. The catch is the false breakout, where price pokes through, sweeps stops, then reverses.
What are the main types of breakout strategies?
The five main types are the momentum breakout (volatility expansion), the opening-range or session breakout (congestion release at a session open), the channel/range breakout (swing-defined levels), the pattern breakout (triangles, flags, support/resistance, double tops/bottoms), and the pullback-after-breakout (entering on the retest). They differ by how the level is defined and what confirms the break.
How do I confirm a real breakout versus a false one?
Use three checks. First, wait for a candle to close beyond the level, not merely wick through it. Second, look for expanding volatility or volume on the break — a break on a small, tired candle is suspect. Third, wait for a retest: let price break, return to the level, and hold from the other side before you enter.
What is the opening range breakout in forex?
The opening range breakout marks the high and low of a defined range — often the pre-session congestion or the first candles after a major session opens — and trades the first candle that closes beyond that box. The classic version is the London open breaking the Asian-session range as European volume arrives. Stop on the opposite side of the box; target a multiple of its height.
What is the best time to trade breakouts, London or New York?
Trade breakouts when a session brings volume. The London open (08:00 GMT) and the London/New York overlap (13:00–17:00 GMT) are the most liquid, most directional hours, so breaks follow through more reliably there. Session times shift by an hour during daylight saving, so check your clock. The quiet late-Asian hours produce the most false breakouts.
What is the best indicator for breakout trading?
There is no single best one, because each breakout type defines its level differently — an ATR channel for momentum, session lines for the opening range, a ZigZag for swing structure, pattern lines for the pattern break. A momentum oscillator such as MACD or a Fisher-type oscillator works across all five as a confirmation layer, never as the standalone trigger. The level break is the trade; the indicator only confirms it.
Is breakout trading profitable?
Breakout trading can be profitable, but it depends far more on execution than on the setup. Win rates are often modest because false breakouts are common; the edge usually comes from a favourable risk-to-reward — small, well-placed stops on the wrong side of the level and larger targets. Confirmation and disciplined risk management, not the indicator, decide whether the approach works for you.
Where do I put the stop loss on a breakout trade?
Put the stop on the other side of the level you broke. If a resistance break is real, price should not trade back below the old resistance — so that is where the trade is invalidated and where the stop belongs. Avoid a fixed pip count; mark the invalidation level first, then size the position so that distance equals your planned risk. On gold, allow roughly 1.5× wider stops for its larger wicks.
Breakout trading comes down to five ways of defining a level and one shared discipline: wait for the close, confirm with volatility or a retest, put the stop on the other side of the level, and size to a fixed risk. Start with the type that fits your session — the opening-range breakout for the London open, the channel breakout for pending orders, the pullback-after-breakout if you want to sidestep the most fakeouts — then study its full standalone build from the links above.
Forex and CFD trading carries a high level of risk and may not be suitable for all traders. The strategies described in this article are educational. Past performance does not guarantee future results. Always test on a demo account before risking real capital.
Ready to put this into practice?
Open an account with a regulated broker and apply what you have learned. These are the three brokers we recommend:
Trading forex and CFDs carries a significant risk of loss and is not suitable for everyone. Broker links are affiliate links — we may earn a commission at no cost to you.