

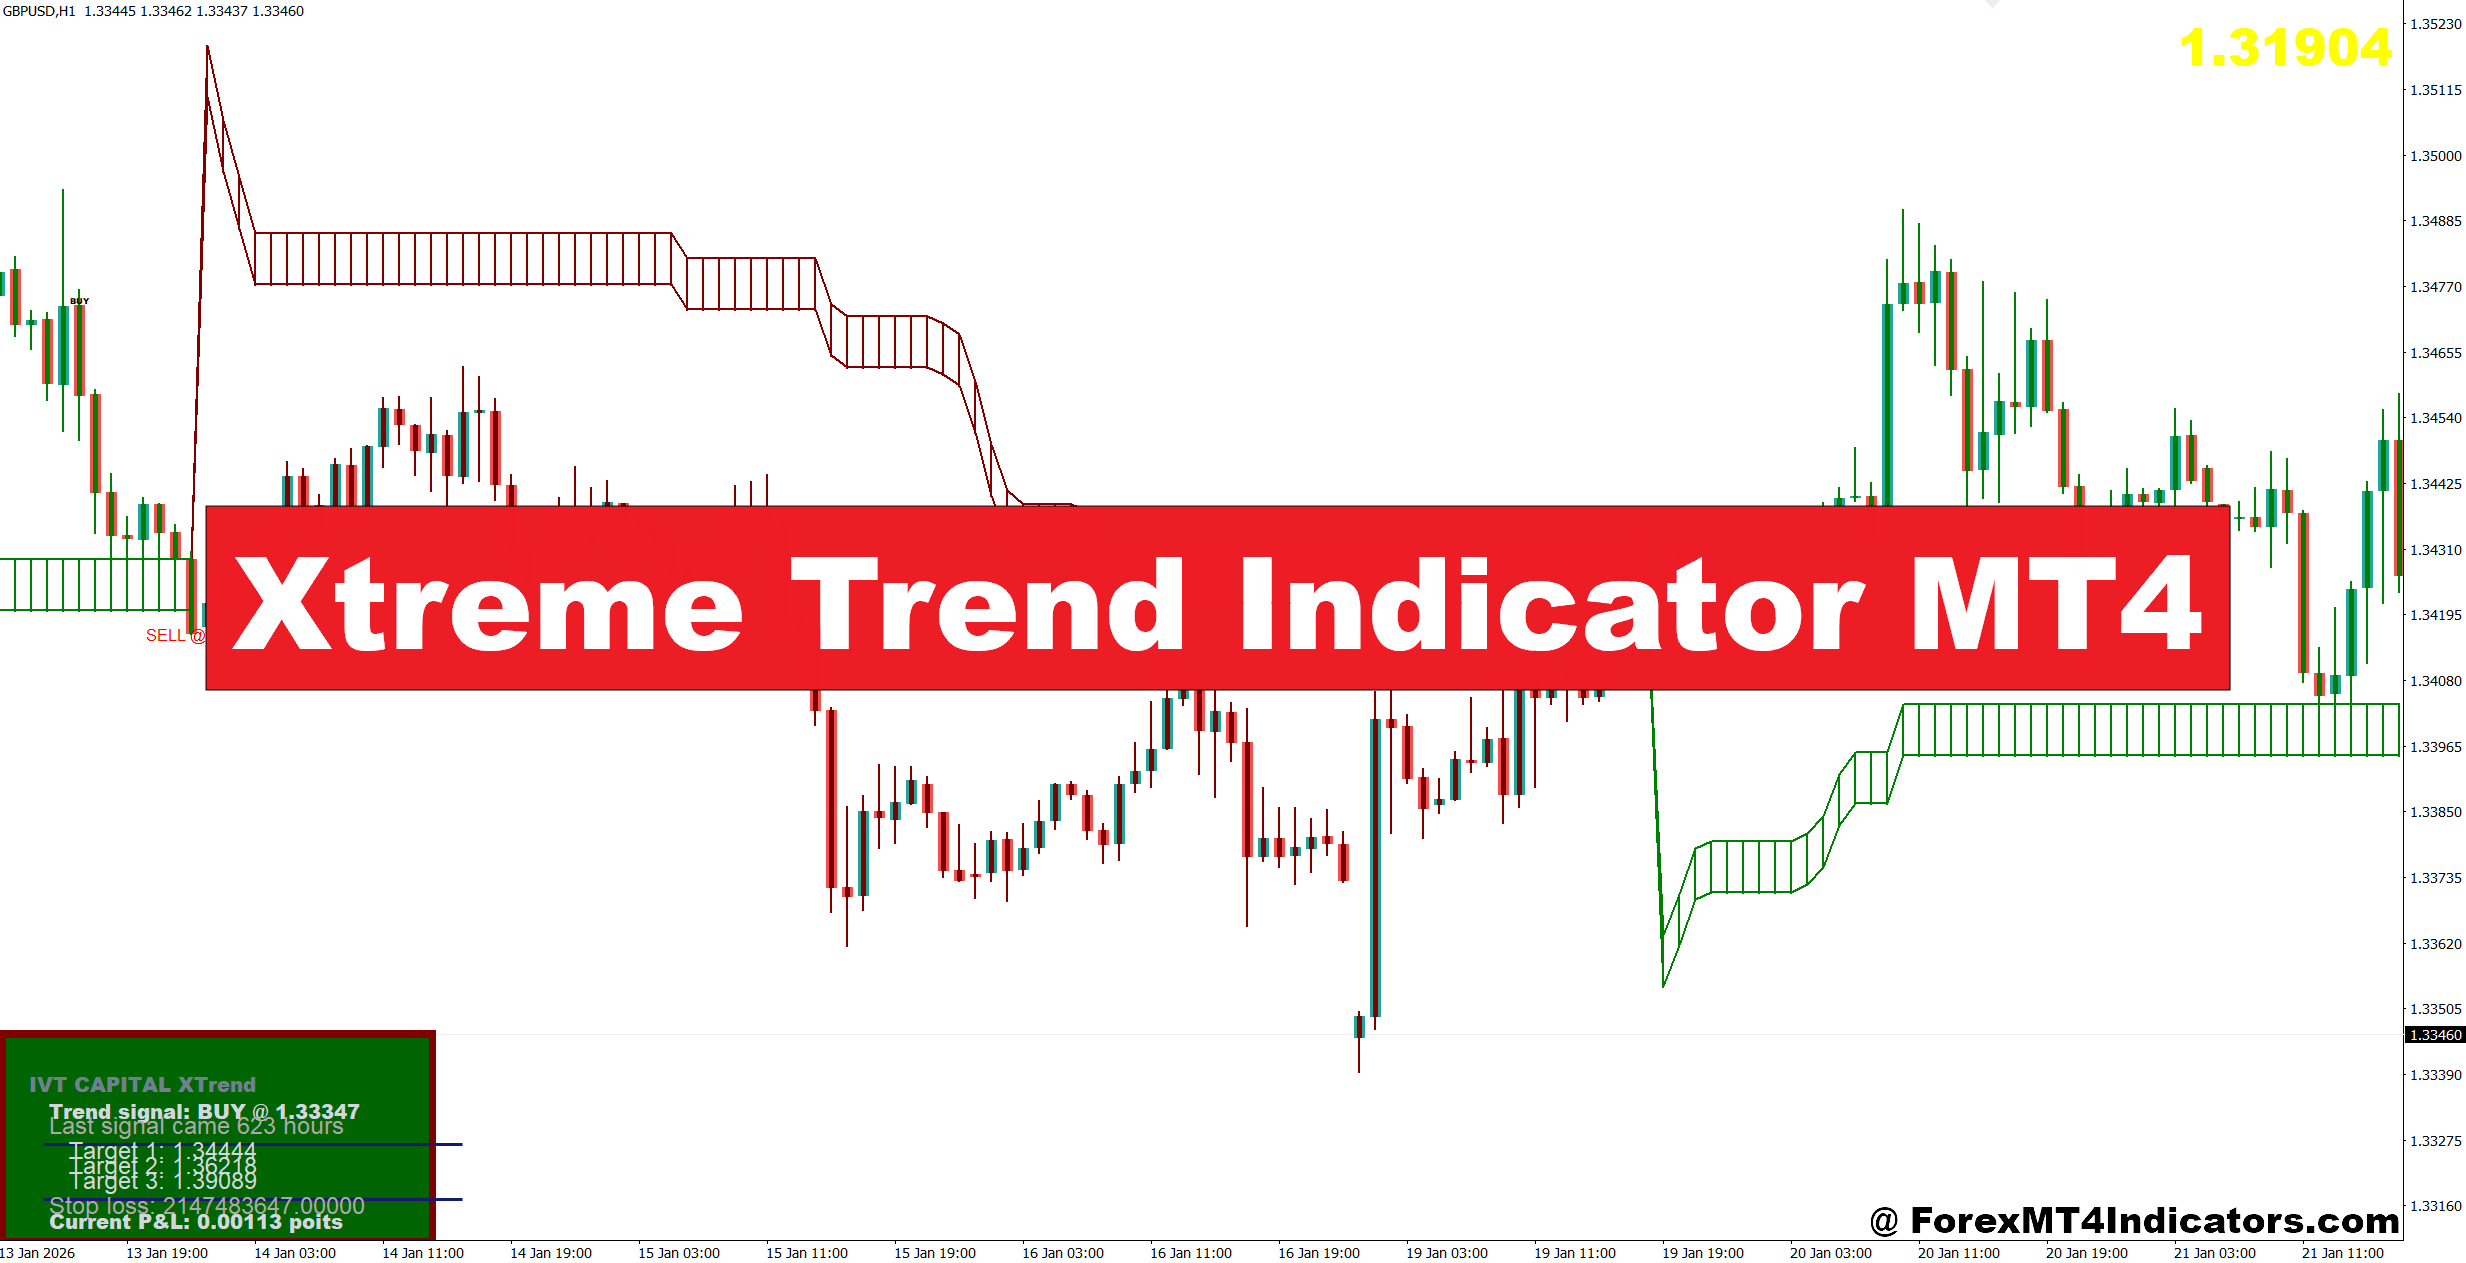
The Xtreme Trend Indicator MT4 was designed to reduce that uncertainty by helping traders identify the dominant market direction before placing a trade. Instead of reacting to every price swing, it focuses on filtering short-term market noise and highlighting stronger trends. During testing on EUR/USD and GBP/USD, traders often noticed that waiting for the indicator to confirm a trend reduced many poor-quality entries, even though it occasionally produced late signals. That trade-off is worth understanding before adding it to any strategy. The following sections explain how the indicator works, where it performs best, and how traders can use it alongside price action for better decision-making.
What Is the Xtreme Trend Indicator MT4?
The Xtreme Trend Indicator MT4 is a trend-following technical analysis tool built for the MetaTrader 4 platform. Its primary goal is to identify the current market direction and display trend changes in a simple visual format. Depending on the version, it may use colored trend lines, arrows, or histogram signals to indicate bullish and bearish momentum.
Unlike a basic Moving Average that reacts only to price, this indicator typically combines price smoothing with momentum calculations to reduce short-term fluctuations. The result is a cleaner trend signal that helps traders stay with the prevailing direction instead of reacting to every small pullback.
For example, when EUR/USD on the 1-hour chart moved higher by nearly 90 pips after the London session opened, the indicator remained bullish throughout the move. A standard 20-period Moving Average produced several small crossover signals during the same period, while the Xtreme Trend Indicator stayed focused on the larger trend.
Still, no trend indicator predicts future prices. It simply analyzes historical price data and responds when market conditions change.
How the Indicator Works in Live Market Conditions
Most versions of the Xtreme Trend Indicator MT4 calculate trend direction using smoothed price values, historical candle data, and momentum measurements. Some variations also include volatility filters to reduce false signals during sideways markets.
When price remains above the calculated trend line or bullish threshold, the indicator maintains a buy signal. If momentum weakens and price closes below the trend level, it changes to a sell signal. This delayed confirmation helps filter random price spikes but may enter after part of the move has already happened.
A practical example shows why this matters.
USD/JPY on the 4-hour chart formed a strong bullish structure after breaking resistance. The indicator changed from bearish to bullish after two confirmed candles. Price had already advanced about 18 pips before the signal appeared, but the pair continued climbing another 120 pips during the following sessions. Waiting for confirmation meant giving up a small portion of the move while avoiding an earlier fake breakout.
When testing this during high-impact NFP releases, trend changes became less reliable because volatility caused sharp price swings. Experienced traders often waited for the first 15 to 30 minutes after the news before trusting any trend signal.
The indicator works best when traders combine it with market structure, support and resistance, or candlestick confirmation rather than using it alone.
Practical Trading Strategies Using Xtreme Trend Indicator MT4
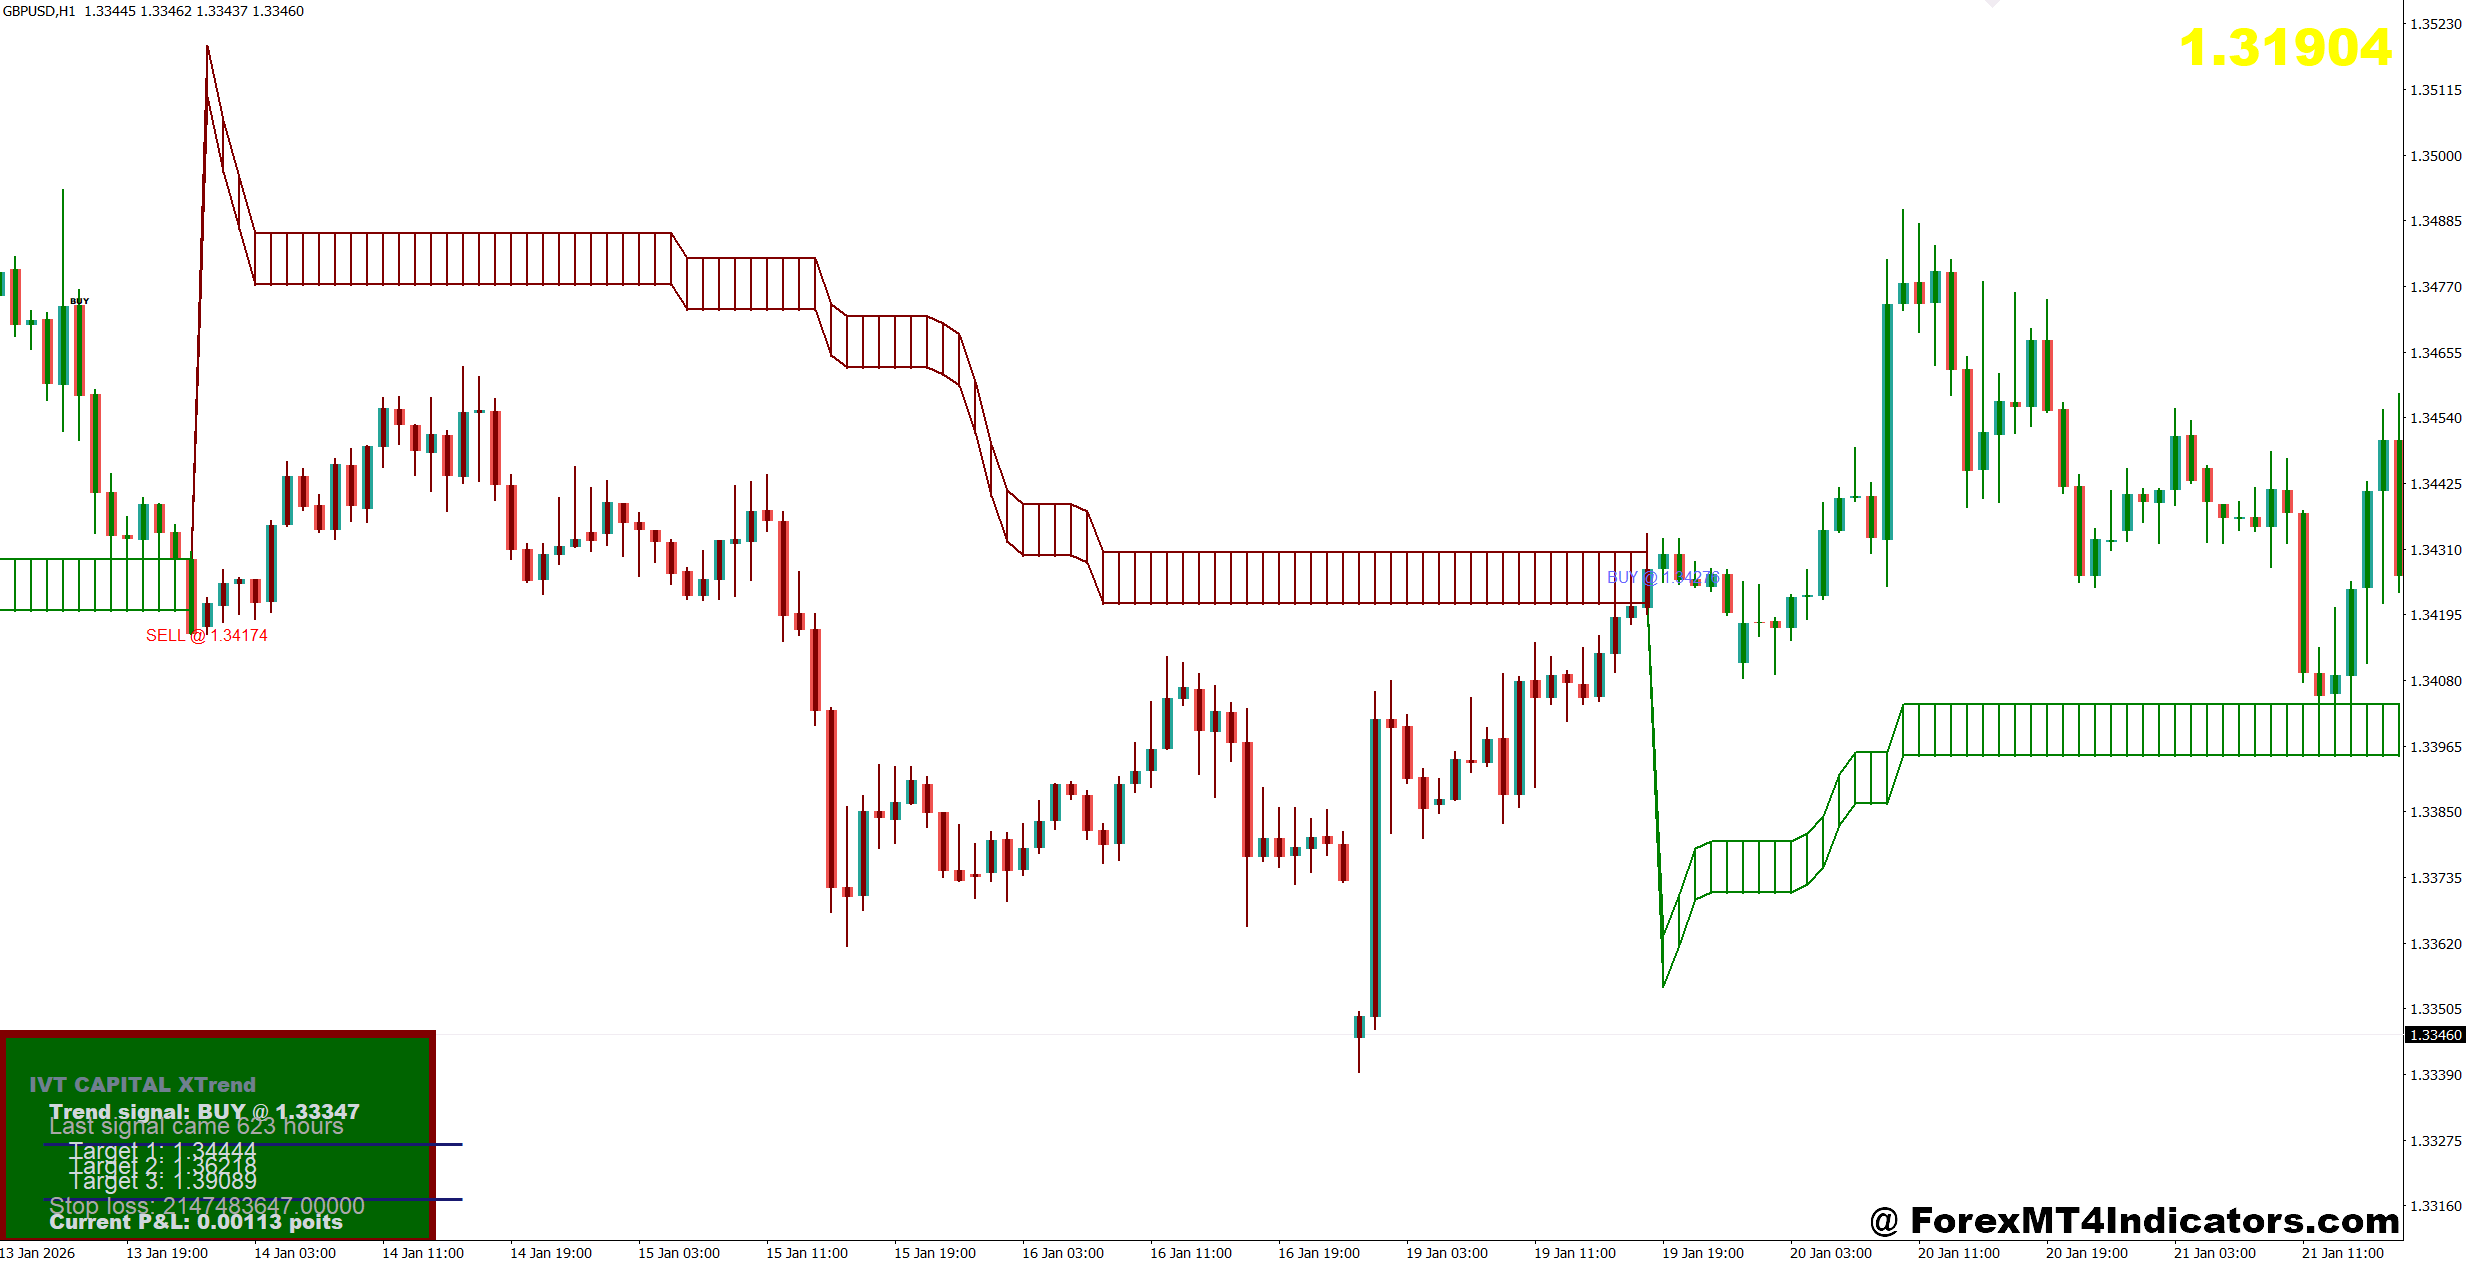
The indicator performs well in trending environments where price creates higher highs and higher lows or lower highs and lower lows.
One common approach is trend continuation trading.
A trader watches GBP/USD on the 4-hour timeframe. The indicator remains bullish while price pulls back toward a previous support level. Instead of buying immediately, the trader waits for a bullish engulfing candle to form. Once the candle closes above support and the indicator still shows an uptrend, the buy entry becomes more reliable.
Risk management remains essential. Many traders place stop-loss orders 20 to 35 pips below the recent swing low on major pairs or use 1.5 times the Average True Range (ATR) as a volatility-based stop. Profit targets often range from a 1:2 to 1:3 risk-to-reward ratio depending on market conditions.
Another practical method involves combining the indicator with the 200-period Exponential Moving Average. If both point upward, buying opportunities generally have higher probability than trading against the larger trend.
But traders should stay cautious during ranging markets. If price repeatedly crosses the indicator without establishing higher highs or lower lows, the market is likely in chop. That environment often creates whipsaws that reduce overall performance.
Trading forex carries substantial risk. No indicator guarantees profits.
Best Settings, Customization, and Comparison With Similar Indicators
The default settings usually provide balanced performance for most currency pairs. Many traders leave them unchanged while adjusting only the trading timeframe.
Typical preferences include:
- M15 for active intraday trading with tighter stops.
- H1 for swing opportunities lasting several hours.
- H4 and Daily for position trading focused on larger market trends.
Lower timeframes generate more signals but also increase market noise. Higher timeframes generally produce fewer entries while improving signal quality.
Some traders increase smoothing values to reduce false alerts during volatile sessions. Others lower the sensitivity when trading fast-moving pairs such as GBP/JPY. Testing these adjustments on a demo account helps determine which configuration matches the trading style.
Compared with a traditional Moving Average crossover, the Xtreme Trend Indicator reacts more slowly but usually filters more false entries. Against Supertrend, it often produces similar directional signals but may remain in a trend longer before reversing. Compared with MACD, it offers easier visual interpretation, while MACD provides more detailed momentum information.
What makes this difference useful? It depends on the strategy. Traders looking for early reversals may prefer MACD, while those wanting clearer trend confirmation often appreciate the smoother behavior of the Xtreme Trend Indicator.
No single indicator fits every market. Strong trends reward trend-following systems, while quiet ranging markets usually require different tools altogether.
The best results often come from combining this indicator with support and resistance, price action, volume analysis, and disciplined risk control rather than relying on a single technical signal.
How to Trade with Xtreme Trend Indicator MT4
Buy Entry
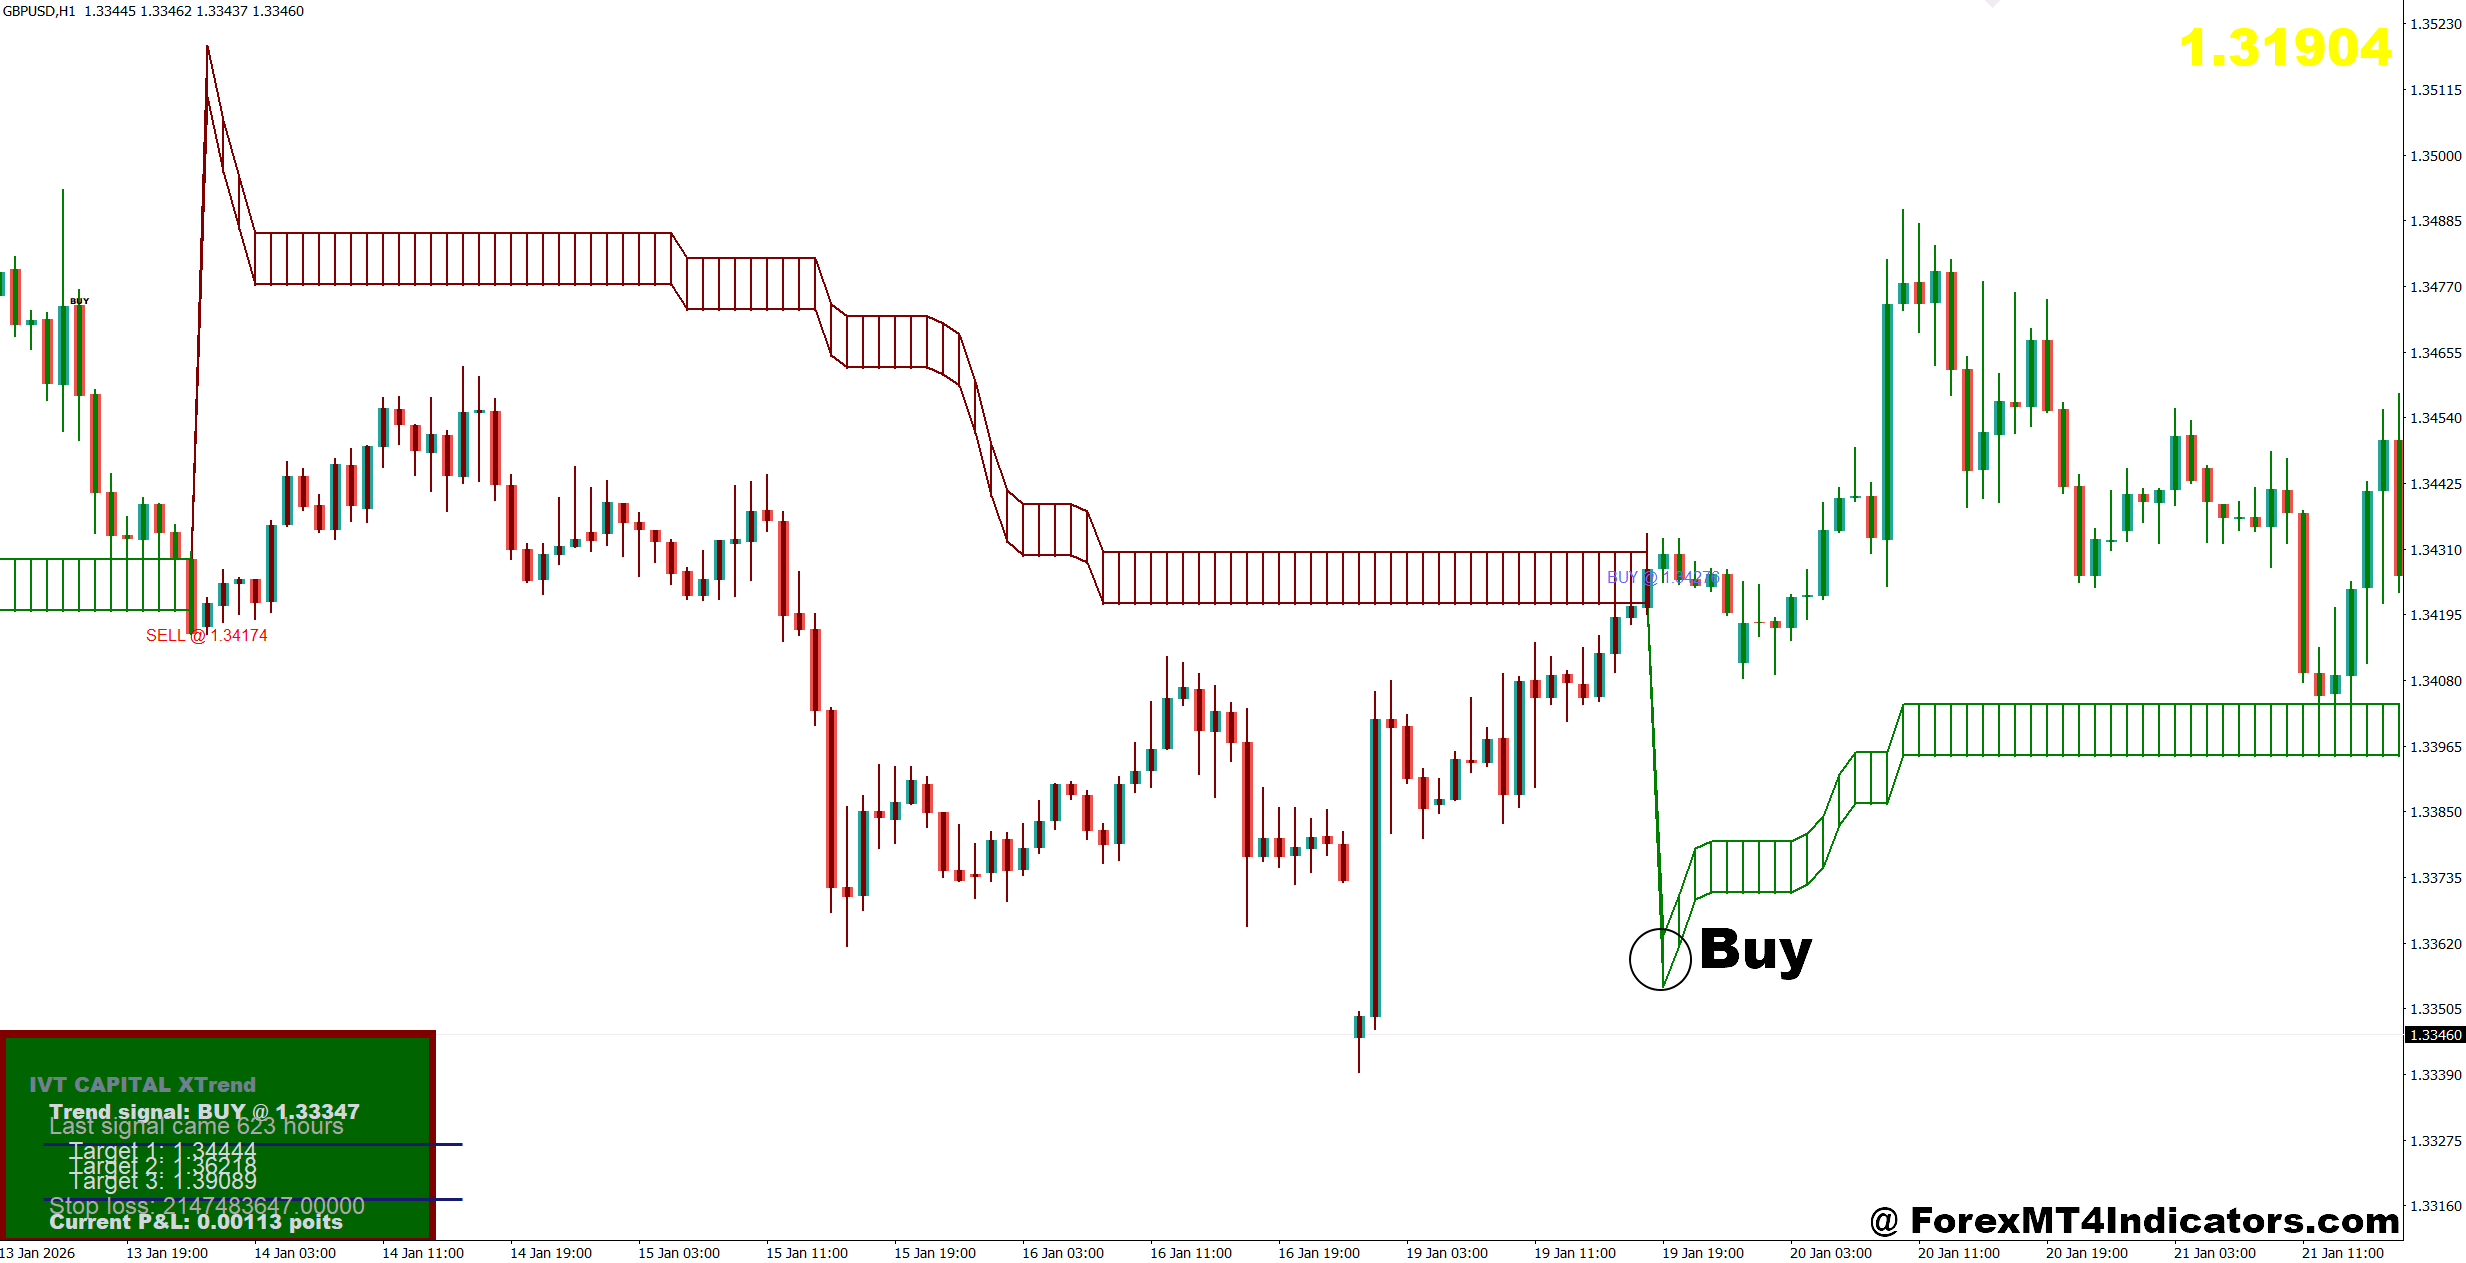
- Wait for a fresh BUY signal – Enter after the indicator turns bullish and the candle closes above it on the 1-hour EUR/USD chart.
- Trade with the higher trend – Confirm the 4-hour trend is bullish before buying to improve trade quality.
- Buy after a pullback – Enter when price bounces from support while the indicator remains bullish, aiming for 30-80 pips.
- Confirm with a bullish candle – Wait for a bullish engulfing or strong bullish close before opening a trade.
- Use a tight stop-loss – Place the stop 20-30 pips below the recent swing low or key support.
- Target a healthy reward – Aim for at least a 1:2 risk-to-reward ratio or 50-100 pips on trending markets.
- Avoid low-volatility sessions – Skip buy entries during tight ranges or before major news like NFP.
- Protect your capital – Risk only 1-2% of your account on each buy trade.
Sell Entry
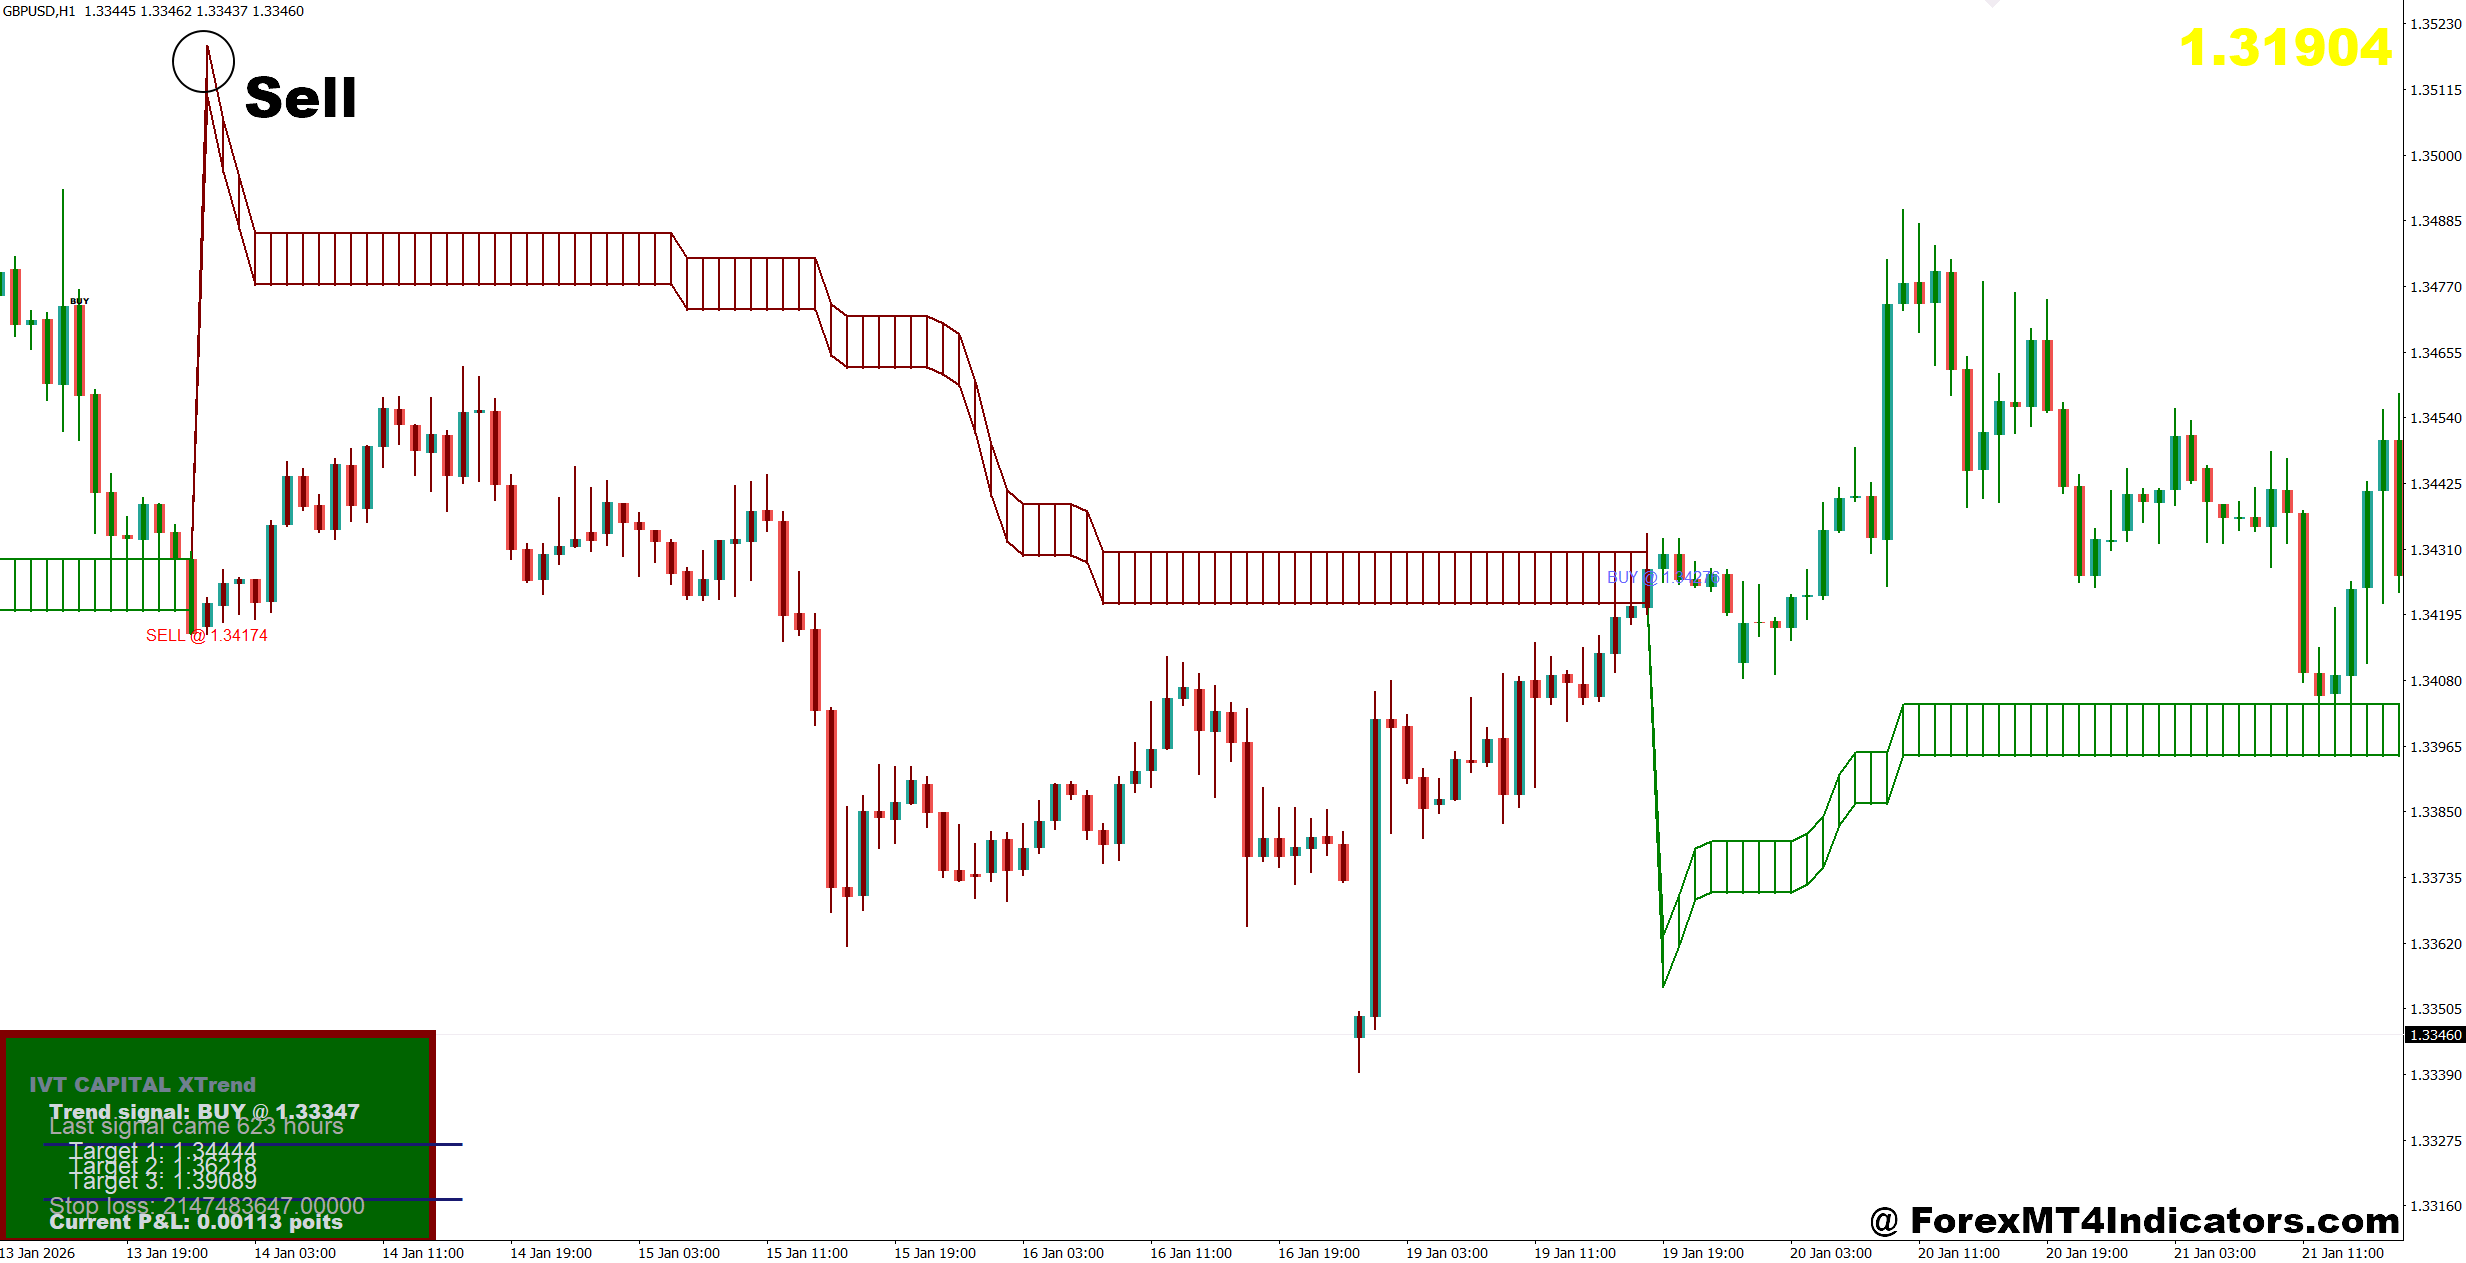
- Wait for a fresh SELL signal – Sell after the indicator turns bearish and the candle closes below it on the 1-hour GBP/USD chart.
- Follow the higher timeframe – Take sell trades only when the 4-hour or Daily trend is also bearish.
- Sell after a retracement – Wait for price to reject resistance while the indicator stays bearish, targeting 30-80 pips.
- Confirm bearish momentum – Enter after a bearish engulfing or strong bearish candle closes.
- Set a protective stop – Place the stop-loss 20-30 pips above the latest swing high.
- Lock in profits wisely – Consider partial profit after 40-50 pips and trail the remaining position.
- Stay out of choppy markets – Don’t sell when the indicator changes direction repeatedly within a few candles.
- Manage risk every trade – Keep risk below 2% and avoid trading against major support zones.
The Xtreme Trend Indicator MT4 gives traders a straightforward way to identify market direction while filtering some of the noise that causes emotional trading. It performs best when markets establish clear trends, it works well alongside price action and support or resistance analysis, it benefits from sensible risk management with realistic stop-loss levels, and it should always be treated as one part of a complete trading plan rather than a standalone solution. Traders who spend time testing the indicator across different currency pairs and timeframes often gain a better understanding of where it performs well and where patience is the smarter decision.
Level up your trading
Learn to read the chart — not just the indicator
eBook · Instant PDF
Video Course · 12 modules
Recommended MT4/MT5 Brokers
- ✓ *FREE *$50 to start (withdrawable)
- ✓ Deposit bonus up to $5,000
- ✓ Negative balance protection
Trading forex and CFDs carries a significant risk of loss and is not suitable for everyone. Broker links are affiliate links — we may earn a commission at no cost to you.
Free MT4 Indicator Download

Enter Your Email Address below, download link will be sent to you.