

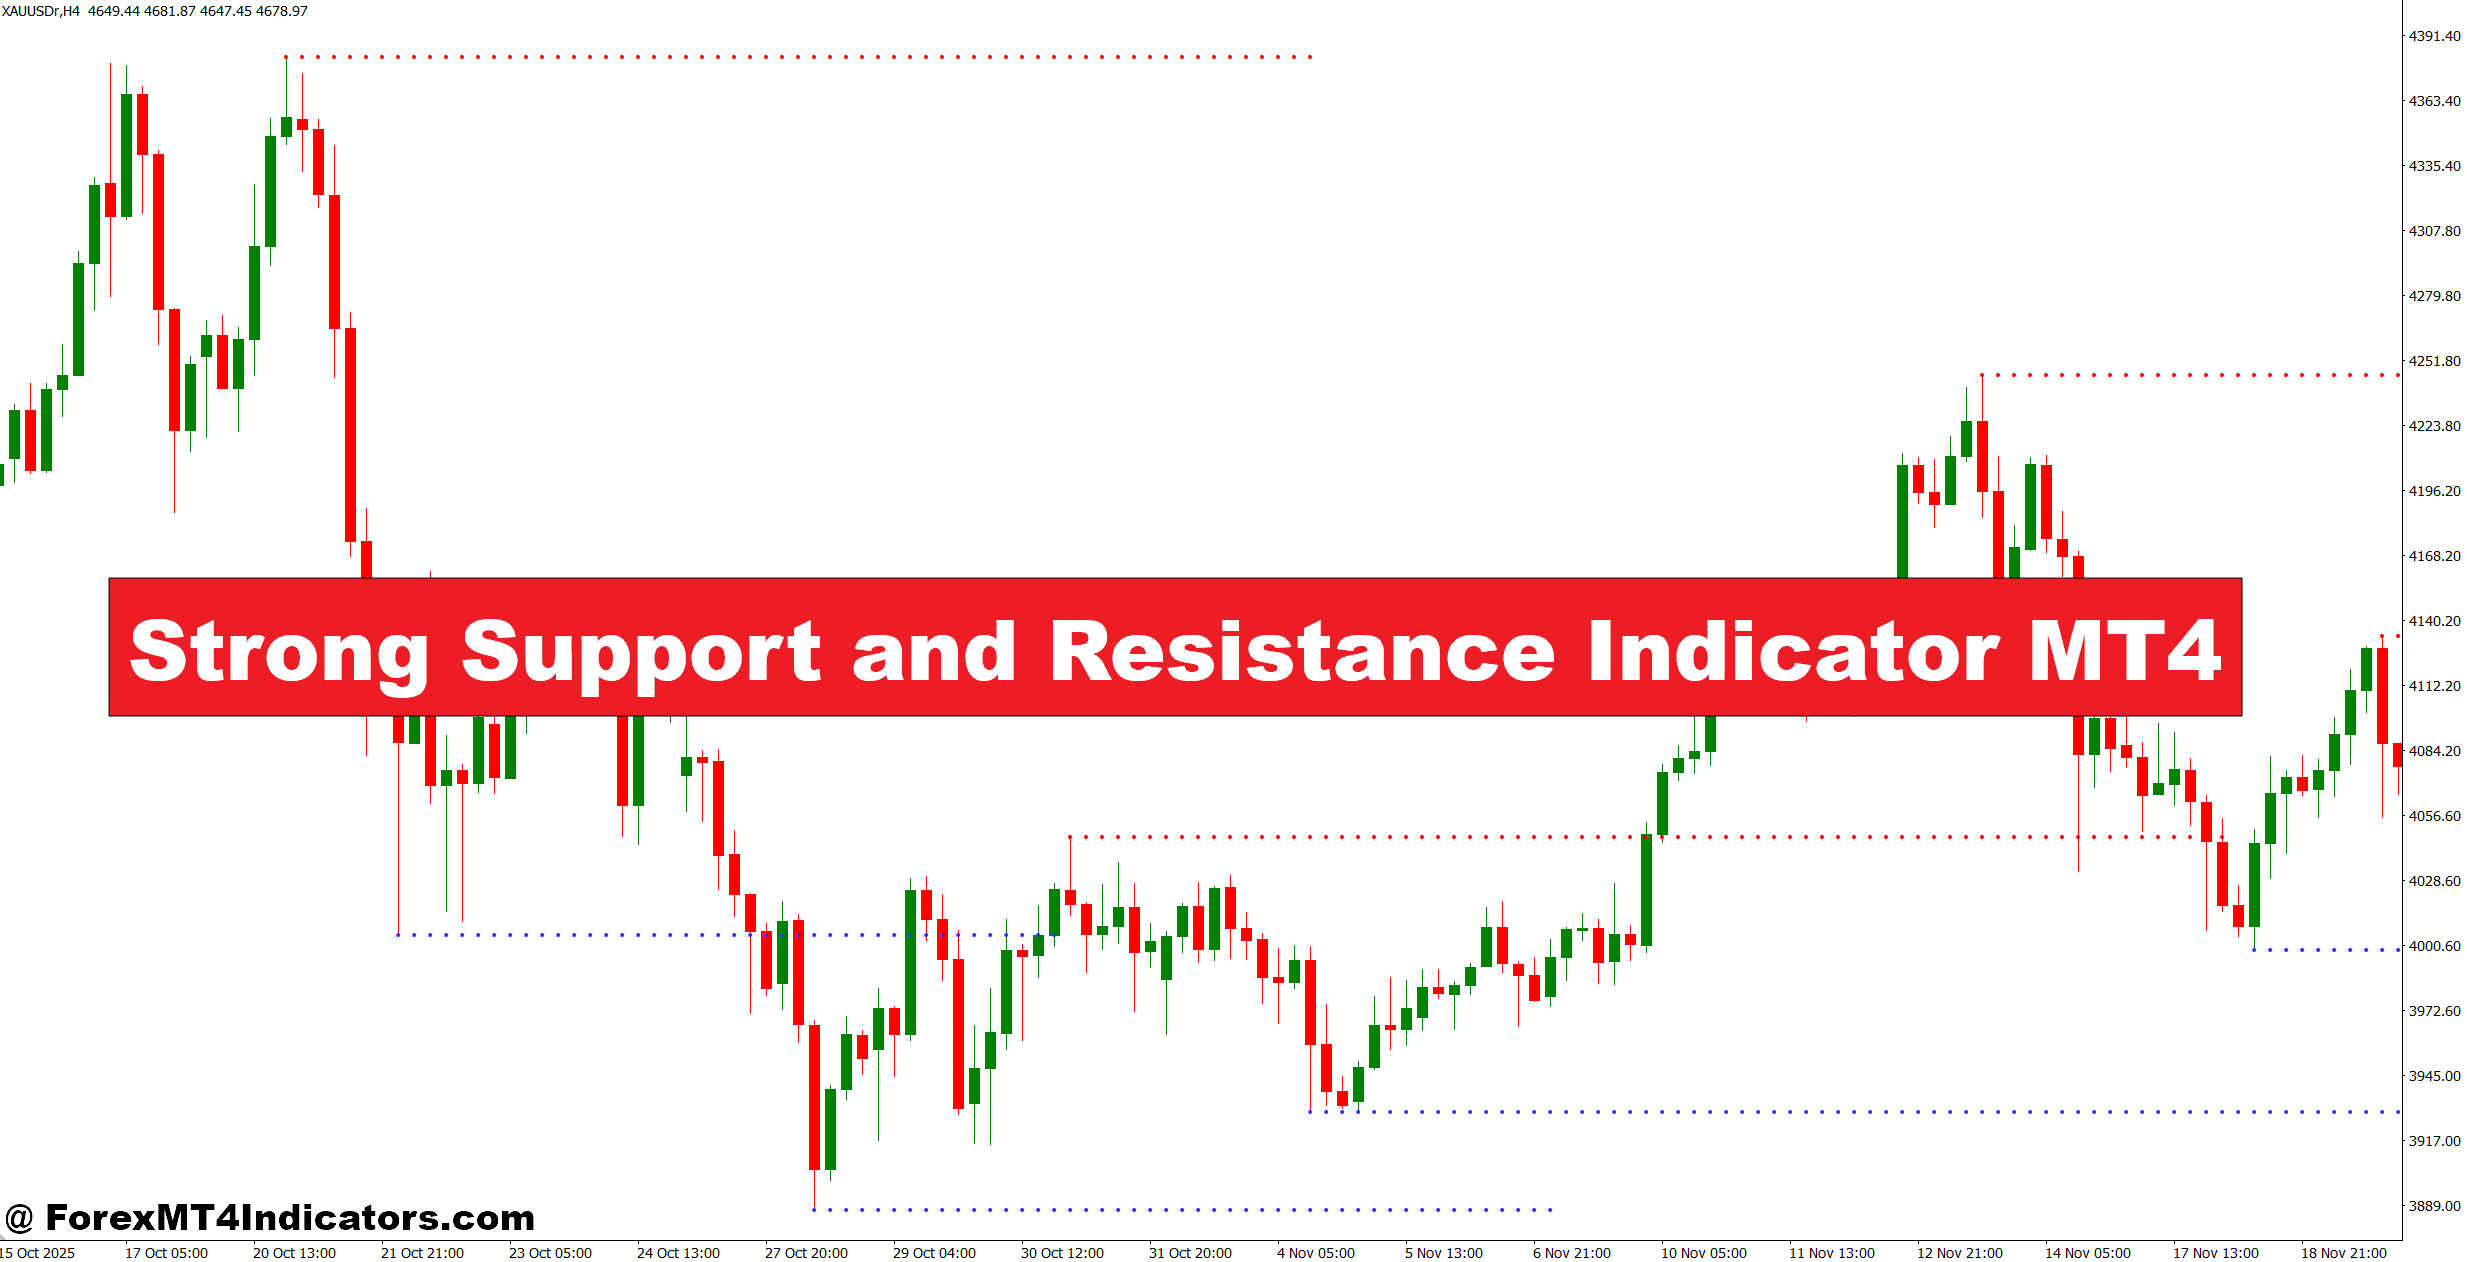
The Strong Support and Resistance Indicator MT4 helps traders identify important price areas directly on the MetaTrader 4 chart. Instead of relying only on manually marked levels, traders can use the indicator to locate zones where price has shown repeated reactions. This can make entry planning more structured and reduce random trades.
The tool works best when its levels are combined with market structure, candle behavior, and trend direction. Here’s how traders can use it without treating every marked zone as an automatic buy or sell signal.
What Is the Strong Support and Resistance Indicator MT4?
The Strong Support and Resistance Indicator MT4 is a technical analysis tool designed to highlight price areas where buying or selling pressure has previously caused meaningful reactions. Support generally appears below the current market price, while resistance forms above it.
Most versions of this type of indicator analyze historical swing highs, swing lows, repeated price reactions, or clusters of turning points. Some versions also consider the number of times price has touched a level and the distance between nearby reactions. The exact calculation depends on the indicator’s coding and settings, so traders should check the version they install rather than assume every MT4 indicator works identically.
A useful way to think about support and resistance is as a zone rather than a single price. For example, if EUR/USD repeatedly reacts between 1.0820 and 1.0830, treating 1.0825 as an exact turning point can be misleading. A 10-pip area gives the trader more realistic room for spread, volatility, and temporary price penetration.
How the Logic Works
A typical support/resistance algorithm searches historical candles for significant turning points. It can then group nearby highs or lows into price zones. Stronger areas may receive more visual emphasis when several reactions occur around the same region.
For example, suppose GBP/USD forms swing lows near 1.2680, 1.2692, and 1.2686 over several sessions. The indicator may combine those reactions into a support area around 1.2680–1.2695.
The strength of a level isn’t determined only by the number of touches. A level that has been tested five times can eventually become easier to break because resting orders around it have already been absorbed. Traders should therefore consider freshness, rejection quality, trend direction, and higher-timeframe structure.
How Traders Can Use Support and Resistance Levels
The strongest use of the indicator is trade location. It helps traders ask a better question: where does the current setup make sense?
Consider EUR/USD on the 1-hour chart. Suppose price is trading at 1.0860 and the indicator marks support between 1.0825 and 1.0835. Price falls into that area, forms a bullish rejection candle, and then closes back above 1.0840. A trader could wait for a move above the rejection candle’s high instead of buying the first touch.
A possible setup might look like this:
- Entry: 1.0845
- Stop-loss: 1.0818
- Risk: 27 pips
- First target: 1.0890
- Potential reward: 45 pips
That gives roughly a 1:1.7 risk-to-reward ratio before considering later targets.
The same principle works for resistance. If GBP/USD reaches a marked resistance zone around 1.2760–1.2775 and produces two failed attempts above 1.2770, traders can watch for bearish confirmation. A break below a nearby intraday swing low may offer a cleaner entry than selling simply because price touched resistance.
On lower timeframes, the indicator can help with trade location, but noise increases. A level on the 5-minute chart may be broken several times during a London session. Higher-timeframe zones generally deserve more attention when they overlap with current market structure.
Settings for Different Pairs and Timeframes
There isn’t one perfect setting for every market. A setup that works reasonably well on EUR/USD H1 may react too slowly on a 5-minute chart or produce excessive levels on a volatile pair such as GBP/JPY.
For a starting point, traders can test these approaches:
- M5–M15: Use shorter lookback values and focus on recent swing points. A zone covering 5–12 pips can be useful for liquid major pairs, although spreads and session volatility must be considered.
- H1: A medium lookback can help filter minor intraday levels. Zones covering roughly 10–30 pips are common in active major-pair conditions.
- H4: Use a wider historical range because significant swing points matter more. A 25–60 pip zone can sometimes be more realistic depending on the pair.
- Daily: Prioritize major weekly and daily turning points. A level may span 40–100 pips on a volatile pair, so exact pip distances should not be treated as fixed rules.
During testing on volatile NFP sessions, traders should expect price to move through normal support or resistance by 15–30 pips before deciding whether the level has actually failed. News candles can overwhelm technical levels for several minutes.
One practical habit is to mark the H4 or daily levels first, then use H1 or M15 for the entry. That keeps a trader from giving too much weight to a minor intraday zone.
Advantages, Limitations, and Comparison With Other Tools
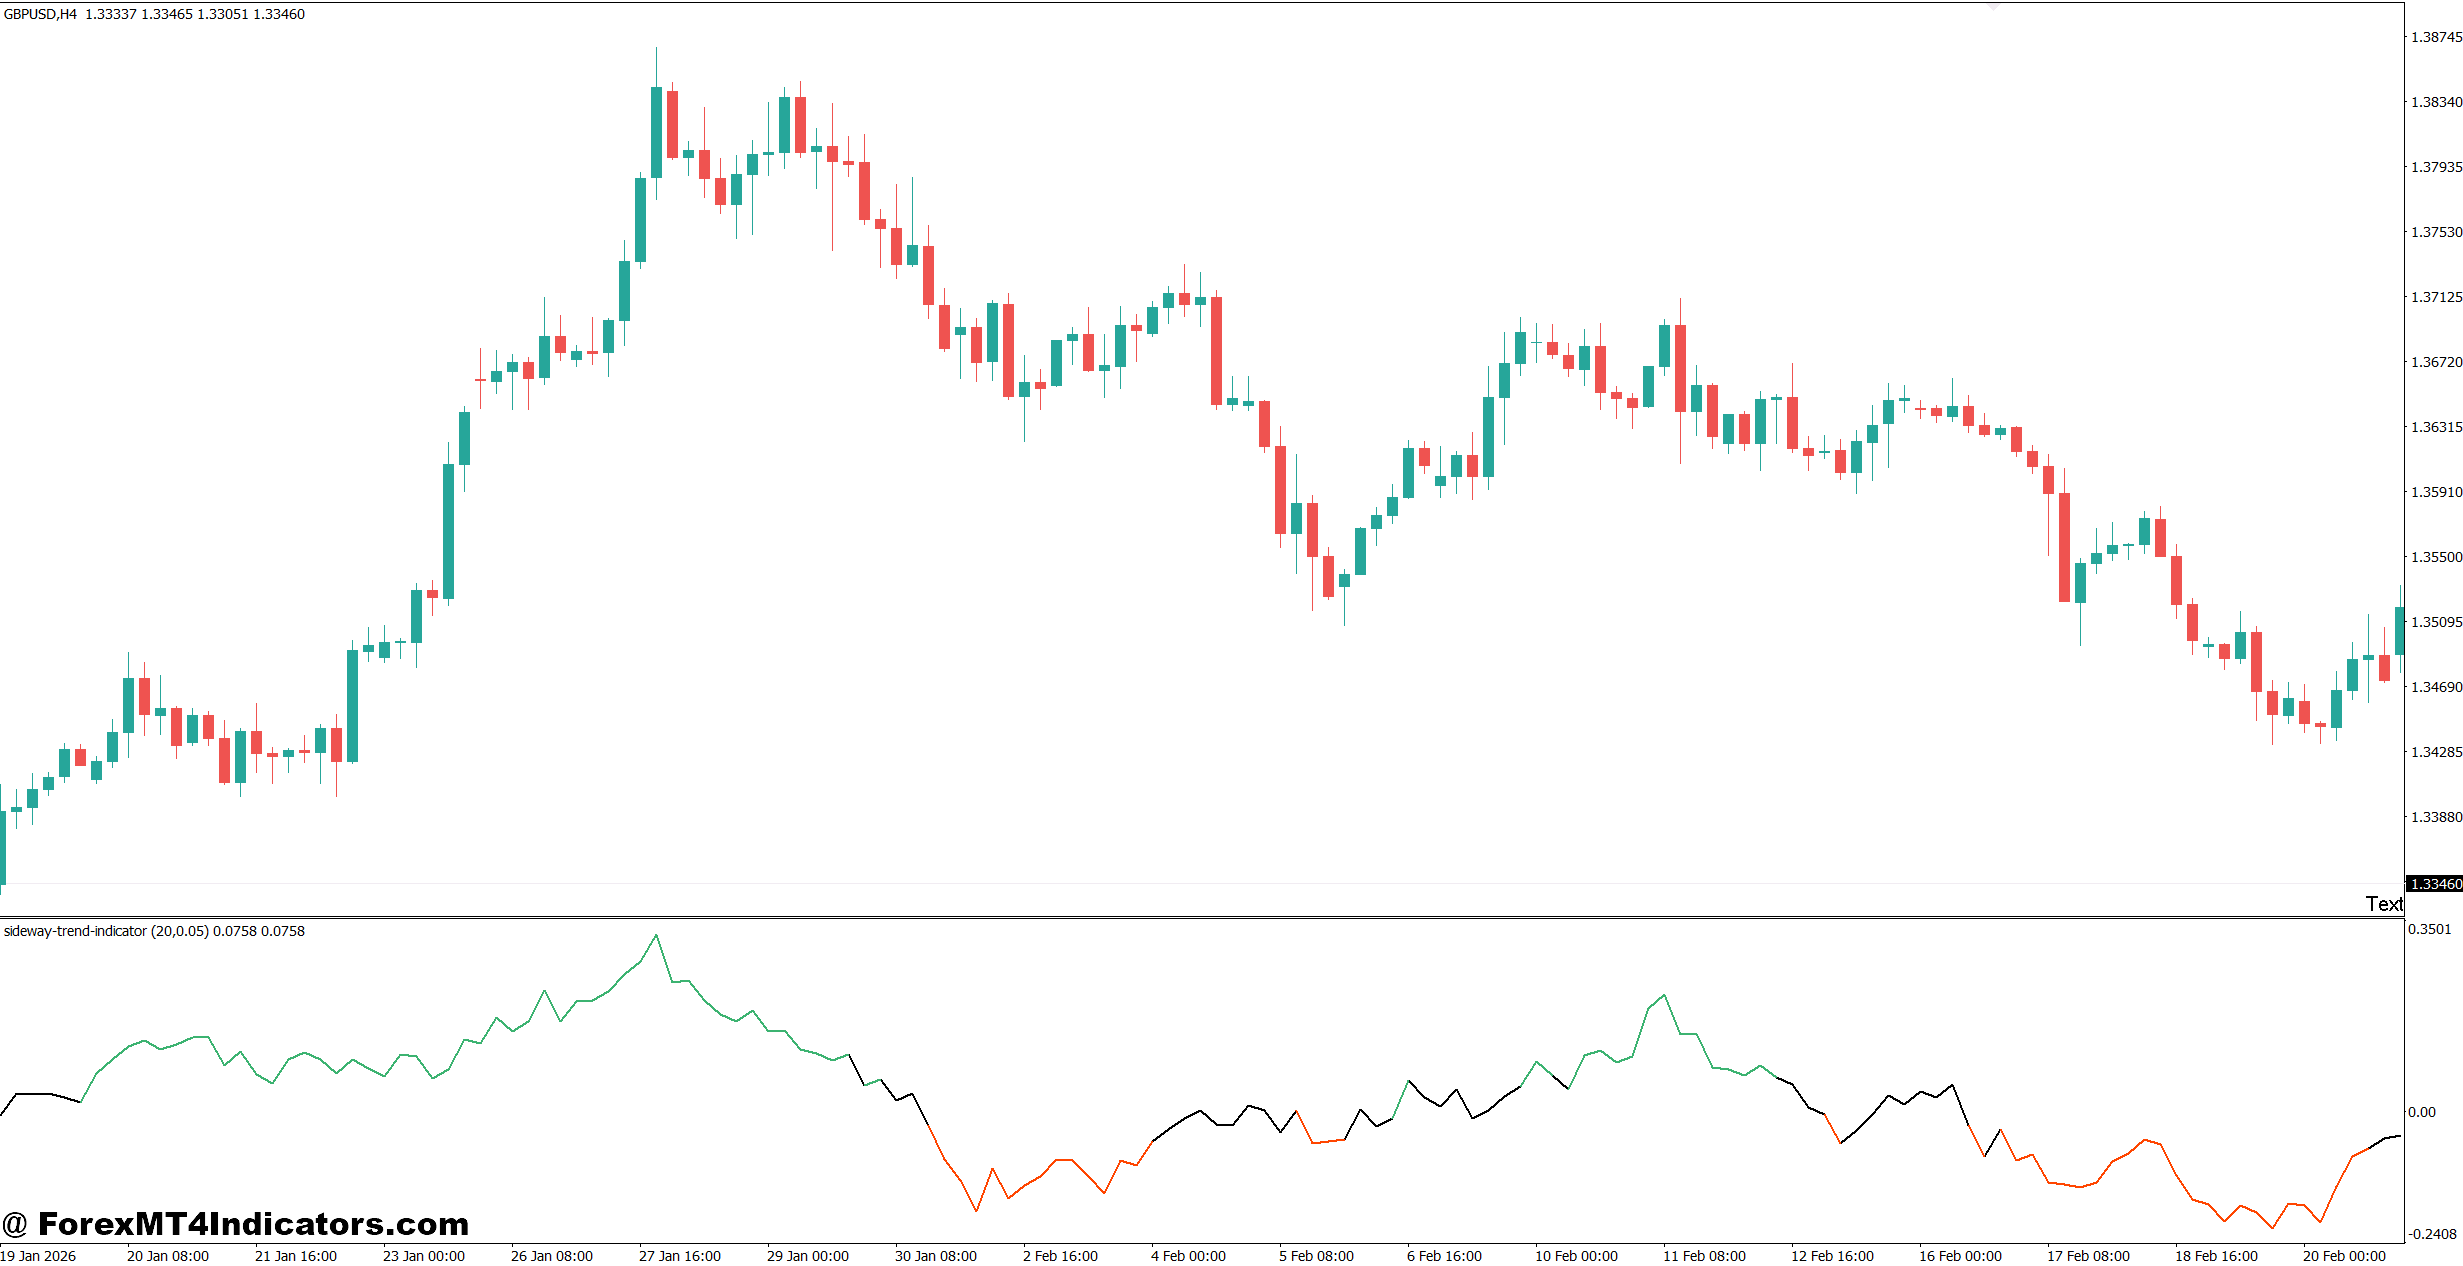
The biggest advantage is speed. Instead of manually scanning dozens of candles for every swing point, the indicator can provide a visual starting point. It also helps traders maintain consistent chart analysis across several currency pairs.
But the indicator has limits. Historical price reactions don’t guarantee another reaction. A support zone can fail during a strong bearish trend, while resistance can disappear after a major bullish breakout. Repainting behavior can also vary between indicator versions, so traders should test whether historical levels remain fixed after new candles appear.
Compared with manually drawn support and resistance, the indicator is faster but less discretionary. Manual analysis allows an experienced trader to judge context, such as a major weekly high, a previous breakout point, or a liquidity sweep.
Compared with Bollinger Bands, the purpose is different. Bollinger Bands measure price deviation around a moving average, while support and resistance analysis focuses on historical price reaction areas. RSI can help identify momentum conditions, but an RSI reading of 70 doesn’t automatically mean resistance will hold.
A stronger setup often comes from combining tools. For example, if EUR/USD reaches H4 resistance, RSI shows weakening momentum on H1, and a bearish candle breaks a short-term swing low, the resistance level has several pieces of supporting evidence.
That said, traders shouldn’t stack five indicators and wait for every one to agree. Too many signals can create analysis paralysis.
Risk Management Matters More Than the Indicator
A technically strong level can still produce a losing trade. That makes position sizing essential.
If a trader has a $5,000 account and risks 1%, the maximum planned loss is $50. With a 25-pip stop on EUR/USD, the position size should be calculated so that a full stop-out remains close to that $50 limit.
Stops should also make structural sense. Placing a stop only 3–5 pips beyond a support zone may look attractive on paper, but ordinary volatility can trigger it before the expected move begins. On the other hand, an excessively wide stop can make the trade financially inefficient.
Traders should also avoid entering immediately before major economic releases unless the strategy has been specifically tested for those conditions. CPI, NFP, central-bank decisions, and unexpected geopolitical headlines can produce price movement that ignores nearby technical levels.
Trading forex carries substantial risk. No indicator guarantees profits. The Strong Support and Resistance Indicator MT4 should be treated as an analysis aid, not an independent trading system. Traders should backtest settings, forward-test them on a demo account, and use controlled risk before committing real capital.
How to Trade with Strong Support and Resistance Indicator MT4
Buy Entry
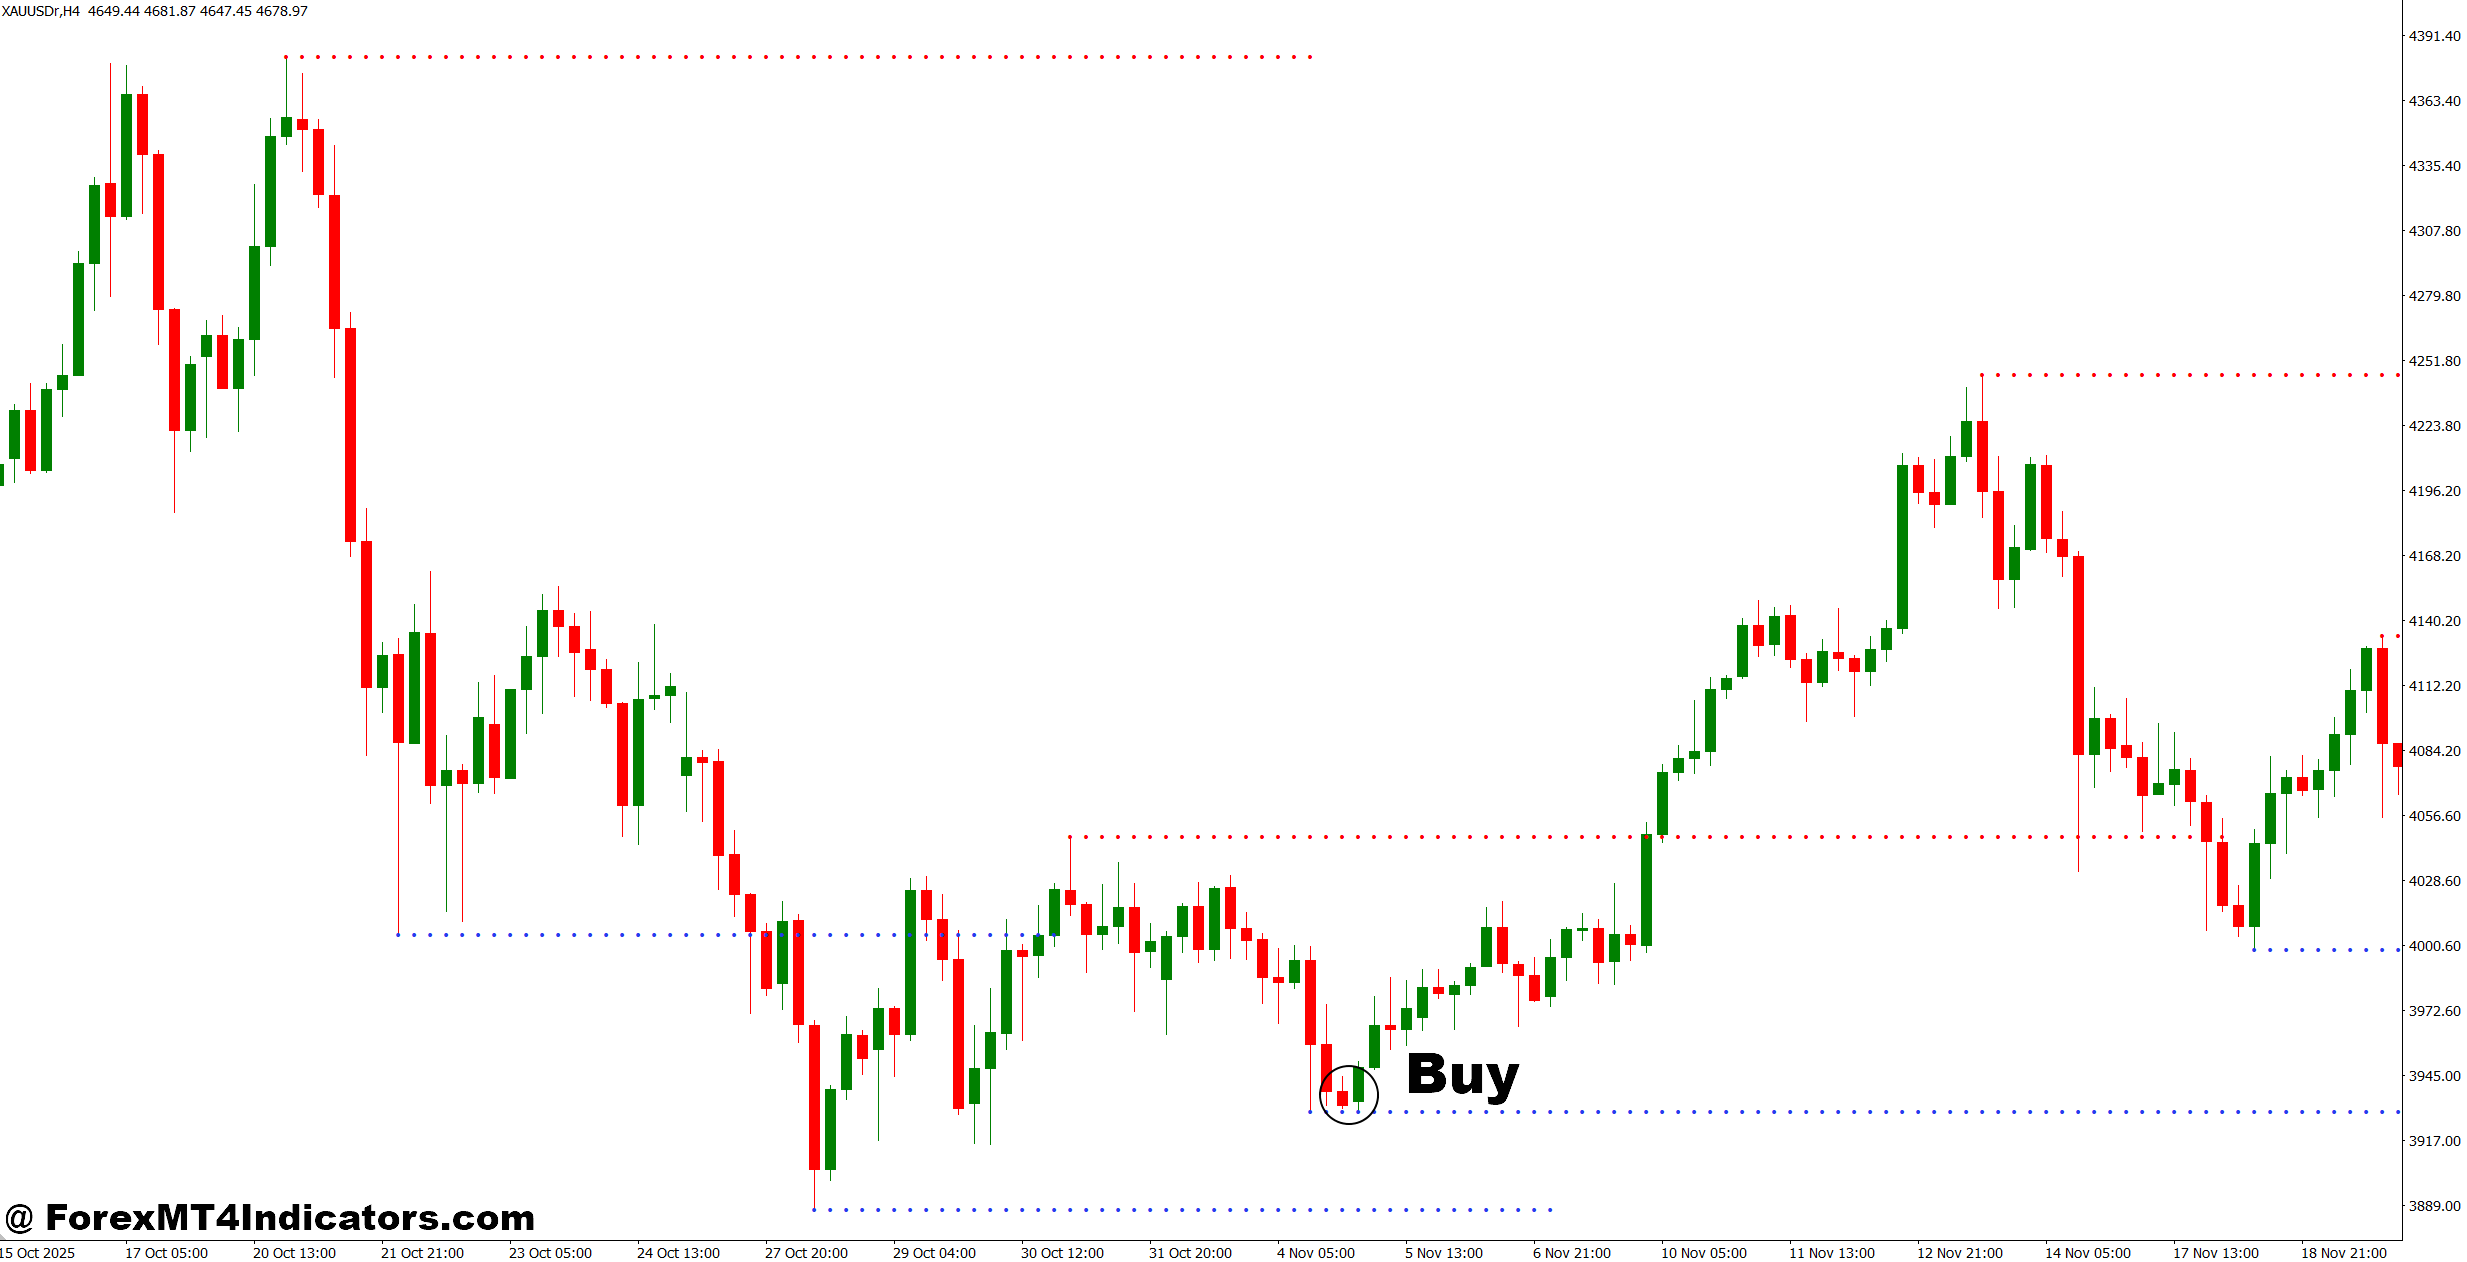
- Buy at Strong Support – Enter when price reaches a marked support zone and rejects it with a bullish candle; allow around 5–10 pips for normal volatility.
- Wait for H1 Confirmation – On the 1-hour EUR/USD chart, wait for a bullish close above the rejection candle before entering.
- Confirm H4 Structure – Prefer BUY setups when the 4-hour trend shows higher highs and higher lows, reducing the chance of trading against momentum.
- Use a 15–30 Pip Stop – Place the stop below the support zone rather than directly on it to avoid small fake-outs.
- Target 1.5:1 or Better – If risking 20 pips, aim for at least 30 pips of potential profit before taking the trade.
- Risk Only 1% – Keep each BUY position near 1% account risk; on a $5,000 account, that means limiting planned loss to about $50.
- Check Daily Support – Give extra weight to EUR/USD support that aligns with a daily level, especially when the H1 chart also shows rejection.
- Avoid Weak Support – Don’t BUY when price breaks support by 15–20 pips with strong bearish momentum and closes below the zone.
Sell Entry
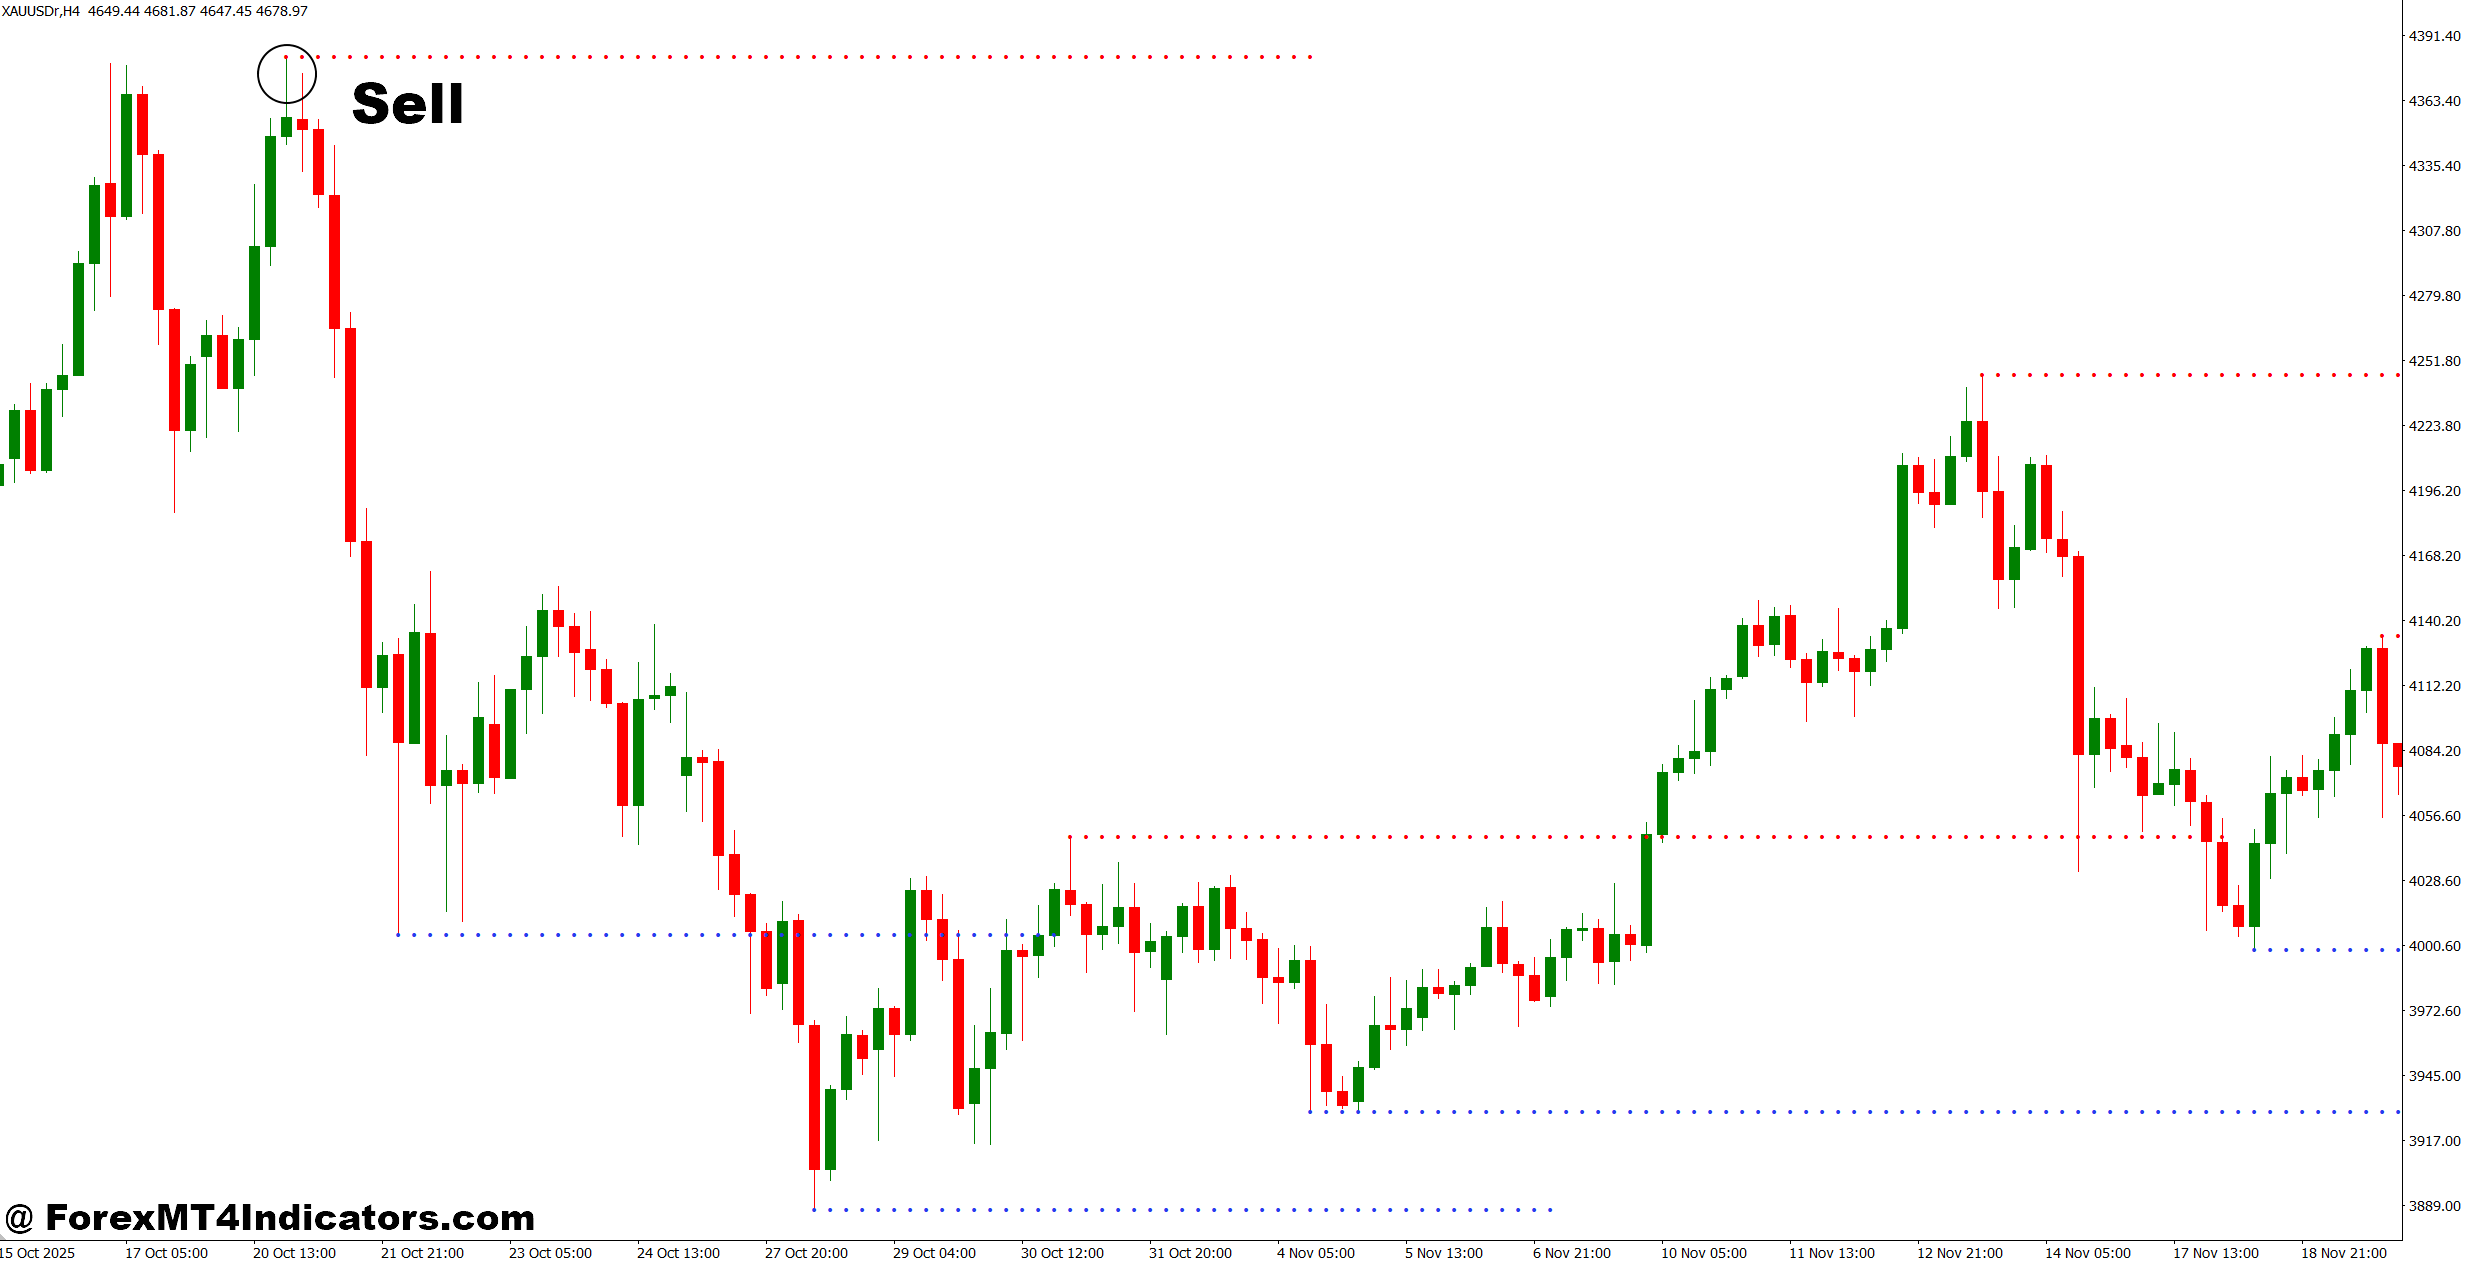
- Sell at Strong Resistance – Enter when price reaches a marked resistance zone and forms clear bearish rejection, preferably across 5–15 pips.
- Wait for H1 Breakdown – On the 1-hour GBP/USD chart, look for a bearish candle closing below the recent swing low before entering.
- Confirm H4 Downtrend – Favor SELL trades when the 4-hour chart shows lower highs and lower lows.
- Use a 15–30 Pip Stop – Place the stop above the resistance zone, allowing enough space for a temporary spike.
- Aim for 1.5:1 Reward – With a 25-pip stop, look for at least 38 pips of realistic downside before entering.
- Keep Risk at 1% – Risk around 1% per trade and reduce position size when the required stop becomes unusually wide.
- Check Daily Resistance – A GBP/USD resistance zone supported by a daily level can provide stronger context for an H1 SELL setup.
- Avoid Selling Strong Breakouts – Don’t SELL when price closes 15–20 pips above resistance with strong bullish momentum; wait for a failed retest instead.
Final Takeaway
The Strong Support and Resistance Indicator MT4 can make chart preparation faster and give traders clearer areas to watch. Its real value comes from combining those zones with market structure and price action rather than taking every marked level as a signal.
Three habits make the tool more useful: start with higher-timeframe zones, wait for price confirmation, and calculate risk before entering. A fourth is simple but often ignored—watch how the level behaves after the first reaction.
Support and resistance work because traders repeatedly respond to price areas, but market conditions can change quickly. The indicator can improve trade location, yet the trader still has to judge trend, volatility, news, and risk. Before using it with real money, testing the settings on EUR/USD, GBP/USD, and other preferred pairs across several market conditions is a sensible next step.
Level up your trading
Learn to read the chart — not just the indicator
eBook · Instant PDF
Video Course · 12 modules
Recommended MT4/MT5 Brokers
- ✓ *FREE *$50 to start (withdrawable)
- ✓ Deposit bonus up to $5,000
- ✓ Negative balance protection
Trading forex and CFDs carries a significant risk of loss and is not suitable for everyone. Broker links are affiliate links — we may earn a commission at no cost to you.
Free MT4 Indicator Download

Enter Your Email Address below, download link will be sent to you.