

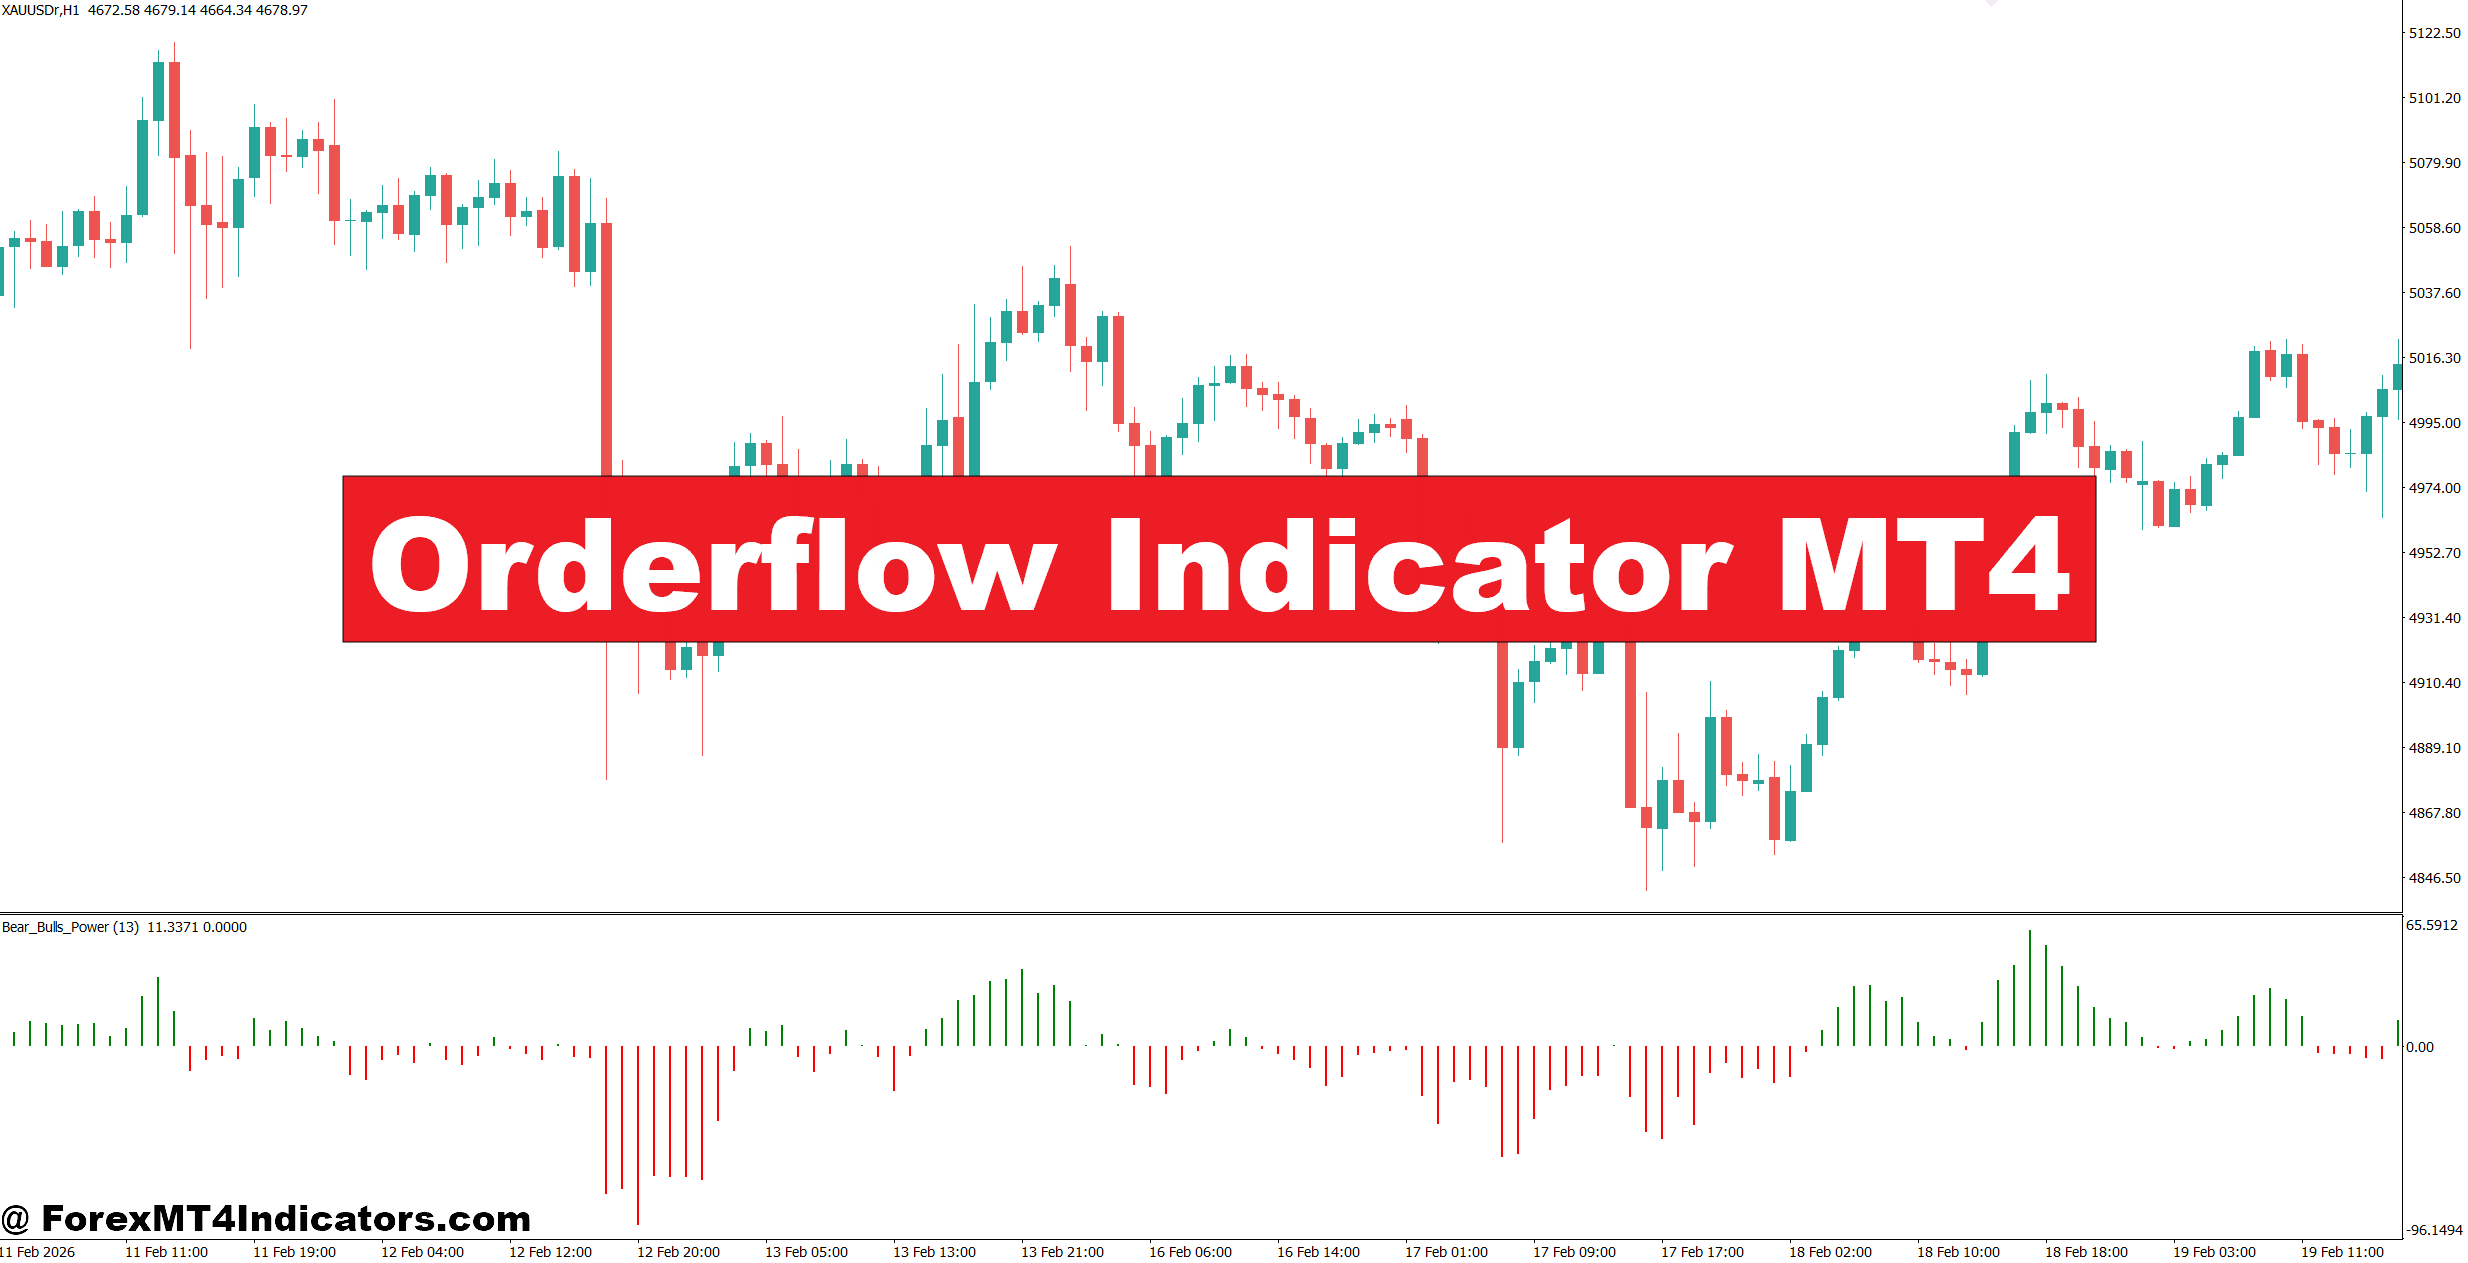
The Orderflow Indicator MT4 aims to reduce that uncertainty by helping traders understand where buying and selling pressure is increasing. Instead of relying only on price direction, it attempts to display the strength behind each move. That extra layer of information can help traders avoid weak breakouts and focus on areas where market participation appears stronger. While no indicator can predict future prices with certainty, order flow analysis can improve decision-making when combined with price action and sound risk management. The sections below explain how the indicator works, where it performs best, and how traders can include it in a practical trading plan.
What Is the Orderflow Indicator MT4?
The Orderflow Indicator MT4 is a technical analysis tool designed to estimate buying and selling pressure using the price movement and tick volume available inside MetaTrader 4. Since the spot forex market does not provide centralized exchange volume, MT4 indicators rely on tick volume, which counts how often price changes during a candle.
Although tick volume is not the same as actual traded contracts, many professional forex traders consider it a useful proxy because studies have shown a strong relationship between tick activity and overall market participation.
Instead of focusing only on trend direction, the indicator highlights where aggressive buyers or sellers appear to control the market. Some versions display colored histograms, directional arrows, or strength bars, while others show cumulative buying and selling pressure.
This makes the indicator useful for:
- Spotting strong trend continuation
- Confirming breakout trades
- Detecting weakening momentum before reversals
- Filtering poor-quality entries during sideways markets
How the Indicator Works
The Orderflow Indicator MT4 analyzes several market components at the same time rather than depending on one calculation.
Typical inputs include:
- Tick volume
- Candle body size
- High-low price range
- Bullish versus bearish candle dominance
- Momentum over a selected lookback period
The indicator combines these values into a visual representation of market pressure. When buying pressure exceeds selling pressure, bullish signals become stronger. When selling pressure dominates, bearish readings appear instead.
For example, imagine EUR/USD on the 1-hour chart.
Price breaks above 1.1250 after trading in a narrow range for several hours. At the same time, tick volume rises nearly 35% above the previous ten-bar average, and the Orderflow Indicator shows increasing buying strength. Rather than entering immediately at the breakout candle, experienced traders often wait for a small pullback toward the breakout level. If buying pressure remains strong during that retracement, the trade usually offers a better reward-to-risk ratio.
Here’s the thing. A breakout with weak participation often turns into a fake-out. Order flow can help traders recognize the difference before committing capital.
Using the Orderflow Indicator in Real Trading
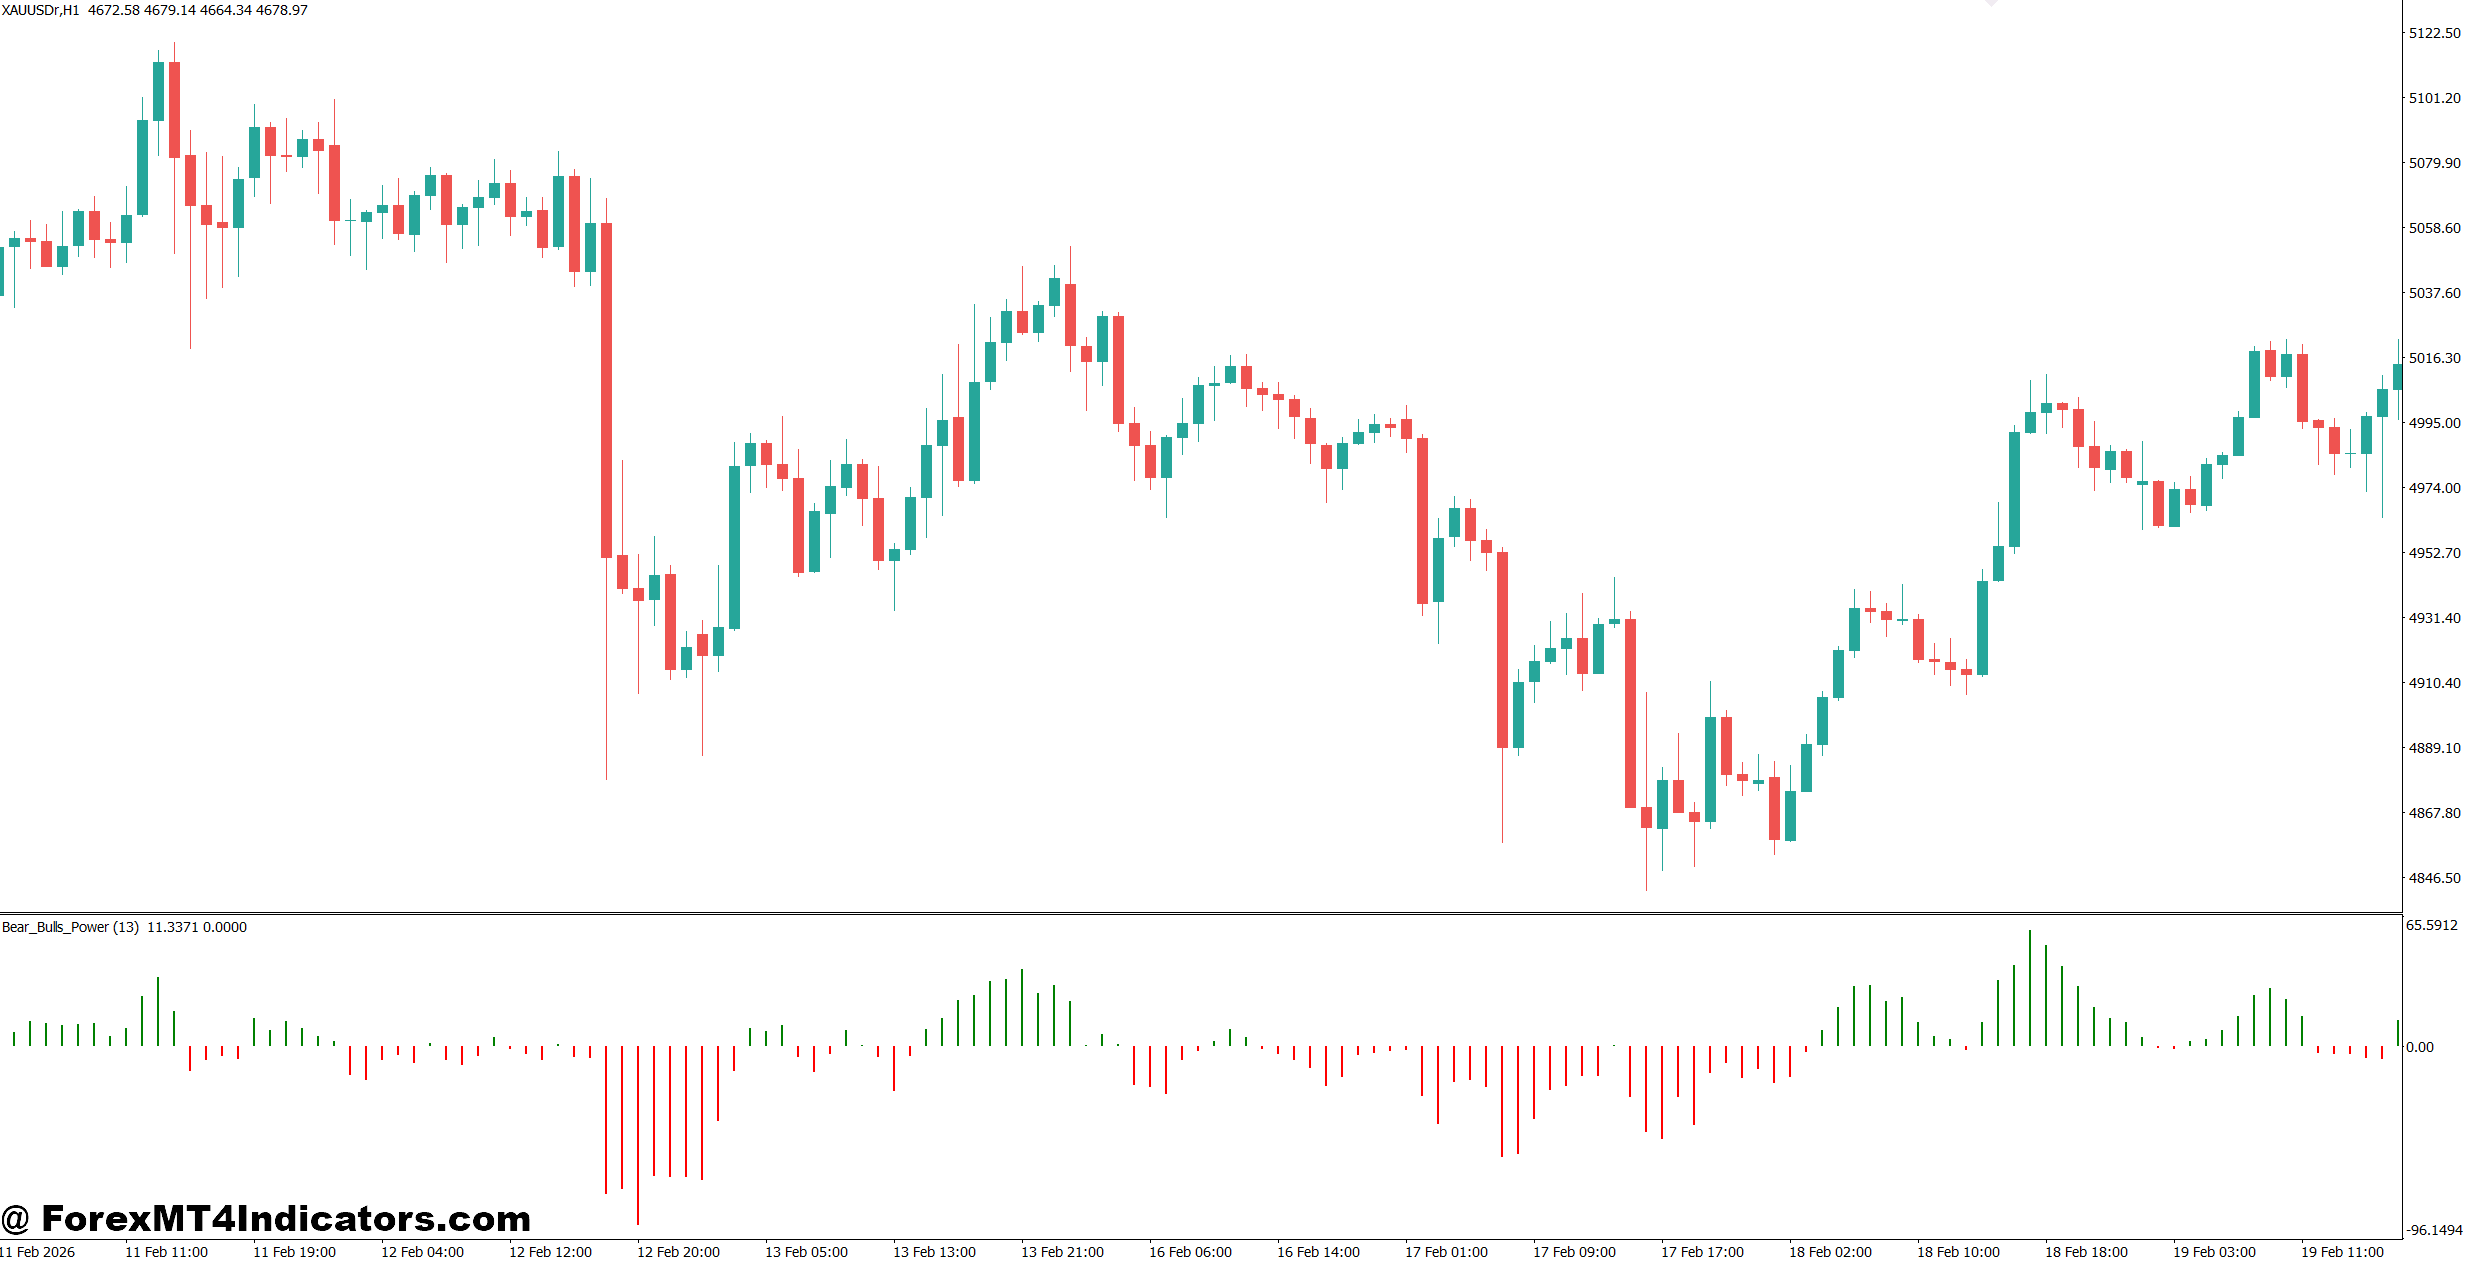
Successful traders rarely depend on one indicator by itself. The Orderflow Indicator works best when combined with market structure, trend analysis, and support and resistance.
A common bullish setup looks like this:
Price forms a higher low on GBP/USD after an established uptrend. The Orderflow Indicator shifts from neutral to bullish while the pair bounces from a daily support zone. A trader enters after the candle closes above the previous swing high with a 25-pip stop-loss and targets the next resistance level 60 pips higher. This produces a reward-to-risk ratio of about 2.4:1.
A bearish example follows similar logic.
USD/JPY rejects resistance near 151.20 on the 4-hour chart. Selling pressure increases on the indicator while price closes below a short-term support level. The trader waits for a minor pullback before entering the short position. This confirmation reduces the chance of selling directly into temporary buying pressure.
When testing this on volatile NFP days, many traders notice that order flow signals become much stronger after the initial news spike settles. Entering during the first few minutes often leads to unnecessary whipsaws. Waiting 15 to 30 minutes usually produces cleaner confirmation.
Trading forex carries substantial risk. No indicator guarantees profits. Every trade should include a predefined stop-loss and position size based on acceptable account risk.
Best Settings and Customization
Different trading styles require different indicator settings. There isn’t a single configuration that fits every market.
Scalping
- Timeframe: M5 or M15
- Sensitivity: High
- Tick volume period: 10–20
- Best pairs: EUR/USD, GBP/USD, USD/JPY
Scalpers want faster signals but should expect more market noise.
Intraday Trading
- Timeframe: H1
- Tick volume period: 20–30
- Medium sensitivity
- Combine with a 50 EMA for trend confirmation
This balance often filters many weak signals while still reacting quickly to changing market conditions.
Swing Trading
- Timeframe: H4 or Daily
- Longer smoothing period
- Lower sensitivity
- Confirm with major support and resistance levels
Longer settings reduce false signals during normal price fluctuations but react more slowly to sudden reversals.
Many traders also pair the indicator with ATR for stop-loss placement. For example, using 1.5 times the 14-period ATR often adapts better to changing volatility than using a fixed 20-pip stop.
Orderflow Indicator MT4 vs Traditional Indicators
Many technical indicators analyze historical prices. The Orderflow Indicator attempts to measure the strength behind those price movements.
Moving averages smooth trends but often lag during reversals.
RSI measures momentum and overbought or oversold conditions but can stay overbought during strong trends.
MACD identifies momentum shifts but usually reacts after the move has already started.
The Orderflow Indicator adds another perspective by estimating market participation during price movement. That makes it particularly useful for confirming breakout trades and filtering weak trend signals.
Still, it has limitations.
Because MT4 relies on tick volume instead of centralized exchange volume, readings may differ slightly between brokers. Traders should also remember that strong buying pressure does not guarantee higher prices. Unexpected economic releases, central bank announcements, or liquidity events can quickly change market direction.
The indicator performs best as a confirmation tool rather than a standalone trading system.
How to Trade with Orderflow Indicator MT4
Buy Entry
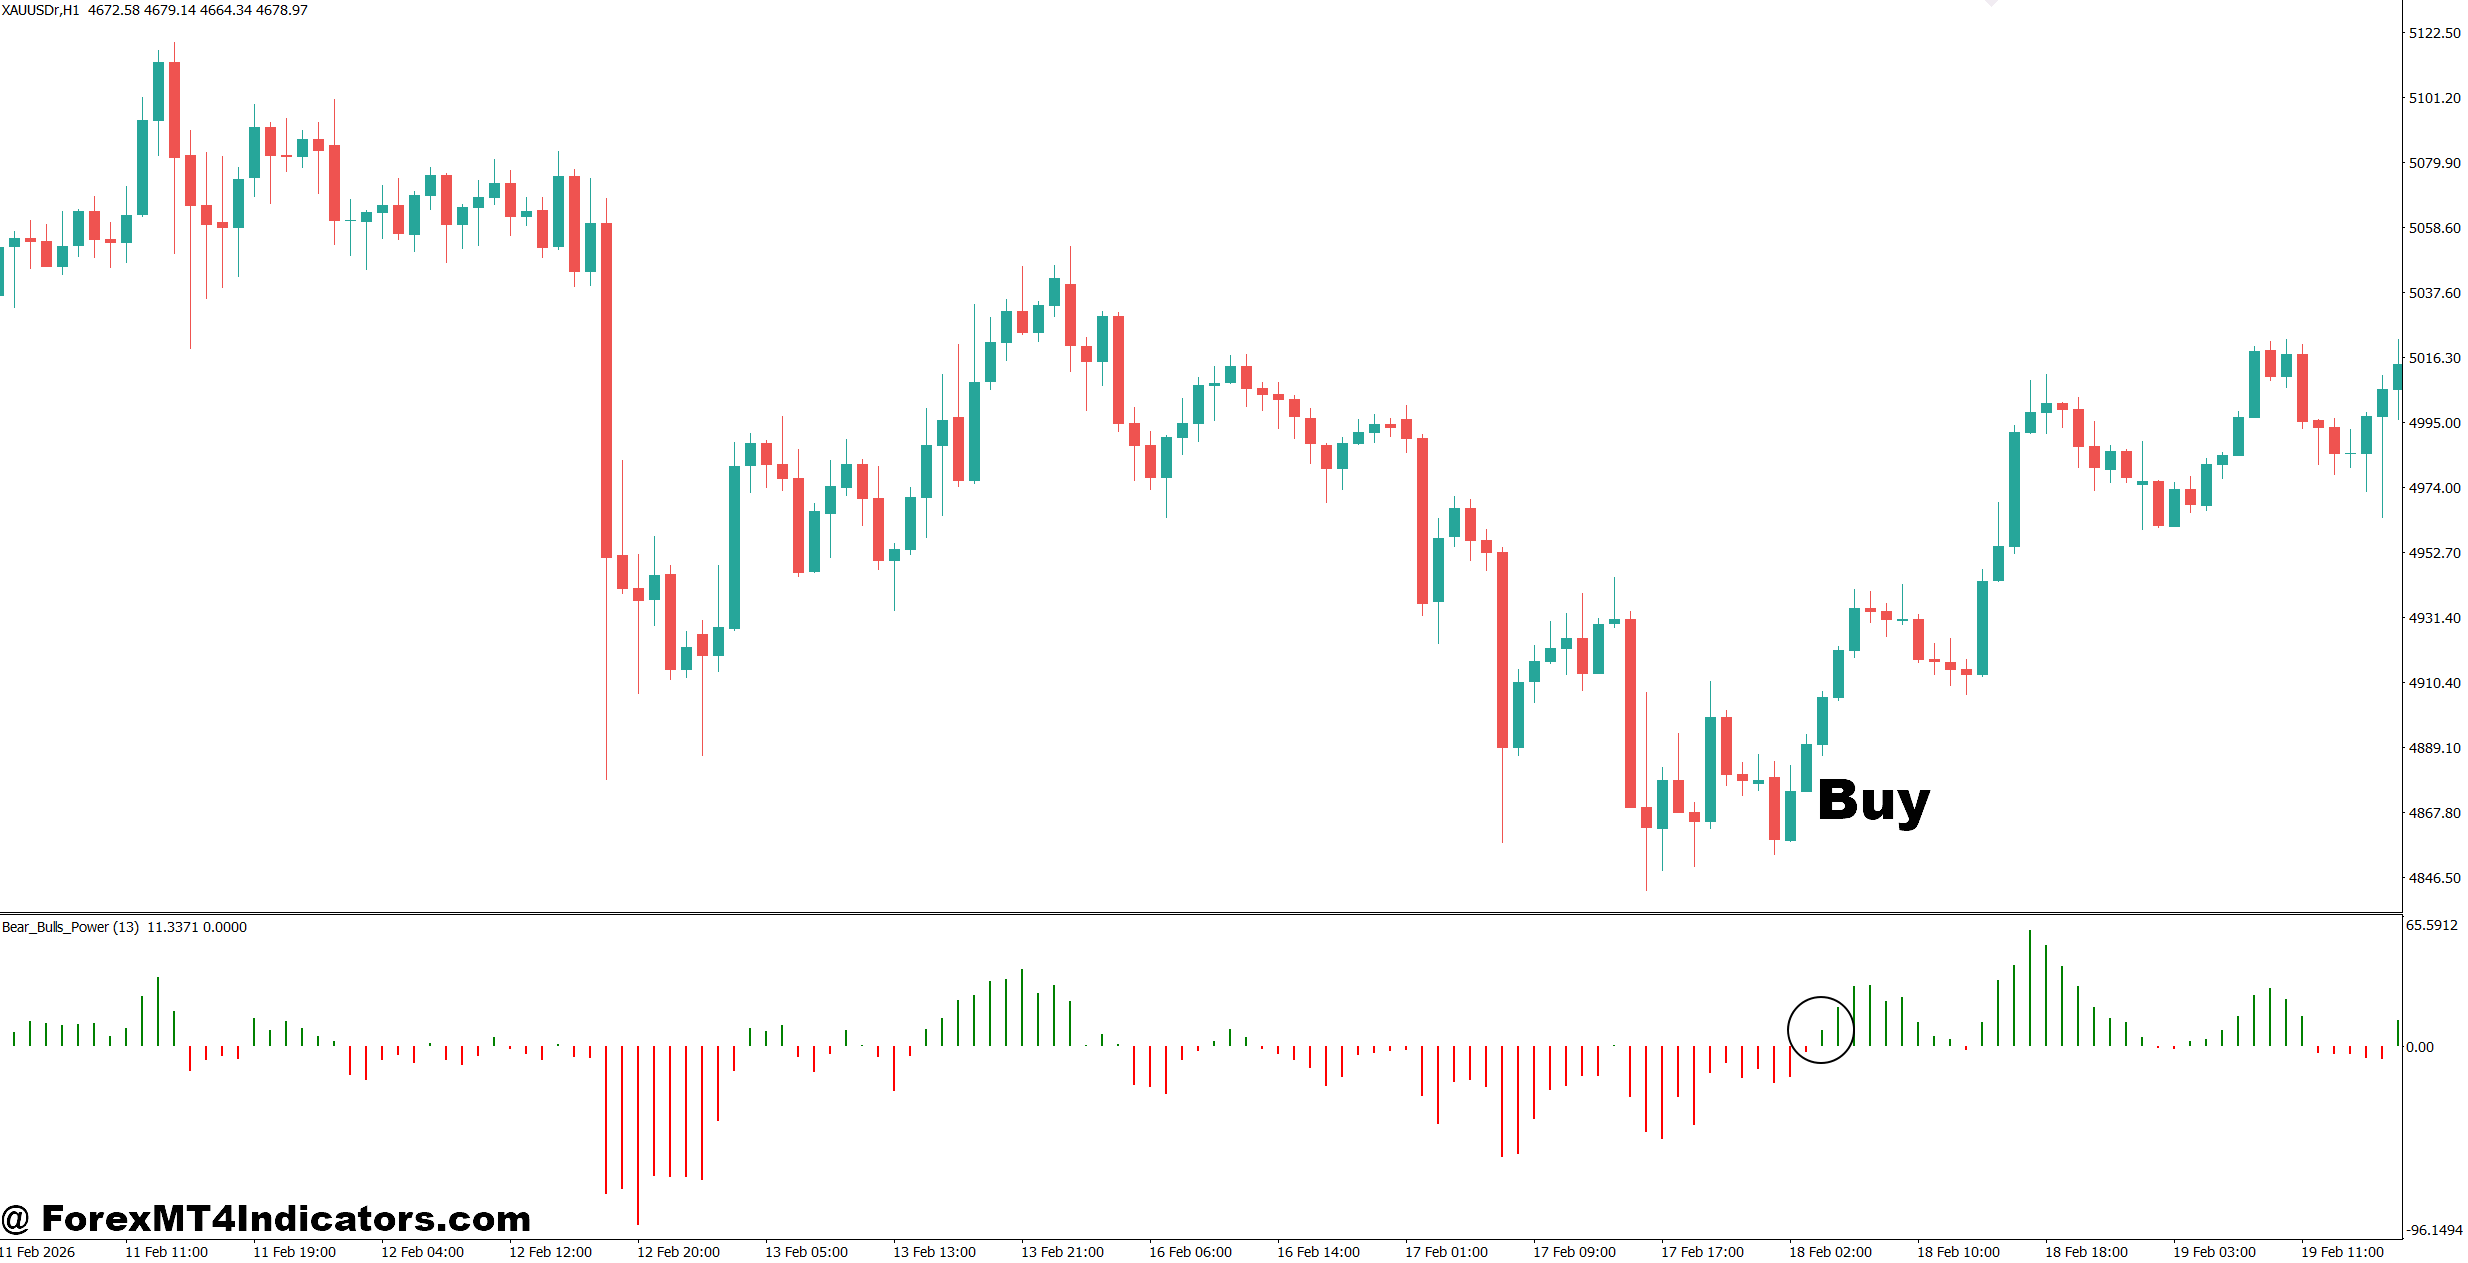
- Buy after bullish order flow confirmation – Enter when buying pressure increases on the EUR/USD 1-hour chart with a 20-30 pip stop-loss.
- Trade breakout with volume – Buy after price closes above resistance with 25% higher tick volume than recent candles.
- Wait for pullback entry – Enter after a retracement to the breakout zone and target at least 40-60 pips.
- Confirm higher highs – Buy only when price forms a higher high and higher low on the 4-hour timeframe.
- Use support as confirmation – Take buy trades near strong daily support with a minimum 1:2 risk-reward ratio.
- Protect your capital – Risk only 1-2% of your account on each trade and trail the stop after 30 pips profit.
- Trade active sessions – Focus on the London and New York sessions for stronger order flow signals.
- Avoid low-volume markets – Skip buy signals during tight ranges below 15 pips or before major news releases.
Sell Entry
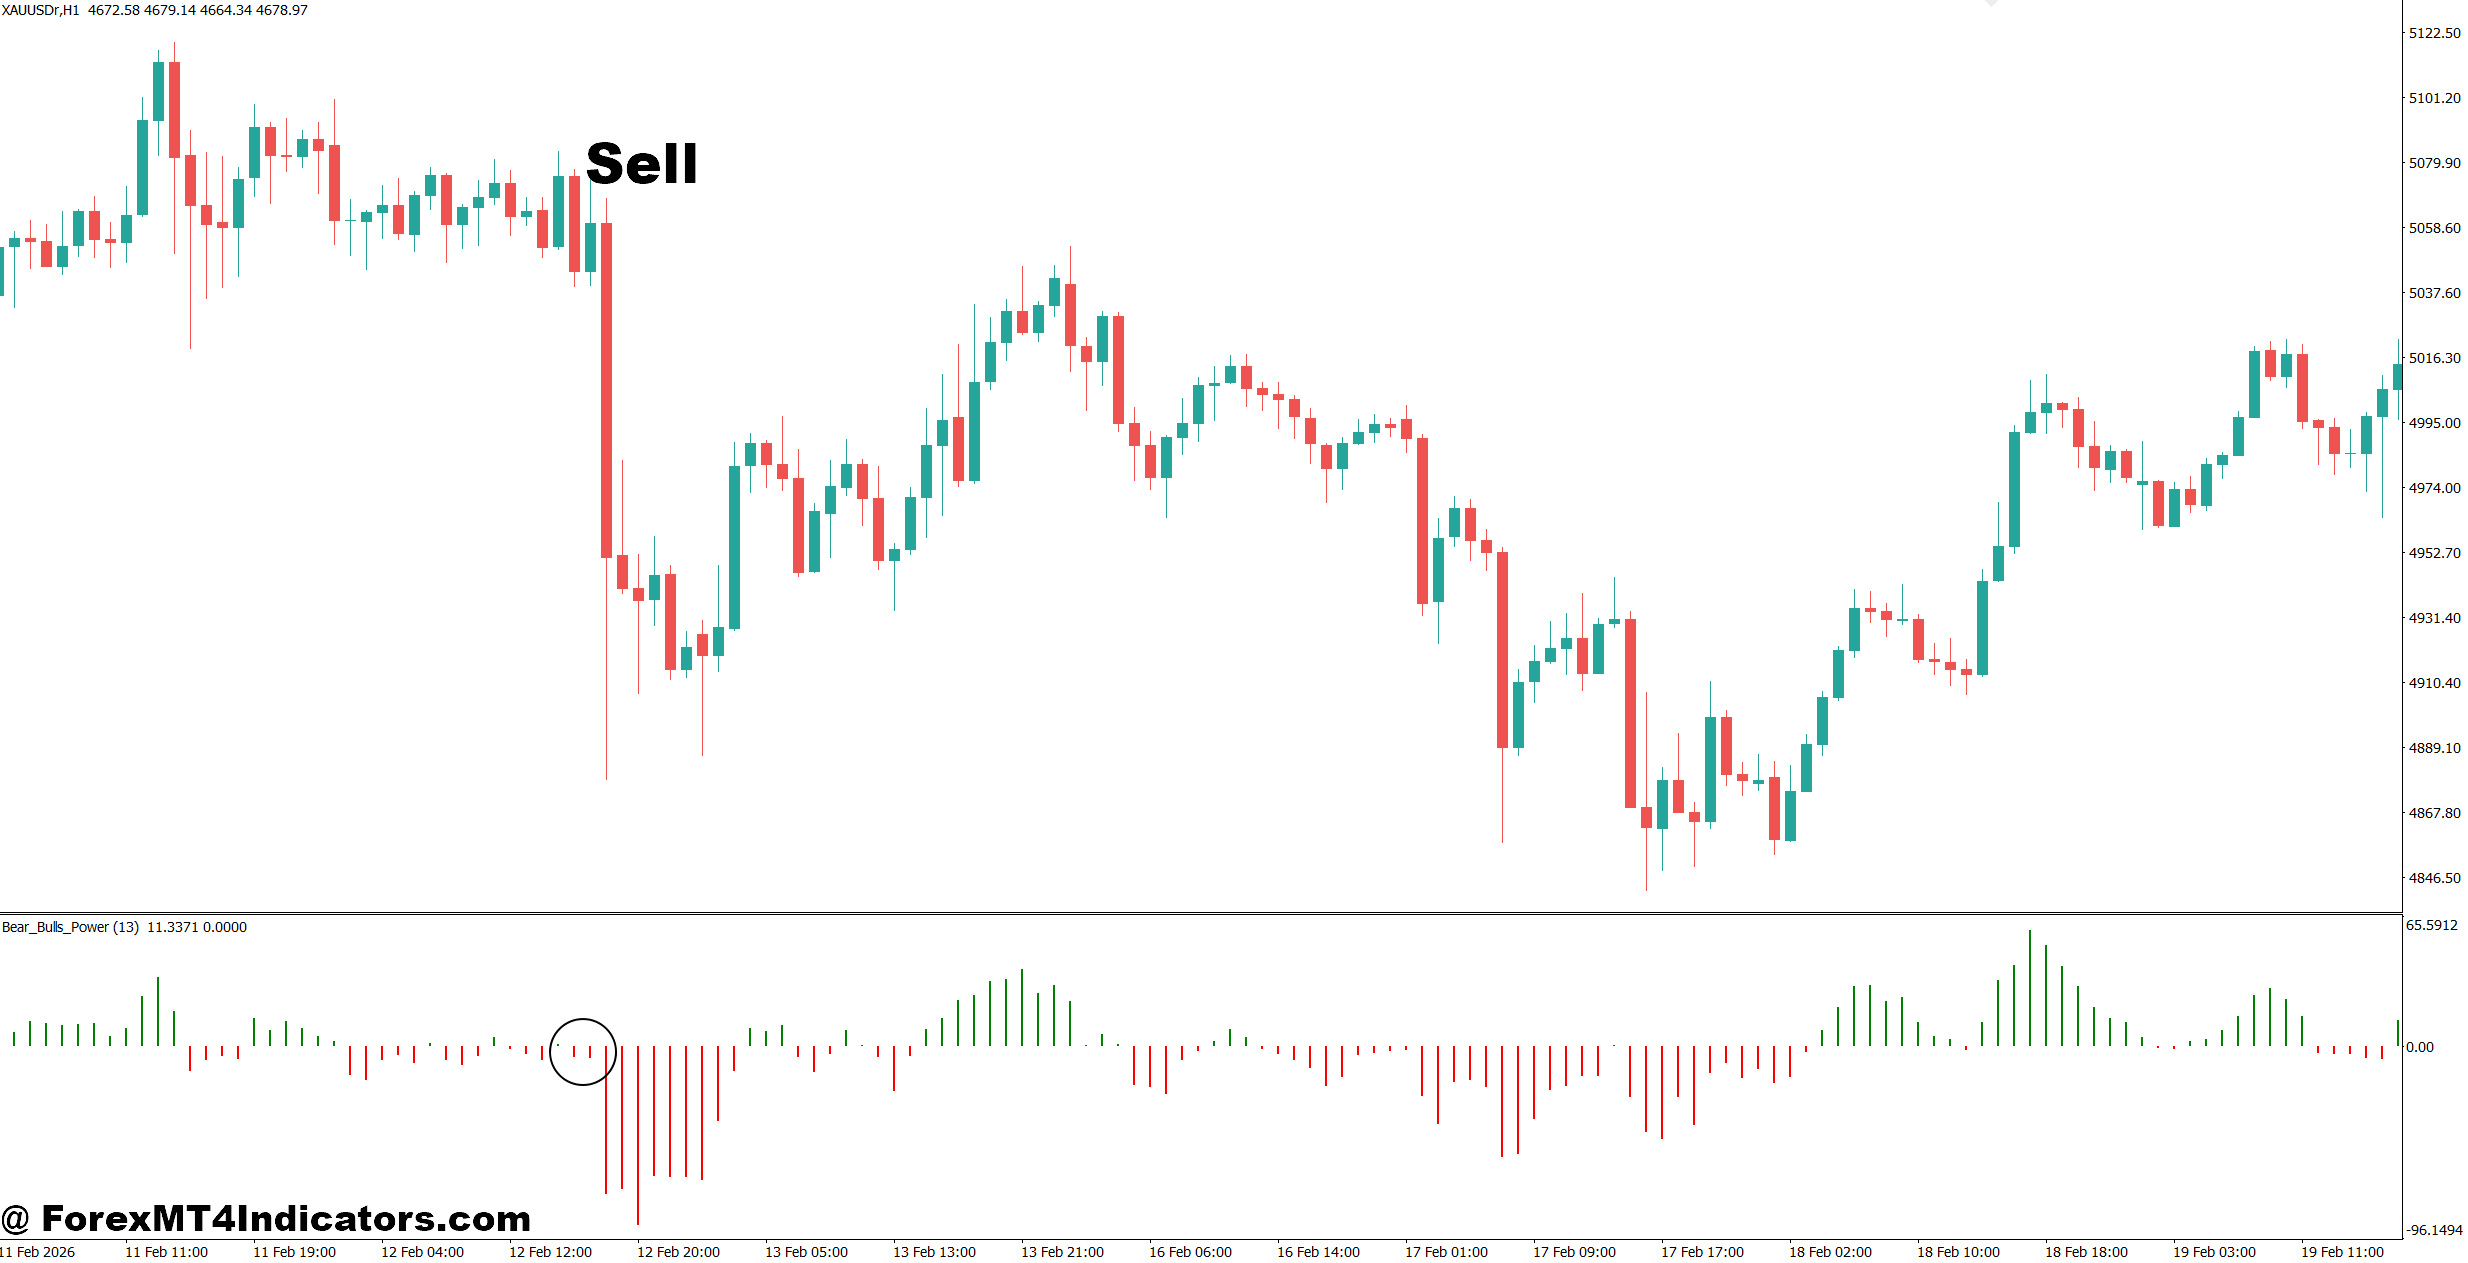
- Sell after bearish order flow confirmation – Enter when selling pressure dominates on the GBP/USD 1-hour chart with a 20-30 pip stop-loss.
- Trade breakdowns only – Sell after price closes below support with increasing bearish volume and momentum.
- Wait for resistance retest – Enter after price retests broken support as resistance and aim for 40-70 pips.
- Confirm lower lows – Sell only when the 4-hour chart forms lower highs and lower lows.
- Use resistance zones – Open sell positions near daily resistance with at least a 1:2 risk-reward ratio.
- Manage downside risk – Risk no more than 2% per trade and move the stop to breakeven after 25-30 pips profit.
- Trade trending pairs – Look for clean sell setups on EUR/USD or GBP/USD during strong bearish trends.
- Avoid false signals – Don’t sell during sideways markets, low volatility, or within 30 minutes before high-impact economic news.
Final Thoughts
The Orderflow Indicator MT4 offers traders another way to evaluate market strength instead of relying only on price direction. Its greatest value comes from confirming trend continuation, identifying stronger breakout opportunities, and helping traders avoid weak entries during choppy conditions. The tool works best when combined with price action, support and resistance, and disciplined risk management rather than replacing them. Like any technical indicator, it has strengths and limitations, especially because forex order flow is based on tick volume instead of centralized exchange data. Traders who test the Orderflow Indicator MT4 on a demo account, keep detailed trading records, and adjust its settings to match their preferred timeframe will usually gain far more insight than those searching for a single indicator to make every trading decision.
Level up your trading
Learn to read the chart — not just the indicator
eBook · Instant PDF
Video Course · 12 modules
Recommended MT4/MT5 Brokers
- ✓ *FREE *$50 to start (withdrawable)
- ✓ Deposit bonus up to $5,000
- ✓ Negative balance protection
Trading forex and CFDs carries a significant risk of loss and is not suitable for everyone. Broker links are affiliate links — we may earn a commission at no cost to you.
Free MT4 Indicator Download

Enter Your Email Address below, download link will be sent to you.