

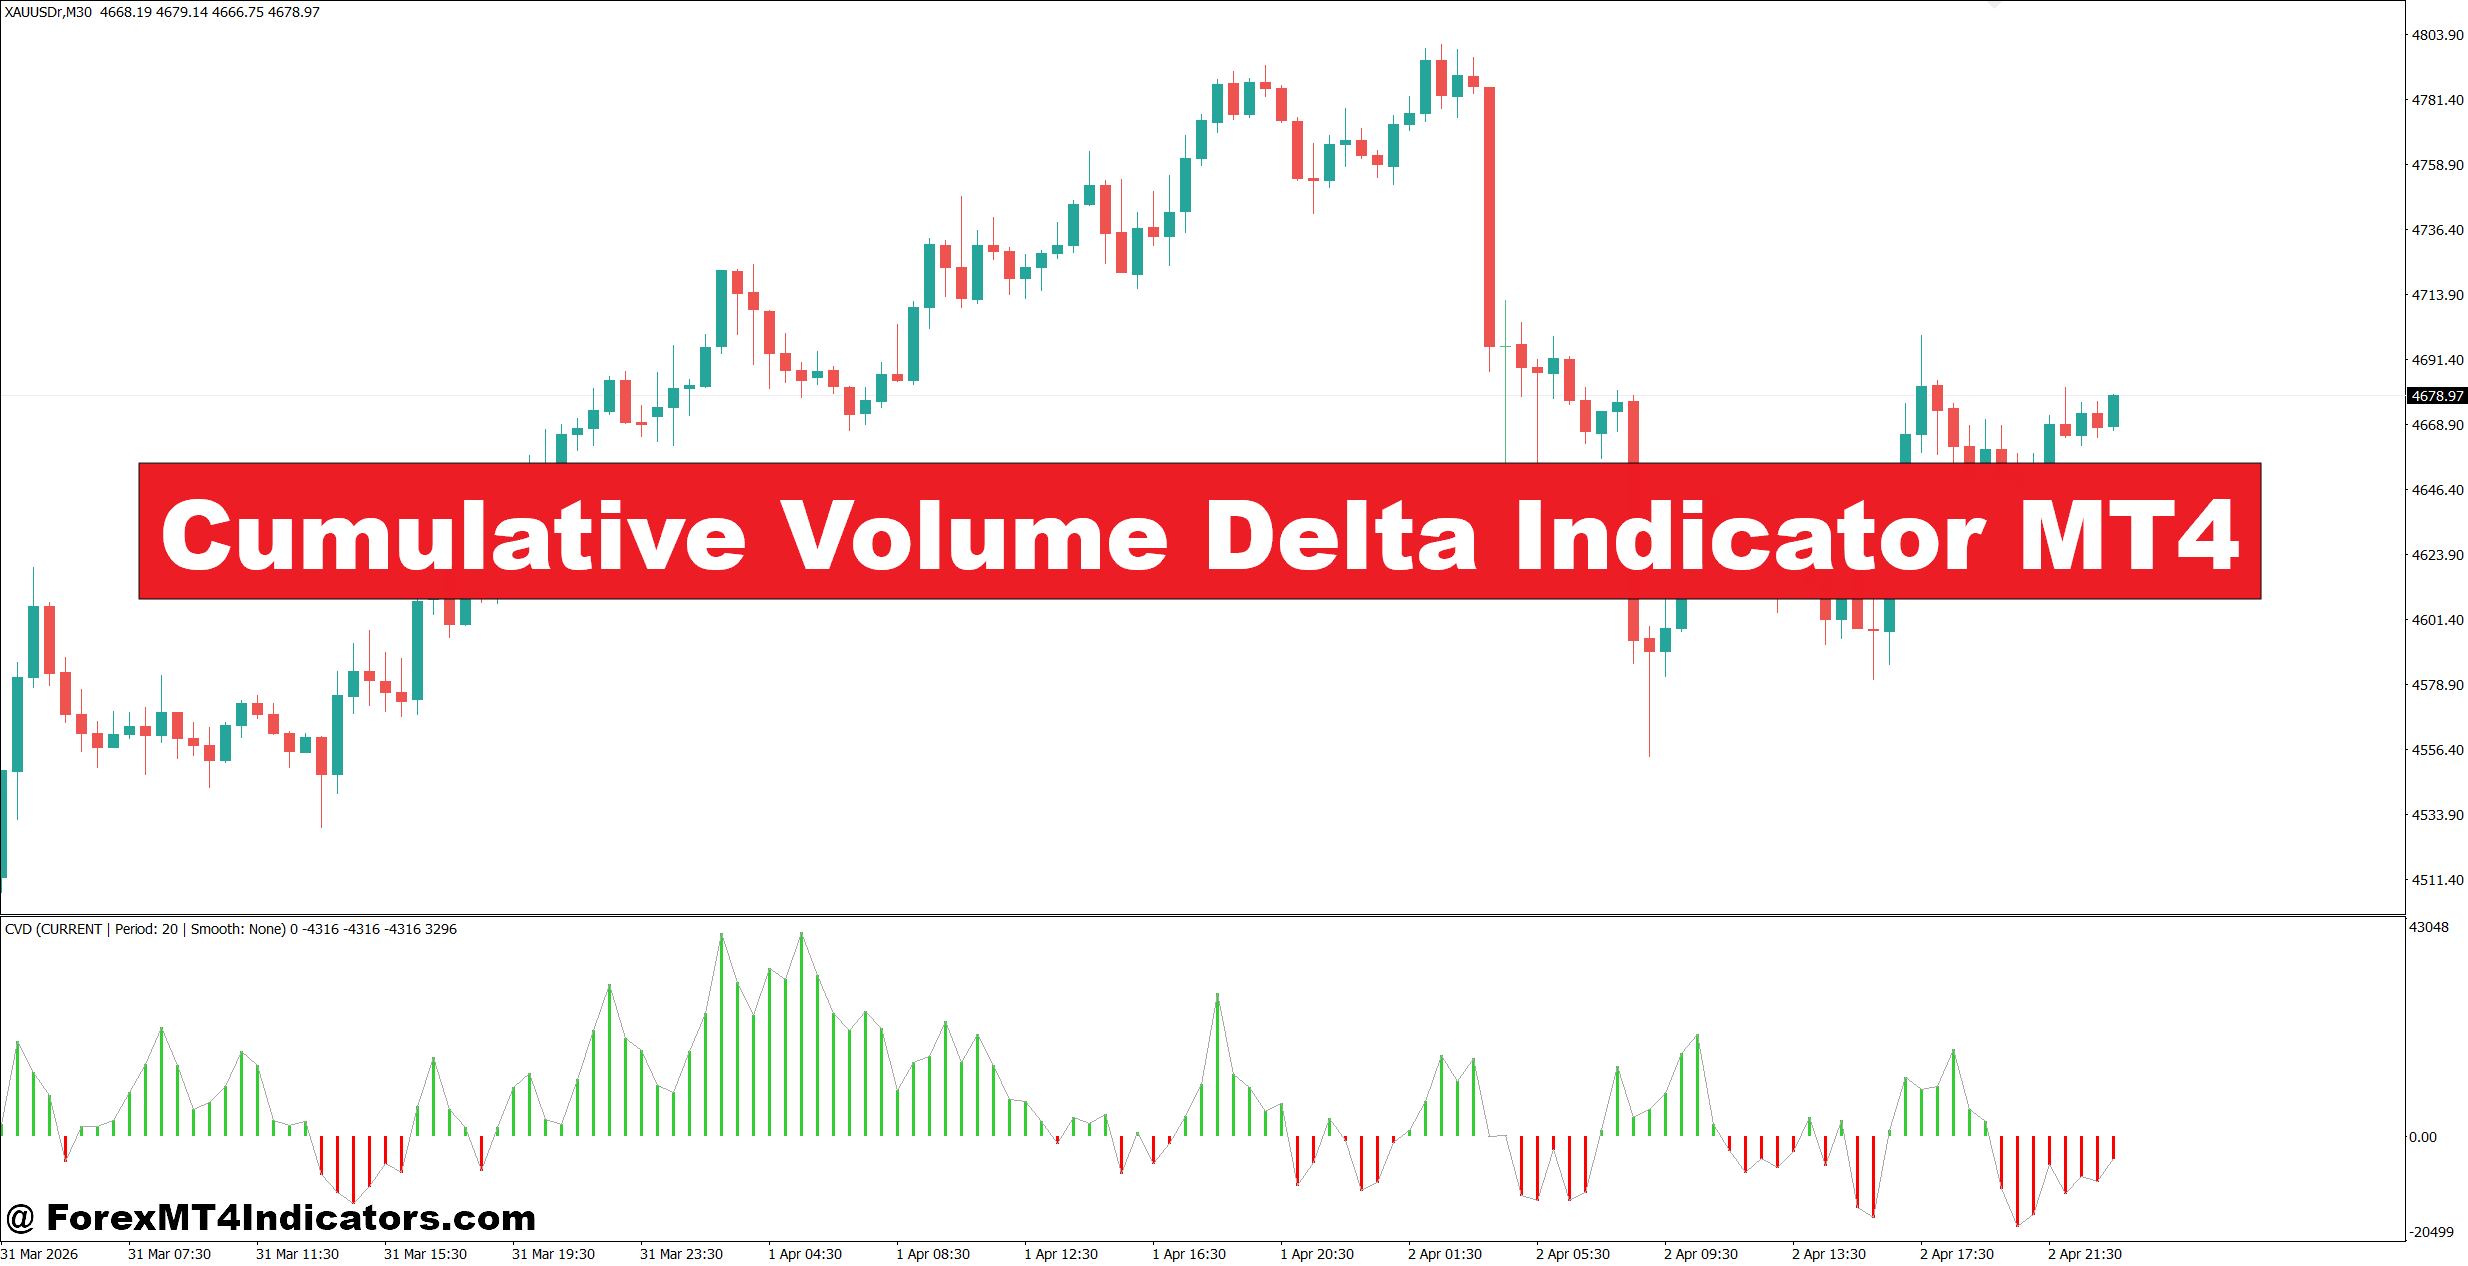
The Cumulative Volume Delta Indicator MT4 helps traders look beyond price movement by showing whether buying or selling pressure is actually increasing behind the scenes. While the forex market does not provide centralized exchange volume, MT4 uses tick volume as a close estimate of market activity. When interpreted correctly, this indicator gives traders another layer of confirmation before entering a trade.
Instead of relying only on candlestick patterns or moving averages, traders can compare price direction with volume pressure. That extra confirmation often filters weak setups and highlights stronger opportunities. Let’s look at how this indicator works, where it performs well, and what traders should know before adding it to a trading plan.
Understanding the Cumulative Volume Delta Indicator MT4
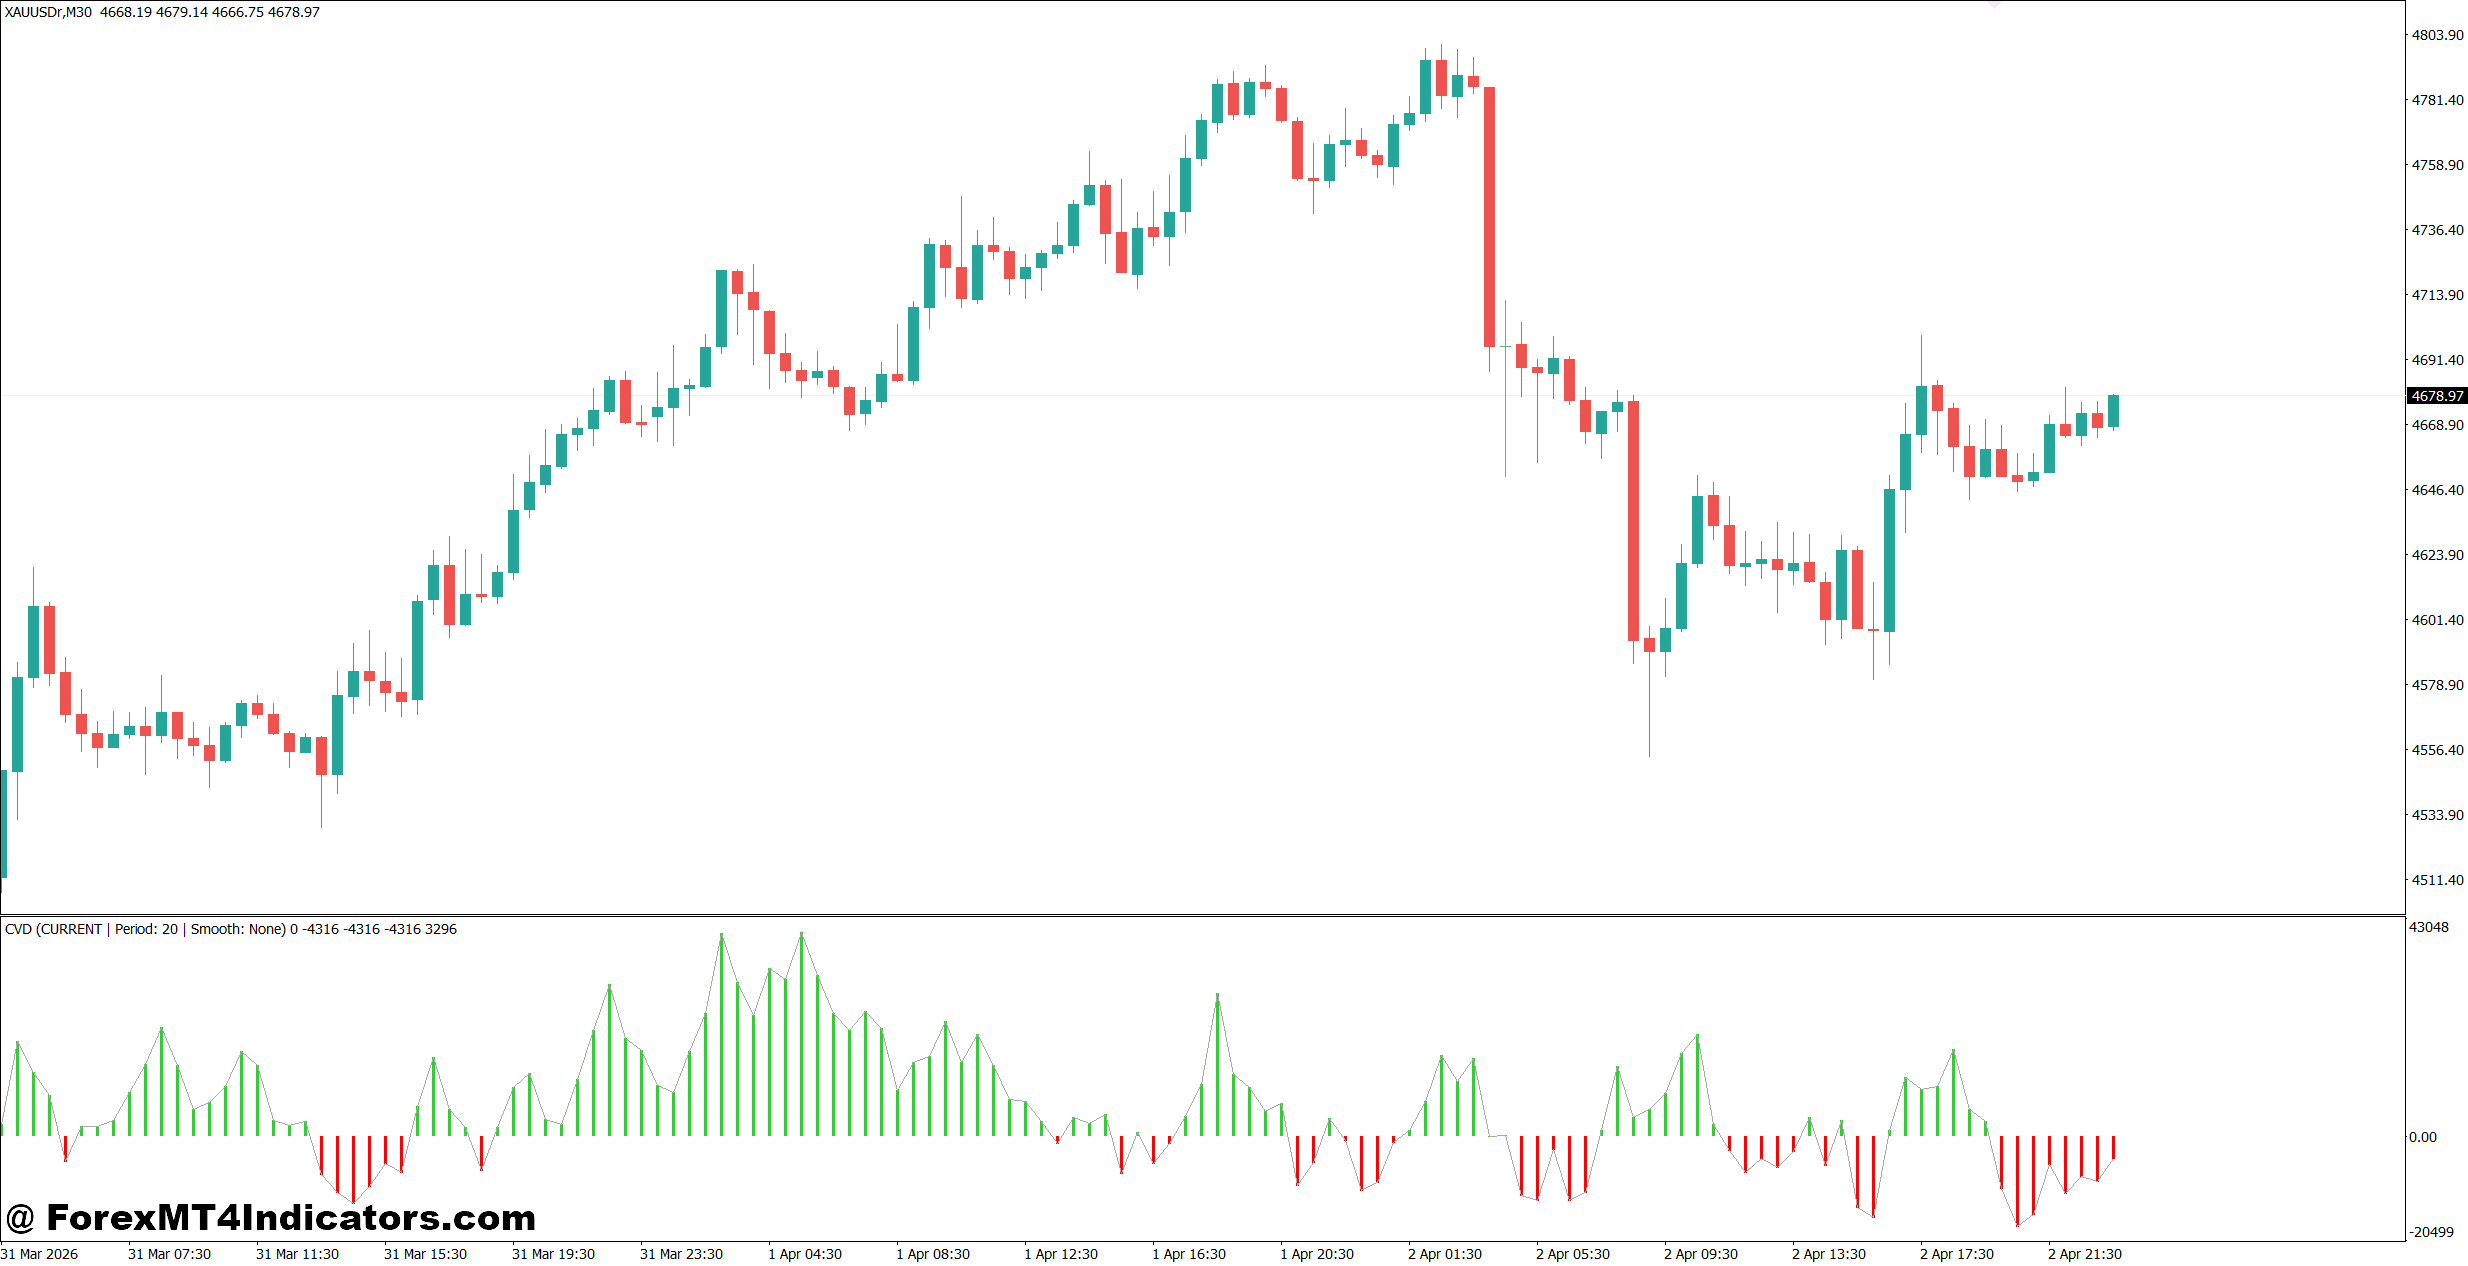
The Cumulative Volume Delta (CVD) Indicator measures the difference between buying pressure and selling pressure over time. Rather than displaying raw volume bars, it adds or subtracts volume based on whether buyers or sellers appear to control each price movement.
In MT4, the indicator relies on tick volume because decentralized forex trading does not have official exchange volume data. Although tick volume is not identical to actual traded contracts, years of market testing have shown a strong relationship between tick activity and market participation.
A rising CVD line suggests buyers are becoming more aggressive. A falling line points to stronger selling activity. When price and the CVD move together, the trend often has better support. If they begin moving in opposite directions, traders may be looking at an early warning that momentum is fading.
For example, EUR/USD on the 1-hour chart may continue making higher highs while the CVD creates lower highs. That divergence can suggest buyers are losing strength even before price begins to reverse.
How the Indicator Calculates Buying and Selling Pressure
The indicator works by comparing each price movement with incoming tick volume.
When price closes higher, the indicator treats that movement as buying activity and adds the related volume. When price closes lower, it subtracts the estimated selling volume from the running total. This continuous calculation creates the cumulative volume delta line.
Here’s the practical value. Price can rise simply because there are fewer sellers, but a strong CVD rise usually shows buyers are actively participating. That difference often matters during trend continuation trades.
During testing on GBP/USD around major London session breakouts, many traders notice that price moves supported by increasing CVD often continue for another 30 to 70 pips. Breakouts where price rises but CVD remains flat frequently lose momentum within the next several candles.
No calculation is perfect because forex volume is based on broker tick data. Different brokers may display slightly different readings. Even so, the overall trend in the CVD usually remains similar across quality brokers.
Using the Cumulative Volume Delta Indicator in Live Trading
Trend Confirmation
One of the simplest ways to use the indicator is confirming trend direction.
Suppose USD/JPY is trading above the 50-period Exponential Moving Average on the 4-hour chart. Price pulls back toward a support zone before printing a bullish engulfing candle. If the CVD also begins rising from recent lows, buyers appear to be stepping back into the market. Many traders consider this stronger confirmation than price action alone.
Spotting Divergence
Divergence is another popular application.
Imagine AUD/USD reaches a fresh daily high, but the CVD forms a lower high instead. That difference suggests buying pressure is weakening. It doesn’t guarantee an immediate reversal, but it often encourages traders to tighten stop-loss levels or wait for additional confirmation before opening new long positions.
Filtering Fake Breakouts
False breakouts happen frequently during quiet market sessions.
A breakout above resistance with weak or falling cumulative volume often struggles to continue. On the other hand, when both price and CVD expand together, the move generally shows healthier participation.
When testing this on volatile Non-Farm Payroll (NFP) days, traders often notice sharp price spikes that reverse within minutes. Waiting for volume delta confirmation instead of chasing the first candle can reduce emotional decisions during high-impact news.
Trading forex carries substantial risk. No indicator guarantees profits. Strong risk management remains more important than any single technical tool.
Best Settings and Practical Adjustments
There is no universal setting because trading styles vary.
Scalpers working on the 5-minute or 15-minute charts often prefer shorter smoothing periods between 10 and 20 to react quickly to market changes. Swing traders on the 4-hour or daily charts may increase smoothing to 30 or even 50 periods to reduce market noise.
Popular combinations include:
- 15-minute chart with a 14-period smoothing for EUR/USD during the London session.
- 1-hour chart with a 20-period smoothing for GBP/USD trend trading.
- 4-hour chart with a 30-period smoothing for longer-term USD/CAD positions.
Many traders combine the CVD with support and resistance zones instead of stacking multiple oscillators. When volume pressure confirms a reaction from an important price level, trade quality often improves.
But no setting removes losing trades. Market conditions constantly change, so traders should test adjustments using historical data before risking live capital.
Advantages, Drawbacks, and Comparison with Similar Indicators
The biggest strength of the Cumulative Volume Delta Indicator MT4 is its ability to reveal participation behind price movement. Standard price charts only show where price moved. CVD attempts to explain how much buying or selling interest supported that move.
Compared with the On Balance Volume (OBV) indicator, CVD often reacts faster because it focuses on buying versus selling pressure instead of simply adding or subtracting total volume based on closing prices.
Compared with the Volume Indicator, CVD provides more context. A large volume bar alone doesn’t reveal which side controlled the market. The cumulative delta attempts to separate buyer activity from seller activity.
There are limitations as well.
Since MT4 relies on tick volume, the indicator cannot display true centralized forex transaction volume. Signals may also become unreliable during low-liquidity sessions or holiday trading, where random price movements create misleading readings.
The indicator should never replace price action analysis. Support and resistance, trend structure, and risk management still deserve the highest priority.
Successful traders usually treat CVD as a confirmation tool rather than the main reason to enter a trade.
How to Trade with Cumulative Volume Delta Indicator MT4
Buy Entry
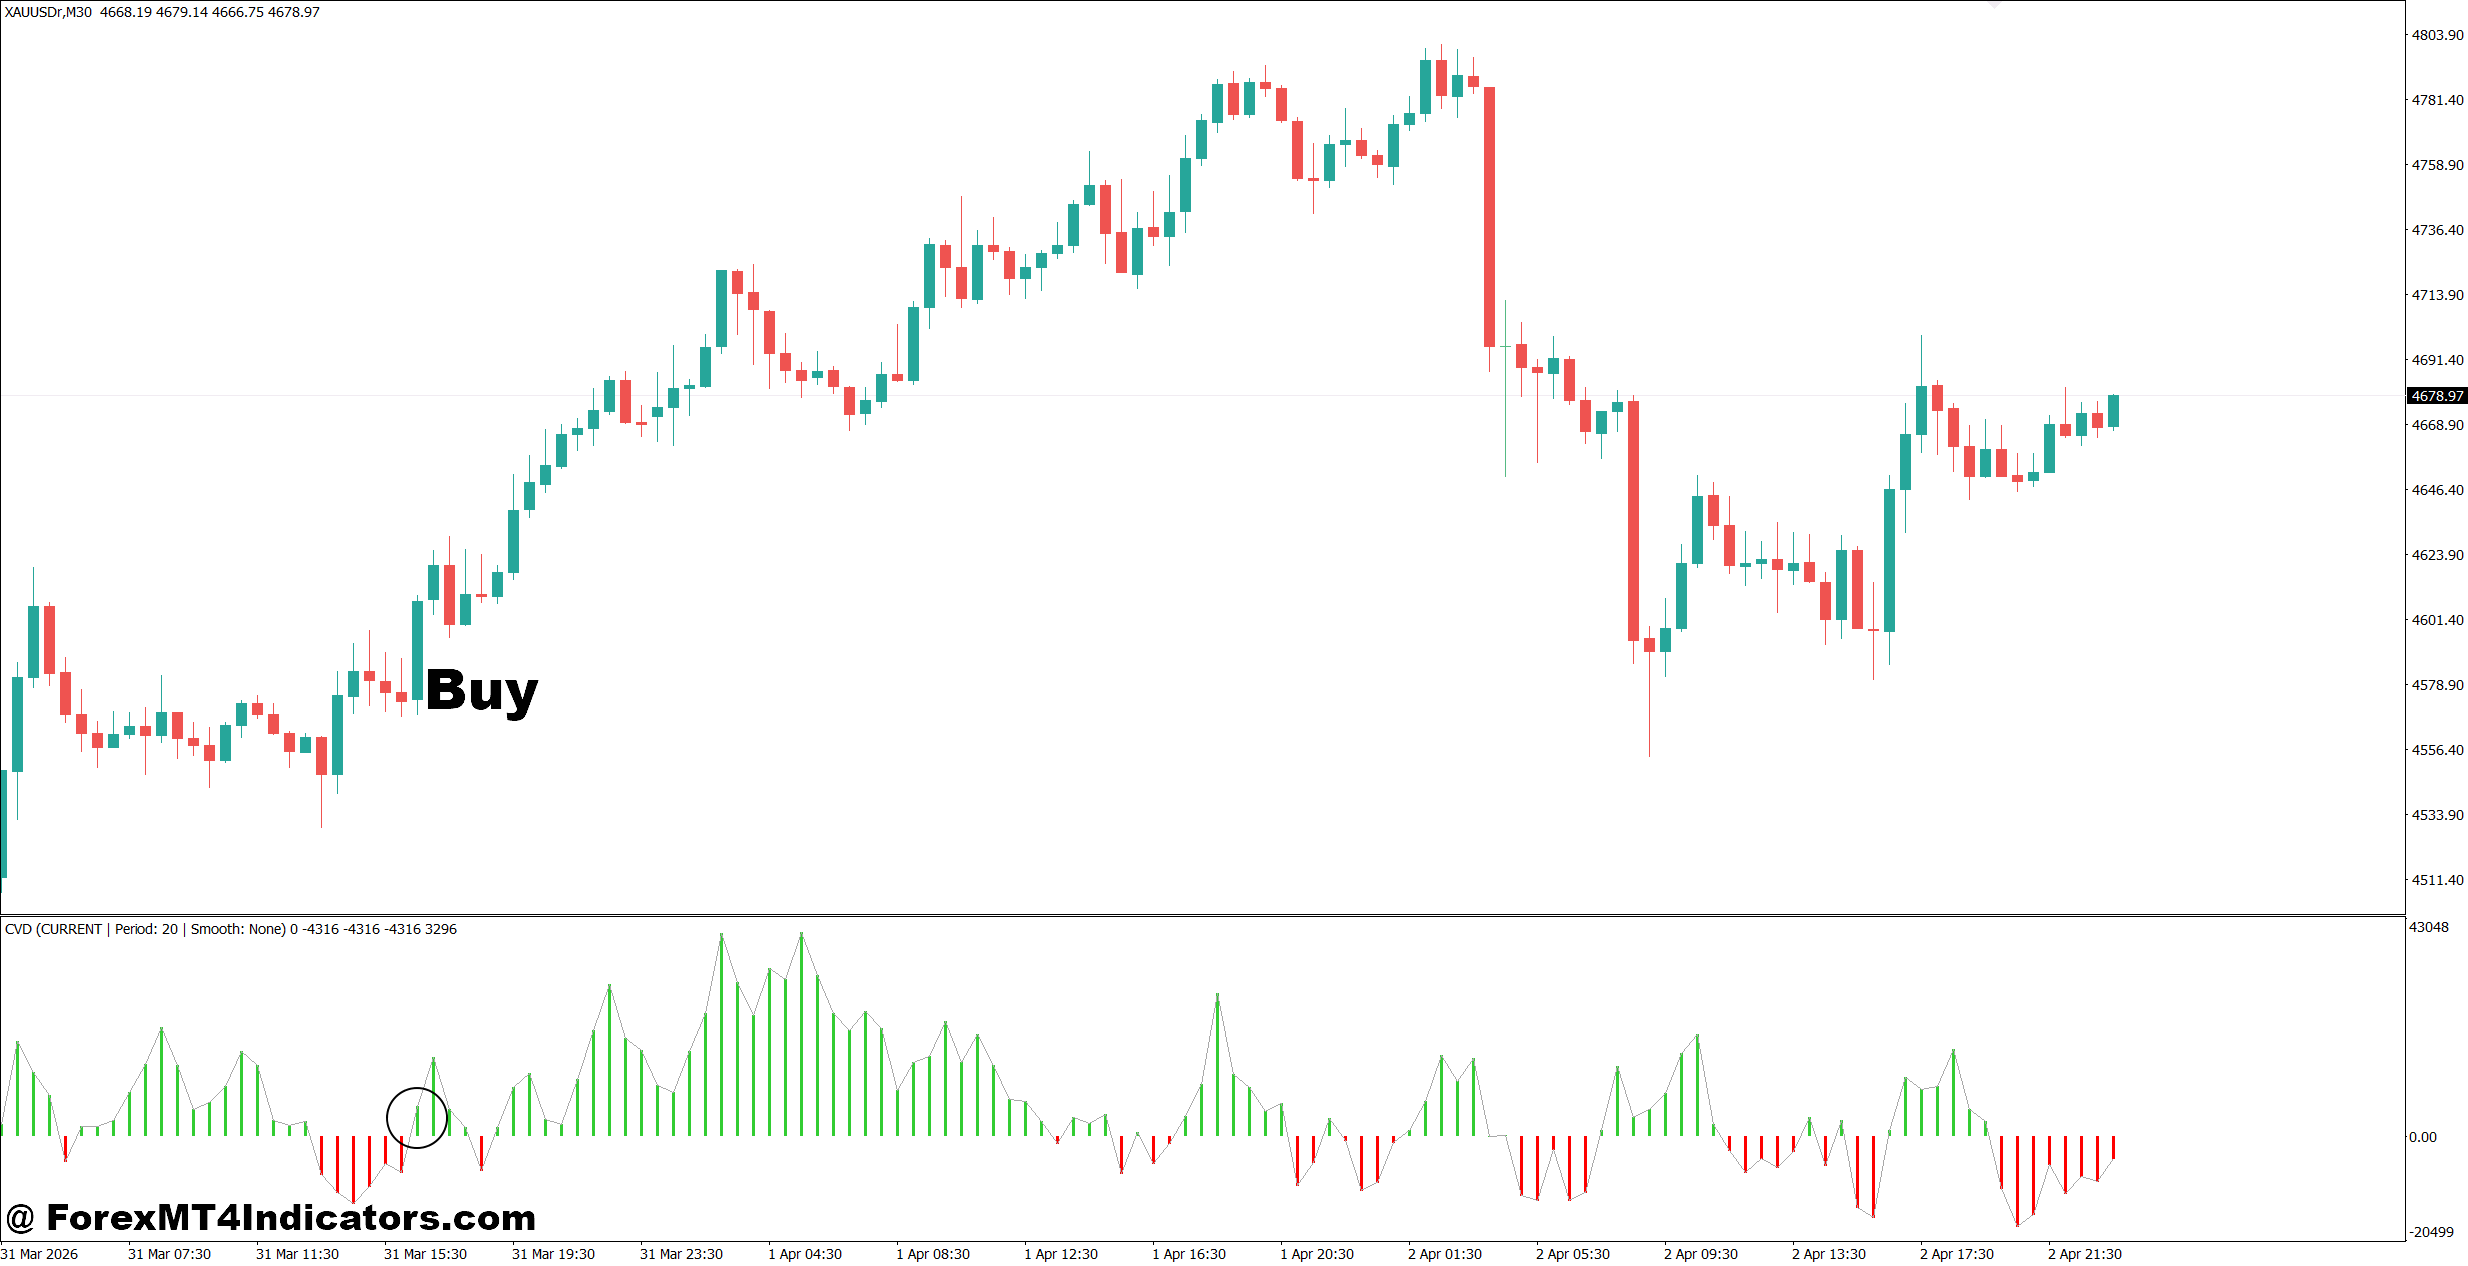
- Confirm rising CVD – Enter a buy when the CVD line makes higher highs with price on the EUR/USD 1-hour chart for stronger momentum.
- Buy after pullback – Wait for price to bounce from support while CVD turns positive; target 30-50 pips with a 20-pip stop-loss.
- Trade bullish divergence – Buy when price forms a lower low but CVD prints a higher low on the GBP/USD 4-hour chart.
- Confirm breakout – Enter only if resistance breaks with rising CVD and aim for at least a 1:2 risk-reward ratio.
- Follow the trend – Take buy signals only when price stays above the 50 EMA on the 1-hour timeframe.
- Manage risk – Risk no more than 1-2% of account equity on a single trade, even with strong confirmation.
- Avoid low-volume sessions – Skip buy trades during the late U.S. session or major holidays when volume drops.
- Wait for candle close – Enter only after the confirmation candle closes to avoid fake-outs and whipsaws.
Sell Entry
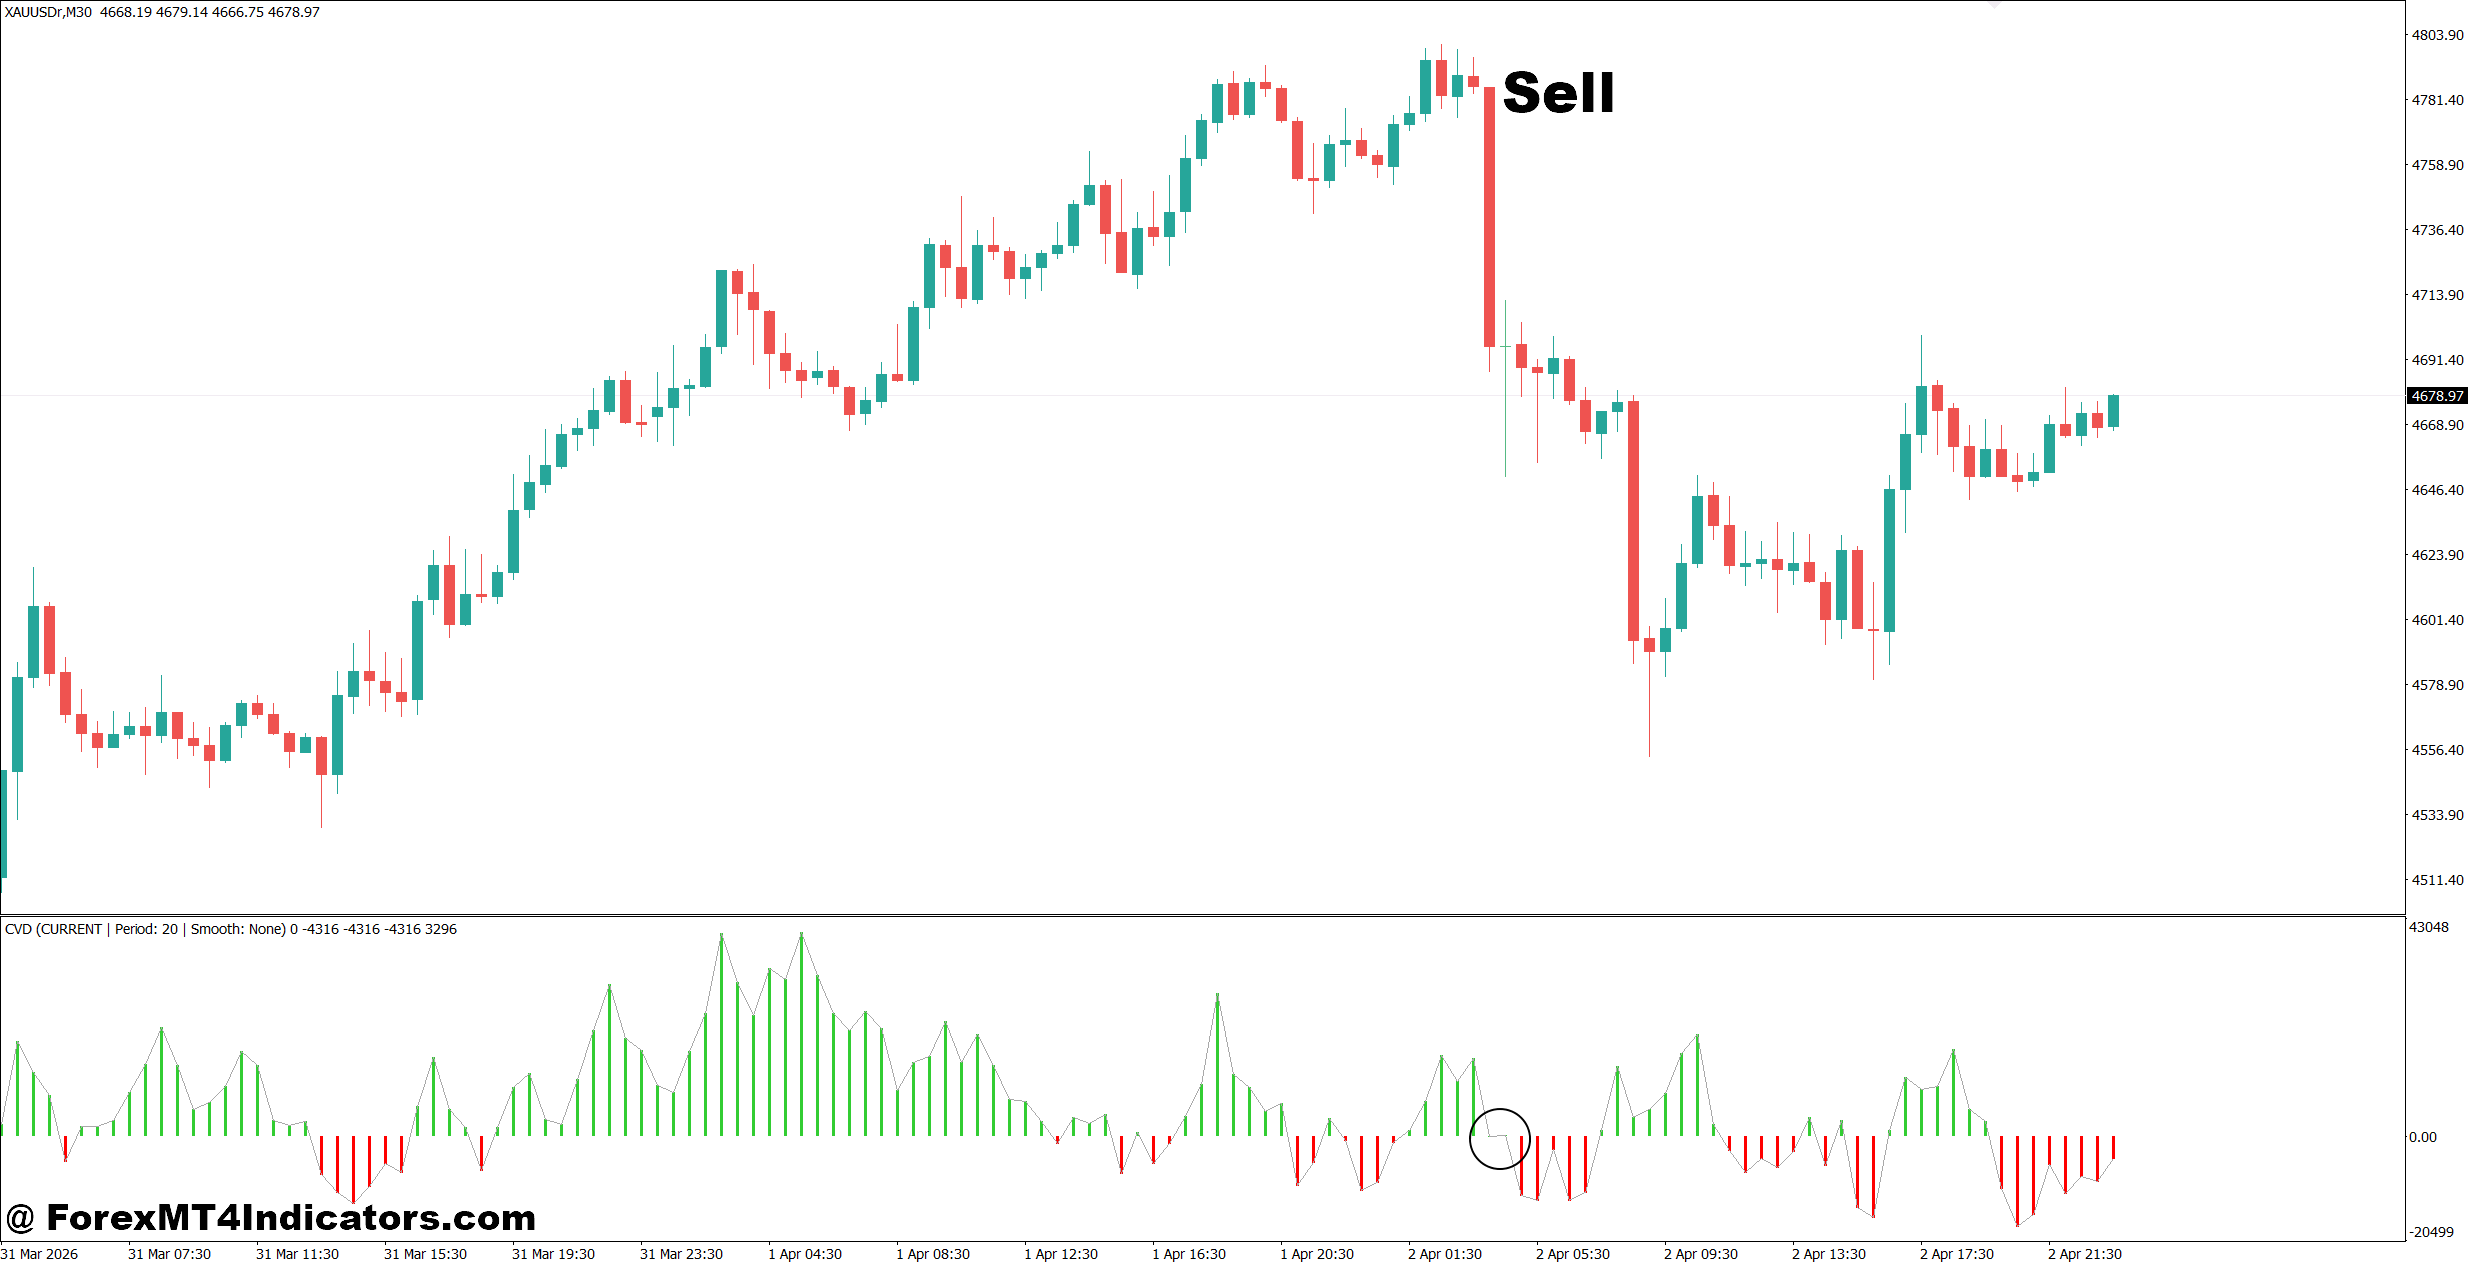
- Confirm falling CVD – Sell when the CVD line makes lower lows with price on the EUR/USD 1-hour chart.
- Sell after resistance rejection – Enter after a bearish rejection candle with declining CVD; target 30-60 pips.
- Trade bearish divergence – Sell when price makes a higher high but CVD forms a lower high on the GBP/USD 4-hour chart.
- Confirm downside breakout – Take the trade only if support breaks with increasing selling pressure on CVD.
- Follow the downtrend – Sell only when price remains below the 50 EMA on the daily or 4-hour chart.
- Protect your capital – Place the stop-loss 15-25 pips above the recent swing high and risk only 1-2%.
- Avoid major news events – Don’t enter sell trades just before NFP, CPI, or central bank announcements.
- Exit weak setups – Close or avoid the trade if CVD starts rising while price is still falling, as momentum may reverse.
The Cumulative Volume Delta Indicator MT4 gives traders another perspective by showing how buying and selling pressure develops beneath price movement. Key takeaways include using it to confirm trends, watching for divergence before potential reversals, comparing it with support and resistance, and remembering that broker tick volume has limitations. It performs best alongside solid market structure instead of replacing it. Traders who combine careful testing, disciplined risk management, and realistic expectations often gain more value from this indicator than those searching for perfect signals. Like every technical analysis tool, it works best as one piece of a complete trading strategy rather than a standalone decision-maker.
Level up your trading
Learn to read the chart — not just the indicator
eBook · Instant PDF
Video Course · 12 modules
Recommended MT4/MT5 Brokers
- ✓ *FREE *$50 to start (withdrawable)
- ✓ Deposit bonus up to $5,000
- ✓ Negative balance protection
Trading forex and CFDs carries a significant risk of loss and is not suitable for everyone. Broker links are affiliate links — we may earn a commission at no cost to you.
Free MT4 Indicator Download

Enter Your Email Address below, download link will be sent to you.