

Equal highs are two or more swing highs sitting at nearly the same price; equal lows are two or more swing lows at nearly the same price. In smart money concepts they form horizontal levels where stop orders cluster, creating pools of resting liquidity that price is often drawn to sweep before it reverses.
That is the whole idea in one breath. The rest of this article unpacks the precise mechanics, shows you how to mark these levels honestly, and — just as important — tells you where the popular narrative around them is marketing rather than fact. Forex and CFD trading carries a high risk of losing money, and most retail traders lose regardless of the concepts they use. Treat everything below as a way of reading price, not a promise about it.
What equal highs and equal lows are
An equal high is formed when two or more confirmed swing highs print at roughly the same price, so a single horizontal line touches both. Equal lows are the mirror: two or more swing lows at nearly the same price, forming a flat floor. The shape is ordinary. What smart money concepts (SMC) add is an interpretation of why those flat levels matter.
The answer is liquidity. Traders defend obvious levels, and defending a level means placing stop orders around it. Above an equal high, buy stops rest. In SMC this pool of resting buy orders is called buy-side liquidity (BSL). Below an equal low, sell stops rest, and this pool is called sell-side liquidity (SSL). The naming feels backwards until you see where the orders come from.
Buy stops above equal highs come from two groups: short-sellers whose protective stops sit above the highs they sold into, and breakout buyers whose entry stops sit just above the ceiling, ready to fire if it breaks. Sell stops below equal lows come from the opposite pair: longs protecting positions with stops under the floor, and breakout sellers waiting to enter on a break lower. Either way, orders pile up in a narrow band just beyond the level.
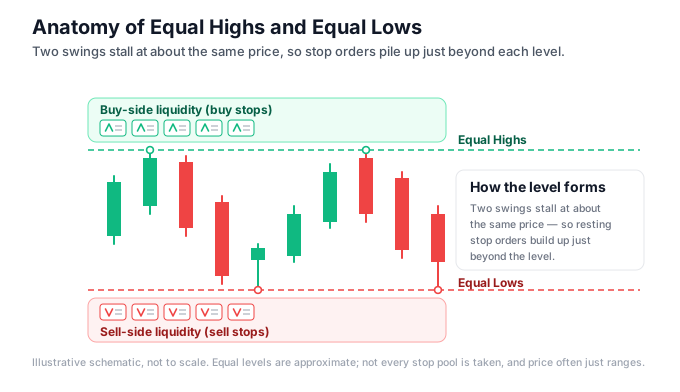
Because the level looks clean, more traders see it, and more stops accumulate beyond it. SMC calls an especially tidy, obvious level engineered liquidity or a liquidity pool — the notion being that the market is drawn to run that pool before it reverses. Be clear-eyed here: this is an interpretive model, not a proven fact about order flow. Nobody publishes the order book. The model is useful as a way of ranking which levels are likely to be attacked, not as a law of physics.
One term worth defining now, because it does most of the work later. A liquidity sweep (also called a stop run) is when price briefly trades beyond the level, triggers the resting stops, fails to hold, and reverses back into the range. If price pushes through and simply keeps going, that is not a sweep — it is a break, or a run, and the level has failed. The difference between “sweep” and “break” is only ever confirmed after the fact, which is the honest headache at the centre of this whole approach.
The vocabulary comes largely from ICT — the Inner Circle Trader, the online alias of Michael J. Huddleston, who popularised these terms. SMC is the broader label for the same family of ideas. It is fair to note that many ICT concepts — accumulation, stop runs, ranges — are re-labelled ideas from earlier work such as Wyckoff, and that critics reasonably point out they are largely unfalsifiable and easy to fit to a chart after the move has already happened.
How to spot them
Start from confirmed swing pivots, not from every candle. A swing high is a candle whose high sits above the highs of the candles on both sides of it; a swing low is the mirror. Mark only the meaningful pivots on the timeframe you actually trade. If you tag every minor wick, you will find “equal” levels everywhere, and levels that are everywhere are worth nothing.
With your pivots marked, look for two or more of them printing at roughly the same price, so a horizontal line touches both cleanly. Equal highs give you a flat ceiling; equal lows give you a flat floor. If a level only lines up when you squint, it is not clean — leave it.
Allow a small tolerance. Exact tick-for-tick matches are rare, so traders apply an equality threshold of a few pips, or a fraction of the average candle range. There is no fixed numerical threshold for “equal”; it is a discretionary judgement, and you should write your own rule down and stick to it rather than eyeballing it differently each time. If you are unsure what a pip is in the pairs you trade, settle that first — our guide to what a pip is covers it — because your tolerance is measured in pips.
Once you have a line, note which liquidity sits beyond it. Above equal highs sits buy-side liquidity; below equal lows sits sell-side liquidity. Marking the line without labelling the liquidity is half a job.
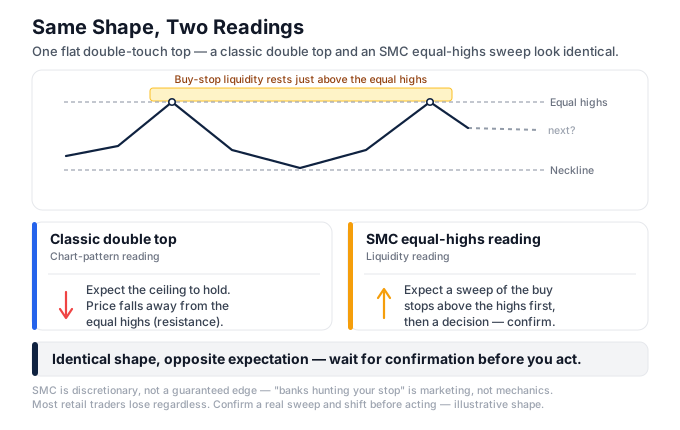
Finally, and this is the part most guides skip: distinguish the level from a plain double top or double bottom. The price picture is identical. The SMC reading is the opposite. A classic double top says the ceiling holds and price falls away from it. The equal-highs reading says the obvious ceiling is more likely to be run — swept — before anything reverses. Same shape, opposite expectation. You cannot hold both theses at once; you pick one and demand confirmation. Some traders combine equal highs with classic support and resistance thinking, but be honest about which lens you are using at any moment.
The rough rule of thumb SMC applies: the cleaner and more obvious the level, the better it fits the “engineered liquidity” idea, precisely because the whole market can see it and parks stops there. Treat that as a probability tilt, not a certainty.
How to trade or use them
The first rule is a negative one. Do not trade the level blindly as a reversal. Equal highs and equal lows mark where liquidity rests; they are not a signal that price must turn. Most breaks and sweeps are noise. The level only becomes tradeable with confirmation.
The setup the framework describes is specific. Wait for the sweep, not the touch. You are looking for a spike through the level that fails to hold — often leaving a long rejection wick — followed by price snapping back inside the range. A gentle tap of the line is not a sweep. The stops need to actually be triggered and then abandoned for the read to make sense.
After the sweep, look for confirmation before you enter. The common one is a shift in short-term structure back the other way — price making a lower high after sweeping an equal high, for instance. The idea is to enter on the reaction, not to predict the spike. Predicting the spike is guessing; trading the failure of the spike is at least a defined event.
If you take the trade, protect it beyond the sweep extreme. For a short after a swept equal high, your stop goes above the wick high; for a long after a swept equal low, below the wick low. Sweeps can extend further than expected, and a stop tucked just inside the wick will be taken out by the next probe.
A concrete worked example
Suppose EUR/USD prints two swing highs at 1.0952 and 1.0951 over a London session — close enough, within your two-pip tolerance, to draw a flat equal-highs line at roughly 1.0952. You mark it and note buy-side liquidity above: short-sellers’ stops and breakout buyers’ entry stops stacked from about 1.0953 upward.
Later in the day, one candle spikes to 1.0961, tags those stops, and closes back at 1.0948 — a long upper wick, price rejected back below the line. That is the sweep. You do not enter yet. You wait, and the next few candles fail to reclaim 1.0952 and instead print a lower high around 1.0946. That lower high is your short-term structure shift — your confirmation. Only now do you consider a short, with a stop above the 1.0961 wick high, sized so that being wrong costs a small, pre-decided fraction of your account.
Notice what could still go wrong. Price might have blown through 1.0961 and kept climbing — a break, not a sweep, and your patience just saved you from a bad short. Or the level might never have been reached at all. Both outcomes are normal. The example reads cleanly because it is written after the fact; live, you do not know which candle is “the” sweep until it has already resolved.
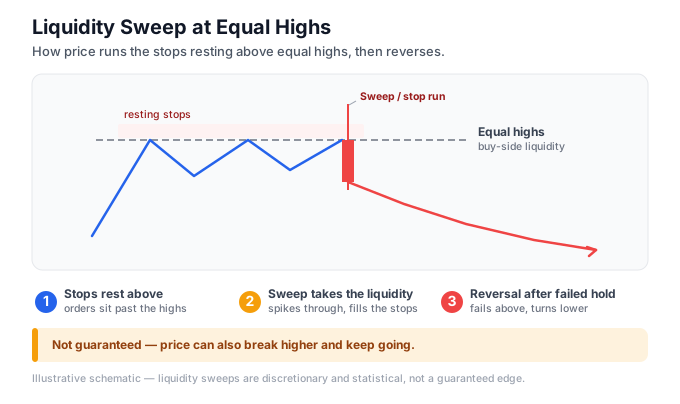
You are also, unavoidably, on the same side as everyone else. Equal highs and lows are one of the most-watched patterns in retail SMC, which means edge decays and false sweeps are common — a spike that looks like a sweep, sucks in the reaction traders, then reverses again. Size small, expect to be wrong often, and never risk money you cannot afford to lose. A tool such as a liquidity indicator for MT5 can plot the equal highs and lows and flag sweeps automatically, which saves chart time, but it automates the drawing, not the judgement — the decision to trade is still discretionary and still yours. Before any of this touches real money, write your rules into a trading plan, then backtest and forward-test them. It is easy to draw the perfect sweep in hindsight and hard to trade one live.
Common mistakes
Treating equal highs and lows as guaranteed reversals. They mark where liquidity rests, not what price will do next. The level can be swept and keep going, or never be reached at all. Any framing that promises a turn is overselling.
Believing the “banks are hunting your specific stop” narrative. Large players trade against pools of resting orders because that is where size can be filled. They are not looking at your individual position. The personal-hunt story is marketing, not mechanics, and dropping it will make you a calmer trader.
Confusing a double top or bottom with the liquidity reading and expecting both to behave the same way. They give opposite expectations for the level. You have to pick a thesis and confirm it, not hold both and rationalise whichever happens.
Entering on the spike through the level instead of waiting for it to fail. Chasing the breakout is exactly the behaviour the pattern preys on — your entry stop is part of the liquidity being taken. Wait for the reclaim.
Drawing equal highs and lows after the move has already happened. Any chart can be made to fit in hindsight. The framework is easy to rationalise backwards and hard to trade forwards, so judge yourself only on levels you marked before they resolved.
Forcing “equal” onto pivots that are not clean, or drawing off every minor wick rather than confirmed swing points. This produces low-quality levels everywhere and buries the few that matter.
Assuming sweeps only happen in “killzones” or at fixed times. Session windows are a statistical tendency at best, not a rule. Building an entire plan around fixed clock times over-fits the past. If you want to understand the timing claims properly, read them critically — our notes on ICT killzones and the plainer forex sessions explainer both set out what the windows actually are and are not.
How it fits the wider SMC framework
Equal highs and equal lows are one building block, not the whole house. They tell you where liquidity is likely resting. Other tools in the same toolbox tell you related things, and they are only powerful in combination — with the same discretionary caveats attached to each.
A liquidity sweep is the event that acts on an equal-highs or equal-lows level; the level is the setup, the sweep is the trigger. Inducement is the closely related idea that a smaller, tempting level is left in front of the real pool to bait early entries — subjective, and easy to over-read, but worth knowing. After a sweep, SMC traders look for a shift in structure, which is where the distinction between a break of structure and a change of character does the confirming work in the example above. And the zones price sweeps into or reverses from are often read alongside premium and discount zones and order-flow ideas like the order block and the fair value gap.
The connective tissue for all of it — how these pieces are meant to sequence into a full read, and, crucially, what the honest limitations are — lives in our smart money concepts pillar guide. Start there if you are new, then come back to individual concepts like this one.
Hold onto the honest frame throughout. There is no verified public evidence that the SMC or ICT framework produces a consistent edge, and the overwhelming majority of retail traders lose money regardless of method. Equal highs and lows are a genuinely useful way to think about where obvious levels and clustered orders meet — a probability tilt worth having on your chart. They are not a machine that prints money, and anyone selling them as one is selling you something.
Frequently asked questions
What are equal highs and equal lows in trading?
Equal highs are two or more swing highs sitting at nearly the same price; equal lows are two or more swing lows at nearly the same price. In smart money concepts they form horizontal levels where stop orders cluster, creating pools of resting liquidity that price is often drawn to sweep before it reverses.
Why do equal highs and equal lows matter?
They concentrate liquidity in a narrow price band. Buy stops from short-sellers and breakout buyers rest just above equal highs (buy-side liquidity); sell stops from longs and breakout sellers rest just below equal lows (sell-side liquidity). Because the level looks clean and obvious, stops pile up beyond it, making it a target for a sweep.
What is the difference between equal highs and a double top?
The chart shape is identical, but the reading is opposite. A classic double top expects the ceiling to hold and price to fall from it. The equal-highs, or liquidity, reading expects the obvious ceiling to be run first — sweeping the buy stops above it — before any reversal. You must choose a thesis and wait for confirmation.
How do you trade equal highs and equal lows?
Do not trade them blindly as reversals. Mark the level, then wait for a sweep: a spike through it that fails to hold, often leaving a long rejection wick, followed by price reclaiming the range. Look for confirmation, enter on the reaction, and place your stop beyond the sweep extreme. Risk small.
Is the equal highs and equal lows concept reliable?
No method is reliable on its own. Equal highs and lows only mark where liquidity rests; price can sweep the level and keep going, or reverse without reaching it. The framework is discretionary and easy to fit in hindsight, and most retail traders lose money regardless of the concepts they use.
Do banks really hunt stops at equal highs and lows?
Large players do trade against pools of resting orders, and clean levels are where those orders cluster. But the popular idea that banks target your individual stop is marketing. It is order flow meeting obvious levels, not a personal hunt — and it is a probability tilt, not a guarantee that price will reverse.
Ready to put this into practice?
Open an account with a regulated broker and apply what you have learned. These are the three brokers we recommend:
Trading forex and CFDs carries a significant risk of loss and is not suitable for everyone. Broker links are affiliate links — we may earn a commission at no cost to you.