

An order block is the last opposing candle before a strong, impulsive move that breaks market structure. A bullish order block is the last down candle before a sharp rally; a bearish order block is the last up candle before a sharp sell-off. It marks a price zone where large institutional orders are presumed to sit — one building block of the SMC framework.
That capsule is the whole idea in two sentences, but order blocks are widely misunderstood and heavily over-sold online. This guide explains the precise mechanics, how to mark a valid one, how to trade a retest with a concrete worked example, and — just as important — where the concept breaks down. Order blocks are a discretionary tool inside the broader smart money concepts framework, not a formula that prints money.
What an order block actually is
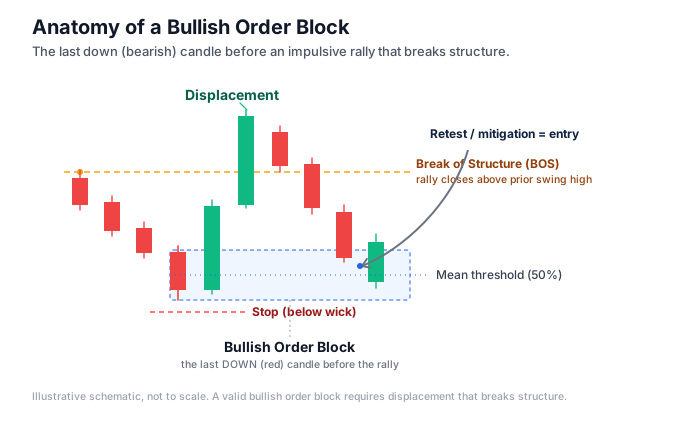
An order block is a specific candle (or a small cluster of candles) that precedes displacement — a fast, one-sided move that shifts price to a new area and breaks a prior swing high or low.
The logic goes like this. When a large participant wants to fill a big buy order, they cannot simply lift the whole market at once without moving price against themselves. The narrative in SMC is that the last down candle before an up-move is where that accumulation happened, so when price later returns to that candle’s range, resting orders and fresh interest push it back in the impulsive direction.
Two things matter in that definition, and most beginners miss both.
First, the direction is counter-intuitive. A bullish order block is a down (bearish) candle — the final red candle before price rips higher. A bearish order block is an up (bullish) candle — the final green candle before price drops. You mark the candle that goes against the move that follows it.
Second, the move that follows has to break structure. A single red candle followed by a lazy drift higher is not an order block. The move must be impulsive and must take out a prior swing point — a break of structure. Without that displacement, you are just drawing a box around a random candle.
Order block vs supply and demand zone
People use “order block” and “supply/demand zone” interchangeably. They overlap but are not identical.
A supply or demand zone is any area where price previously reversed sharply, marked from the base (consolidation) before the move. An order block is narrower and rule-bound: it is a single opposing candle tied to a structural break. Every valid order block sits inside a demand or supply area, but not every supply/demand zone qualifies as an order block.
If you already trade zones, treat order blocks as a stricter, more selective subset. The demand-zone concept is the parent; the order block is the sharpened tool. Both are refinements of ordinary support and resistance — the same reaction levels, described with more precision.
How to spot a valid order block
Marking order blocks is a checklist, not a vibe. Work through these in order.
1. Find the displacement. Scan left to right for a strong, impulsive move — several candles closing in the same direction with little overlap, ideally leaving a fair value gap (an imbalance) behind. Displacement is the fingerprint that a large order was worked.
2. Confirm the break of structure. That impulsive move must close beyond a prior swing high (for an up-move) or swing low (for a down-move). No break of structure, no valid order block. This is the single most-skipped rule.
3. Identify the last opposing candle. Step back to the candle immediately before displacement began. For a bullish setup, it is the last down-close candle before the rally. For a bearish setup, it is the last up-close candle before the drop.
4. Draw the zone. Mark from the candle’s open to close, or open to the wick extreme, depending on how conservative you want to be. Body-only zones are tighter with better risk-reward but get missed more often; wick-inclusive zones fill more reliably but sit wider. Pick one convention and keep it consistent.
5. Check it is fresh. An order block that price has already returned to and reacted from has, in SMC theory, had its resting liquidity consumed. The first retest (“fresh” or “unmitigated”) is treated as the higher-quality one. A block price has tapped several times is weaker.
Higher-timeframe order blocks — 4-hour, daily — carry more weight than 5-minute ones simply because more participants watch them and more volume transacts there. If you are starting out, mark them on the higher timeframe and refine entries lower down.
How to trade an order block
The standard play is a retest. You wait for price to leave the order block via displacement, then return to it, and you look to enter in the original impulsive direction. You are not catching the initial move — you are trading the pullback into the zone.
Here is a concrete, self-contained worked example. Numbers are illustrative, chosen to show the arithmetic — they are not a signal.
Say EUR/USD is ranging. A candle closes down at 1.0850–1.0840 (open to close). The very next candles rip higher, closing at 1.0920 and breaking the prior swing high at 1.0900. That is displacement plus a break of structure, so the 1.0850–1.0840 down candle becomes your bullish order block.
Price then pulls back over the next few hours and re-enters the zone at 1.0850. Your plan, decided in advance:
- Entry: a buy on the retest into the block, around 1.0845. Some traders enter on touch; more conservative traders wait for a lower-timeframe bullish shift inside the zone before committing. Know your order types — a limit order rests at the zone, a market order confirms first.
- Stop loss: below the order block’s low plus a buffer, say 1.0820. That is 25 pips of risk. The logic: if price closes cleanly back through the block, the idea is invalidated and you want out.
- Target: the next opposing liquidity or structure high. Say 1.0945 — 100 pips of reward against 25 of risk, a 4:1 setup on paper.
The reason to buy here rather than short is that the structure has flipped bullish; you are trading with the impulsive leg, long rather than short, into a zone where demand was demonstrated.
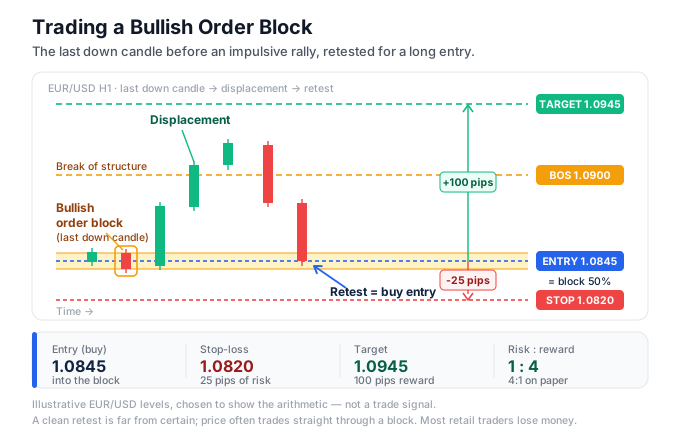
Two honest caveats on that example. The 4:1 ratio is what the chart offers, not what you achieve — price frequently trades through an order block without reacting, and your realistic hit rate on retests is well under 100%. And the “clean” retest in a textbook rarely looks clean live; price often overshoots the zone, wicks your stop, then goes. Position your stop for the noise, not the ideal.
Where confluence helps
An order block in isolation is a coin-flip dressed up. Traders stack conditions to tilt the odds:
- The retest fills an unmitigated fair value gap inside the same zone.
- The move into the block first ran obvious resting liquidity — a liquidity sweep of a prior high or low — before reversing.
- The order block aligns with a higher-timeframe level or session open.
- The broader trend agrees with the direction you are taking.
None of these guarantees anything. They are filters that reduce the number of trades you take, which is usually the point.
Common mistakes
Marking a candle with no displacement. The most frequent error. If the move away from your candle was slow and overlapping and broke no structure, it is not an order block. Delete the box.
Ignoring the break of structure. A pullback in a trend is not automatically an order block. The preceding move must have broken a swing point, not merely continued.
Getting the colour backwards. Repeat it until it sticks: bullish order block = last down candle; bearish order block = last up candle. You mark against the move.
Trading every block you see. Lower-timeframe charts are littered with candles that technically qualify. Selectivity — fresh, higher-timeframe, with confluence — is the entire edge. Volume over quality is a fast way to churn an account.
No stop, or a stop that is too tight. Order block trading invites “the zone will hold” thinking. It often does not. A stop pressed right against the block gets picked off by ordinary noise. If you cannot define invalidation, you do not have a trade.
Believing the conspiracy framing. You will read that “banks are hunting your stops.” That is marketing, not mechanics. Institutions transact where liquidity is — clustered orders near obvious levels — because that is the only place they can fill size. It is structural, not personal. Treating it as a personal vendetta leads to worse decisions, not better ones. If you are newer, our guide to beginner mistakes covers this trap and others.
And the blunt reality: order blocks are a discretionary, interpretive framework. Two competent traders will mark the same chart differently. There is no published, independently verified edge that says trading order blocks is profitable on its own. The majority of retail traders lose money regardless of method. Order blocks can structure your decisions; they cannot substitute for risk management, and they are not a certainty.
How indicators automate order blocks
Marking order blocks by hand is slow and subjective, which is why traders reach for tooling. An indicator can scan for the displacement-plus-break-of-structure pattern, draw the zone automatically, and often flag whether a block is still fresh or already mitigated.
On MT5, the order block locator indicator plots qualifying bullish and bearish blocks straight onto the chart, so you are not eyeballing every candle. On MT4, the Shved supply and demand indicator maps the parent zones that order blocks live inside, and the companion Shved supply-and-demand and order-block-breaker strategy walks through a full rule set built around them. Broader smart money concepts indicators bundle order blocks together with structure and liquidity in one overlay.
Use these as a second pair of eyes, not an autopilot. An indicator applies fixed rules to a fuzzy concept, so it will draw blocks you would reject and miss context you would catch. Verify every auto-drawn zone against the checklist above — displacement, break of structure, freshness — before you risk anything on it. The tool speeds up the mechanical part; the judgement is still yours.
Frequently asked questions
What is the difference between a bullish and bearish order block?
A bullish order block is the last down (bearish) candle before a strong up-move that breaks structure; you look to buy on a return to it. A bearish order block is the last up (bullish) candle before a strong down-move that breaks structure; you look to sell on a return to it. In both cases you mark the candle that moved against the impulsive leg that followed.
How do I know if an order block is valid?
It must satisfy two conditions. First, the candle is immediately followed by displacement — a fast, one-sided move. Second, that move breaks a prior swing high or low (a break of structure). A candle without a strong follow-through and a structural break is not an order block, however clean it looks.
Are order blocks the same as supply and demand zones?
They overlap but are not identical. A supply or demand zone is any area price reversed from sharply. An order block is a stricter subset: a single opposing candle tied to a specific structural break. Every valid order block sits within a supply or demand area, but not every zone qualifies as an order block.
Which timeframe is best for order blocks?
Higher timeframes — 4-hour and daily — produce more reliable order blocks because more volume transacts there and more traders watch them. A common approach is to mark blocks on the higher timeframe, then refine entries on a lower one. Lower-timeframe blocks exist in far greater numbers but are noisier and lower quality.
Do order blocks always hold?
No. Price frequently trades straight through an order block without reacting, and blocks fail regularly. That is why a defined stop-loss below (or above) the zone is non-negotiable, and why traders stack confluence to filter the setups. Order blocks improve the structure of a decision; they do not guarantee the outcome. Most retail traders lose money, and no method changes that on its own.
Can an order block indicator trade for me?
An indicator can find and draw order blocks automatically, but it applies fixed rules to a discretionary concept, so it will produce false positives and miss context. Treat auto-drawn blocks as candidates to verify by hand, not signals to trade blindly. The tooling saves time; the risk management and final judgement remain your responsibility.
Risk warning: Trading forex and CFDs carries a high risk of loss and is not suitable for everyone. The majority of retail traders lose money. Nothing here is financial advice — order blocks are a discretionary analytical concept, not a guaranteed edge. Never risk money you cannot afford to lose.
Ready to put this into practice?
Open an account with a regulated broker and apply what you have learned. These are the three brokers we recommend:
Trading forex and CFDs carries a significant risk of loss and is not suitable for everyone. Broker links are affiliate links — we may earn a commission at no cost to you.