


“Smart money” is capital controlled by large, informed institutions — banks, hedge funds, asset managers and pension funds — whose orders are big enough to move price, as opposed to “dumb money” retail flow. Smart Money Concepts (SMC) is a retail trading framework that tries to read those institutional footprints through market structure, order blocks, fair value gaps and liquidity.
That definition matters because the term is used two very different ways. One is an honest description of who actually holds size in a market. The other is a marketing hook — the idea that “smart money” is personally hunting your stop-loss. This article separates the two, so you can use the useful parts of SMC without buying the mythology around it.
What “smart money” actually means
In every market there is a spectrum of participants. At one end sit large, informed institutions with research teams, direct pricing relationships and the balance-sheet size to execute in the billions. At the other end sits retail — individuals trading a few thousand dollars through a broker. “Smart money” is shorthand for the first group; “dumb money” is the slightly unkind label for the second.
The distinction is real, but it is not moral. Institutions are not smarter as people. They are better-informed, better-capitalised and structurally advantaged. A bank quoting spot FX sees order flow that no retail trader ever will. A macro fund can hold a losing position for months because its risk budget allows it. That is what “smart” points to: information and staying power, not genius.
It also is not one entity. There is no single “smart money” desk coordinating against you. There are thousands of institutions with conflicting views, different time horizons and opposing positions. When people say “the smart money is short”, they are compressing a messy, disagreeing crowd into a tidy character. Keep that in mind — it is the root of most SMC confusion.
The forex market is the largest and most liquid in the world, turning over trillions of dollars a day. If you are new to how that market is structured, what forex trading is gives you the groundwork this article assumes.
Where Smart Money Concepts came from
Smart Money Concepts is a retail framework, not an institutional one. It grew out of supply-and-demand trading and was popularised online through the 2010s, drawing heavily on ideas taught under the Inner Circle Trader banner. It repackaged older price-action concepts — support and resistance, accumulation and distribution, stop runs — into a labelled system with its own vocabulary.
That vocabulary is the part most people meet first: order blocks, fair value gaps, break of structure, change of character, liquidity pools, mitigation. None of these are terms a bank dealer uses. They are retail interpretations of what institutional activity might look like on a chart after the fact.
This is a crucial framing. SMC does not give you institutional data. It gives you a lens for reading ordinary price action and guessing where large orders may have sat. Used with discipline, that lens can sharpen your reads. Sold as a crystal ball, it misleads people badly.
Reality versus marketing
Here is the honest split. Some of what SMC claims is grounded in how markets genuinely work. Some of it is storytelling that sells courses.
What is real. Large orders do cluster around obvious price levels. Stop-losses do pool beneath swing lows and above swing highs, because most traders place them in the same predictable spots. Institutions executing big size genuinely do prefer to fill where liquidity is deepest — and the deepest liquidity often sits exactly where all those retail stops are resting. So price does frequently spike through an obvious level, trigger a cluster of stops, and reverse. That pattern is observable and repeatable. SMC calls it a liquidity sweep, and it is a legitimate thing to watch for.
What is marketing. The claim that “the banks are hunting your stop” is nonsense. No institution knows or cares where your individual 0.2-lot stop sits. What happens is structural, not personal: liquidity gathers in predictable zones, and large flow gets filled against it. That is a consequence of crowd behaviour, not a conspiracy aimed at you. The difference sounds pedantic, but it changes how you trade — you stop feeling persecuted and start reading probability.
What is unprovable. Order blocks and fair value gaps are labelled after price has already moved. You can always find a candle to call “the order block” in hindsight. Whether an institution actually filled orders there is something you cannot verify from a retail chart. The pattern may still have predictive value as a zone of interest — but treat it as an interpretation, not a fact.
The uncomfortable bottom line: SMC is a discretionary analytical framework, not a guaranteed edge. It does not change the base rate. Most retail traders lose money regardless of the framework they use, and adopting SMC vocabulary does not exempt you from that. Anyone selling it as a shortcut to certainty is selling the marketing, not the method.
The core building blocks
SMC reads price through a small set of related ideas. You do not need all of them to start, but they interlock — our complete SMC framework guide shows how they fit together.
Market structure is the sequence of swing highs and lows. A series of higher highs and higher lows is an uptrend; lower highs and lower lows is a downtrend. When price breaks the most recent swing in the trend direction, SMC calls it a break of structure (BOS). When it breaks against the trend and flips the sequence, that is a change of character (CHoCH). Getting these two straight is foundational — break of structure versus change of character covers the distinction in detail, because mixing them up is where most beginners go wrong.
Liquidity is resting orders — mostly stop-losses and pending orders — clustered where they are easy to predict. Equal highs, equal lows and obvious round numbers are liquidity magnets. Price often gravitates toward these pools before making its real move.
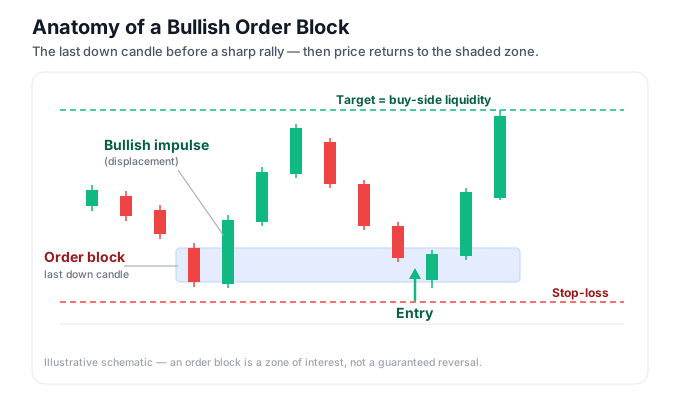
Order blocks are the last opposing candle before a strong, structure-breaking move. The theory is that this candle marks where institutions absorbed orders. Traders watch for price to return to that zone. What an order block is walks through the mechanics and the honest caveats.
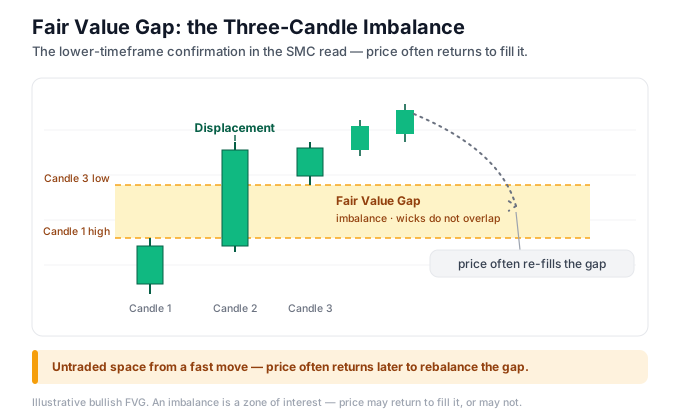
Fair value gaps (FVGs) are three-candle imbalances where price moved so fast it left a gap between the first and third candle’s wicks. SMC treats these as areas price may return to “rebalance”. What a fair value gap is explains how to mark them correctly.
If those four concepts sound like a re-labelling of support and resistance with extra steps, you are not entirely wrong — SMC is a more granular, behaviour-focused evolution of the same idea, not a replacement for it.
How to spot smart-money footprints
You are never seeing institutional orders directly. You are inferring them from structure and reaction. A reasonable read follows a sequence.
First, establish the trend on a higher timeframe — the 4-hour or daily. Mark the clear swing highs and lows. This tells you which direction you want to trade with, and where the obvious liquidity pools sit.
Second, identify where retail stops are likely resting. Look for equal highs, equal lows and clean, obvious levels. These are the pools price may reach for.
Third, wait for a sweep. Price pushes through the obvious level, triggers the stops, then rejects sharply and closes back inside. That rejection is the footprint SMC cares about — it suggests larger flow absorbed the liquidity and pushed the other way.
Fourth, look for confirmation on a lower timeframe: a change of character, an order block, or a fair value gap forming in the direction of the rejection. That confluence is your potential entry area.
None of these steps is certain. A “sweep” can simply be the start of a genuine breakout that keeps going. That is why confirmation and risk control matter more than the labels.
How to trade it: a worked example
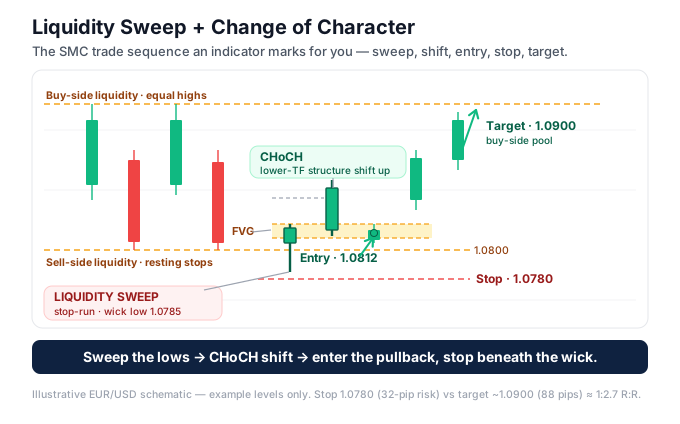
Take EUR/USD on the 4-hour chart. Suppose price has been ranging, printing two nearly equal lows around 1.0800. Those equal lows are obvious — every chart-reader can see them, and stop-losses are stacked just below.
Price drifts down and spikes to 1.0785, sweeping through the equal lows and triggering that stop cluster. Instead of continuing lower, it snaps back and closes the 4-hour candle at 1.0815 — back above the swept level. That is your liquidity sweep and a possible change of character.
You drop to the 15-minute chart for confirmation. Price makes a higher high (a small break of structure to the upside) and leaves a fair value gap on the impulse up. You mark the FVG between roughly 1.0808 and 1.0818 as your entry zone, and wait for price to pull back into it.
Price retraces into the gap at 1.0812. You enter long there. Your stop goes below the sweep low at 1.0780 — beneath the wick, not at the obvious level, so a second probe does not clip you. That is a 32-pip stop. If you are unsure what a pip represents here, what a pip is explains the unit.
Your first target is the range high near 1.0900 — the opposite liquidity pool. That is about 88 pips of reward against 32 pips of risk, a reward-to-risk of roughly 2.7 to 1. You size the position so that the 32-pip stop equals a fixed, small percentage of your account — most disciplined traders risk no more than 1% per trade.
Now the honest part. This trade can still lose. The sweep can fail, the “change of character” can reverse again, and price can grind straight through your stop. Nothing about the SMC labels guarantees the outcome. What makes the setup defensible is not the vocabulary — it is that you entered on confirmation, placed your stop where invalidation is genuine, and kept risk fixed. Understand going long versus short and the mechanics of forex order types before you place anything live.
Common mistakes
Treating labels as certainty. An order block is a zone of interest, not a guaranteed reversal. Traders who assume “price must respect this block” over-leverage into it and get run over. Every SMC level is a probability, not a promise.
Hindsight marking. After a move, you can always find a candle to crown as “the order block” that worked. The test is whether you marked it before the move, in real time, with rules you would apply consistently. Retrospective charts on social media are marketing, not evidence.
Ignoring the higher timeframe. Taking SMC setups against the dominant trend, on a 1-minute chart, with no context, is a fast way to lose. The framework works best as a refinement of a higher-timeframe bias, not a standalone signal generator.
Buying the conspiracy. If your mental model is “the market is out to get me personally”, you will trade emotionally, revenge-trade after a sweep goes against you, and blame “manipulation” instead of reviewing your process. Liquidity dynamics are structural. Read them coolly.
Over-trading the labels. SMC produces a lot of visible “setups”. Most are low quality. Waiting for genuine confluence — sweep plus structure shift plus a clean zone — filters far more than it costs you. Many of these errors overlap with the wider list in beginner forex mistakes.
No trading plan. A framework is not a plan. You still need defined entry rules, stop placement, position sizing and a review routine. How to build a trading plan turns loose SMC ideas into something you can actually test and repeat.
How indicators automate the reading
Marking market structure, order blocks, fair value gaps and liquidity pools by hand on every chart is slow and inconsistent — two traders will mark the same chart differently. Indicators reduce that inconsistency by applying fixed rules.
An all-in-one Smart Money Concepts tool detects swing points, labels BOS and CHoCH, and highlights order blocks and fair value gaps automatically as candles close. The Smart Money Concepts indicator for MT5 plots these structures on your chart so you can focus on decisions rather than annotation, and there is a Smart Money Concepts indicator for MT4 for the older platform. If you want to isolate one component, dedicated tools exist too — a liquidity indicator marks equal highs and lows and the pools around them, a liquidity sweep indicator flags stop-runs as they form, and a fair value gap indicator shades imbalances directly on price.
Use these as annotation aids, not decision-makers. An indicator plots what its rules define as an order block; it cannot tell you whether the setup is worth taking, whether the higher-timeframe context agrees, or how much to risk. It removes the drawing work and adds consistency. The judgement — and the responsibility — stay with you. You can find the full set of calculators and indicators on the forex tools hub.
A realistic word on expectations
SMC is a coherent way to read price. It draws attention to genuinely useful things — where liquidity rests, how structure shifts, where fast moves leave imbalances. Traders who apply it with strict risk control and higher-timeframe context can build a repeatable process around it.
But it is one discretionary framework among many, and it does not beat the base rate on its own. Retail forex trading carries a high risk of loss, and the majority of retail traders lose money over time — that is true with SMC, with indicators, and with any method. The framework changes what you look at. It does not change the maths of risk, and it does not entitle you to profit.
Trade small while you learn it. Journal every setup. Judge the method over a large sample, not a lucky week. And treat anyone promising that “smart money” concepts guarantee an edge with the same scepticism you would give any other too-good-to-be-true pitch.
Frequently asked questions
Is “smart money” a real thing or just marketing?
Both, depending on how the term is used. Large, informed institutions genuinely exist and genuinely move markets — that part is real. The idea that they are personally hunting your individual stop-loss is marketing. Liquidity gathers in predictable zones and large flow gets filled against it; that is structural crowd behaviour, not a conspiracy aimed at you.
Do banks really hunt retail stop-losses?
Not personally. Institutions execute large orders where liquidity is deepest, and the deepest liquidity often sits exactly where retail stops cluster — beneath obvious lows and above obvious highs. So stops do get swept, but as a by-product of where liquidity rests, not because any desk knows or targets your specific position.
Can Smart Money Concepts make me profitable?
There is no method that reliably makes retail traders profitable, SMC included. It is a discretionary analytical framework that can sharpen your reads when combined with strict risk control and higher-timeframe context. Most retail traders lose money regardless of framework, so treat any guarantee of an edge as a warning sign.
What is the difference between smart money and dumb money?
“Smart money” refers to large, well-informed, well-capitalised institutions — banks, hedge funds and asset managers — whose orders can move price. “Dumb money” is a blunt label for retail flow: individual traders with less information and smaller size. The distinction is about information and staying power, not intelligence, and it is often overstated.
Is SMC just support and resistance with new names?
Largely, yes — SMC is an evolution of supply-and-demand and support-and-resistance trading, with a more granular focus on liquidity and market structure. Concepts like order blocks and fair value gaps add detail, but they rest on the same foundation. If you understand support and resistance, you already grasp the core.
Which timeframe is best for Smart Money Concepts?
There is no single best timeframe, but a common approach is to set directional bias and mark liquidity on the 4-hour or daily, then refine entries on a lower timeframe such as the 15-minute or 5-minute. Trading SMC setups on very low timeframes with no higher context is where many beginners lose money.
Do I need an indicator to trade SMC?
No, but one helps with consistency. You can mark structure, order blocks and fair value gaps by hand, though results vary from trader to trader. A tool like the Smart Money Concepts indicator for MT5 applies fixed rules and removes the manual drawing work. It automates the annotation, not the judgement — the decisions and the risk remain yours.
Ready to put this into practice?
Open an account with a regulated broker and apply what you have learned. These are the three brokers we recommend:
Trading forex and CFDs carries a significant risk of loss and is not suitable for everyone. Broker links are affiliate links — we may earn a commission at no cost to you.