

Last updated:
A liquidity sweep is when price pushes briefly beyond an obvious level where stop orders cluster — just above equal highs or a swing high, or just below equal lows or a swing low — triggers those resting orders, then sharply reverses. The reversal is what confirms it. A clean break that keeps going is a breakout, not a sweep.
That distinction matters more than any other idea in this article. Traders lose money chasing “sweeps” that were actually genuine breakouts, and they lose money fading breakouts they mistook for sweeps. The mechanics are simple; the discretion required to read them in real time is not.
This guide explains what the “liquidity” actually is, how to spot a sweep versus a breakout, how traders structure an entry around one, and where the framework quietly fails. It sits inside the broader Smart Money Concepts vocabulary, so a few terms cross-reference other pages in this cluster.
What a liquidity sweep actually is
Every resting order in the market is liquidity for someone else. When you place a stop-loss, you are pre-committing to a market order that fires automatically once price reaches your stop. Thousands of traders place stops in the same obvious places, so those places become dense pools of pending orders.
Two pools matter most:
- Buy-side liquidity sits above a swing high or a run of equal highs. It is made of buy stops — the stop-losses of short sellers, plus breakout buy orders. Price trading up into that zone triggers a wave of buying.
- Sell-side liquidity sits below a swing low or equal lows. It is made of sell stops — the stop-losses of longs, plus breakout sell orders. Price trading down into that zone triggers a wave of selling.
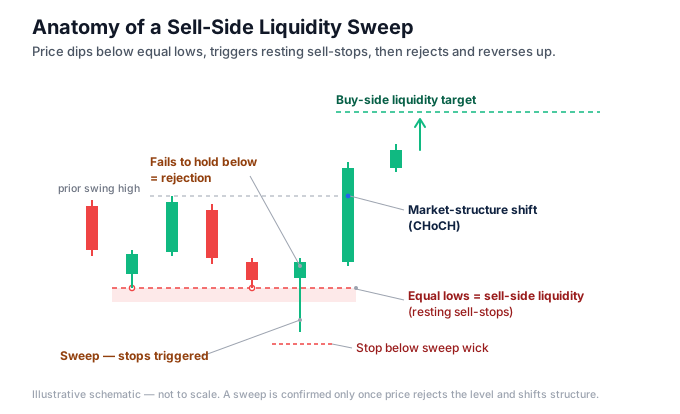
A sweep happens when price reaches into one of those pools, sets off the orders, and then reverses instead of continuing, leaving the traders who provided that exit liquidity on the wrong side. The reversal is the whole point. If price runs the buy stops above a high and then keeps climbing, that is a breakout with follow-through — the orders it triggered were fuel for continuation. If price runs those same stops and then drops back below the high, the move up was a sweep: liquidity was collected and the real move went the other way.
A useful mental model without the conspiracy framing: obvious levels attract obvious stops, and price is drawn to areas of dense pending orders because that is where large orders can be filled with less slippage. You do not need to believe a cartel is personally hunting your stop-loss. You only need to accept that stops cluster in predictable places and that price frequently reaches those places before turning.
This is closely related to ordinary support and resistance. The difference is emphasis. Classic technical analysis treats a level as a wall price bounces off. The liquidity lens treats the level as a magnet — price is expected to poke through it, grab the orders resting just beyond, and only then reverse. The false break is the feature, not the exception.
Sweep, stop hunt, liquidity grab — same thing
You will see three names for this. “Stop hunt” and “liquidity grab” are the same event as a liquidity sweep, described with different flavour. They all mean: price exceeded an obvious level, triggered the orders parked there, and reversed. Use whichever term you like, but be aware the aggressive “hunt” language leads people to over-personalise a structural pattern.
How to spot a liquidity sweep
Spotting a sweep is a two-step judgement: identify where liquidity rests, then wait for proof that it was taken and rejected. Skipping the second step is the single most common error.
1. Mark the obvious liquidity. Look for swing highs and swing lows that stand out, and especially for equal highs and equal lows — two or more peaks or troughs at nearly the same price. Equal levels are the strongest liquidity magnets because they look like clean, defendable levels to the whole market, so stops pile up just beyond them. Session highs and lows, the prior day’s high and low, and round numbers behave the same way.
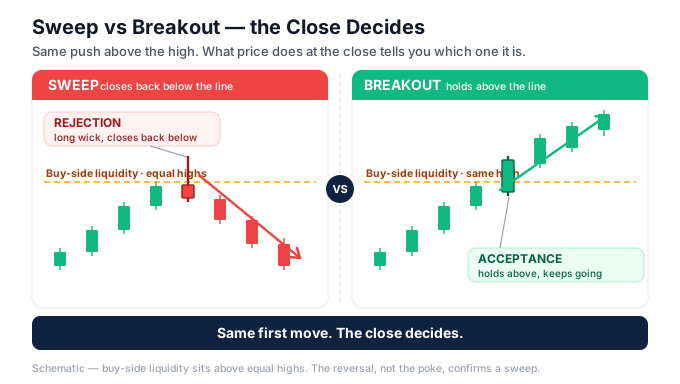
2. Wait for the wick and the reversal. A textbook sweep leaves a long wick that pierces the level and closes back inside it. On a candle chart you often see a single bar spike through the equal highs, trigger the stops, and close near where it opened — a rejection. Continuation the other way then confirms the sweep.
The confirmation you are waiting for is usually a shift in market structure. After a sweep of sell-side liquidity below a low, you want to see price break the most recent minor swing high — a change of character that says buyers have taken control. The relationship between a genuine trend break and a mere character shift is worth understanding on its own; see break of structure versus change of character for that distinction, because reading it wrong is where most fake entries come from.
Signs that lean towards a real sweep:
- Price closes back inside the range after piercing the level (rejection wick).
- The move beyond the level is sharp and shallow, not a slow grind.
- A structure shift follows promptly in the opposite direction.
- The sweep happens into a higher-timeframe level of interest, such as a prior day high or an order block.
Signs it is a breakout, not a sweep:
- Price closes decisively beyond the level and holds there.
- Follow-through candles keep pushing in the breakout direction.
- The level breaks on rising momentum with no rejection wick.
- Higher timeframe structure supports continuation, not reversal.
There is no indicator reading that tells you which one you are in before it resolves. That uncertainty is real and does not go away with experience — it only shrinks. Anyone selling you certainty here is selling you something that does not exist.
How to trade a liquidity sweep — a worked example
Here is a concrete, illustrative walk-through on EUR/USD. Treat the numbers as an example of the structure, not a recommendation or a prediction.
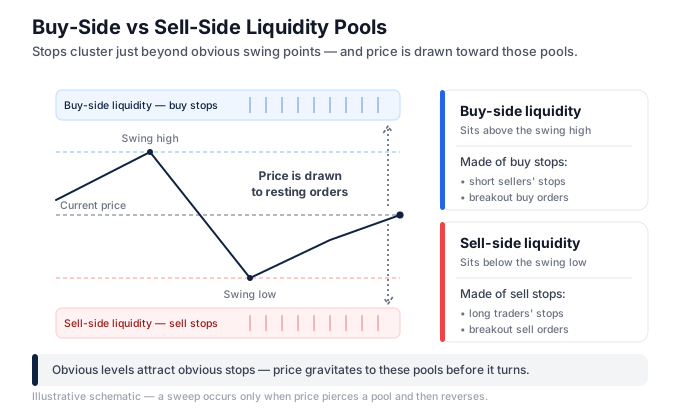
Context. On the 15-minute chart, EUR/USD has printed two swing lows at almost exactly 1.0840 and 1.0841 — equal lows. Sell-side liquidity is resting just beneath, roughly 1.0835 to 1.0839, where the stops of everyone long from that support are parked, along with breakout sell orders.
The sweep. Price drifts down and spikes to 1.0832, piercing both equal lows by a handful of pips. The stops fire — a burst of selling — and the candle immediately reverses, closing back at 1.0844, above the swept lows. That rejection wick is the tell.
Confirmation. On the next few candles price pushes up and breaks the last minor swing high at 1.0858. That structure shift is the confirmation that the sweep was a reversal, not a pause.
Entry, stop, target. A trader working this setup might enter long on a retracement back toward the swept level, say near 1.0848, rather than chasing the break. The stop goes below the sweep wick — below 1.0832, at perhaps 1.0828 — because if price trades back beneath the low that took the liquidity, the idea is invalidated. Note that stops sitting just under an obvious wick are themselves liquidity, so allow a sensible buffer and expect slippage on volatile spikes. A first target might be a nearby pool of buy-side liquidity above the equal highs that capped the prior range, giving a defined reward against a defined risk.
Risk. With entry 1.0848, stop 1.0828 and a target at, say, 1.0888, the risk is 20 pips and the reward 40 — roughly 1:2. Position size is set from the account-risk percentage and that 20-pip stop, using a position size calculator rather than a round-lot guess. If the trade is wrong, it is wrong for a cheap, pre-defined amount. Getting the order types right — a limit for the retracement entry, a hard stop for protection — is part of executing this cleanly.
The example resolves neatly because it is an example. In live markets many sweeps fail: price sweeps the low, shifts structure, you enter long, and then it sweeps a lower low and stops you out. That is normal. The framework does not remove losing trades; it gives you a repeatable structure with a logical invalidation point, which is a different and more modest claim than “it works.”
Common mistakes
Calling a sweep before the reversal. The reversal defines the sweep. Entering the instant price passes a level, betting it will reverse, is just fading a break on hope. Wait for the close back inside and the structure shift. Yes, you will get a worse entry price. You will also filter out most breakouts that would have run you over.
Ignoring the higher timeframe. A sweep on the 5-minute chart in the direction of a strong daily downtrend is far less reliable than a sweep that aligns with the higher-timeframe bias. Sweeps counter to the dominant trend fail more often. Read the bigger picture first.
Stops too tight, right under the wick. The area just beyond the sweep is exactly where the next pool of stops sits. Placing your stop one pip under the wick invites a second sweep that takes you out before the move resolves. Give it structural room, and size down to keep the money risk constant.
Over-personalising it. No one is hunting your individual stop. Price gravitates to dense order pools for structural reasons. The “the banks are coming for me” frame breeds revenge trading and oversized bets. Keep it mechanical.
Treating it as a standalone system. A liquidity sweep is one input. Without a trend read, a structure read, and hard risk control, spotting sweeps will not make you profitable. It is a piece of a discretionary framework, not an edge on its own — see how it fits the wider SMC framework. Most retail traders lose money, and adding a fashionable pattern does not change that on its own — see the wider list of beginner forex mistakes for the errors that actually drain accounts.
How indicators automate liquidity detection
Marking every swing high, swing low, and set of equal highs and lows by hand across multiple pairs and timeframes is slow and error-prone. This is where tooling earns its place — not by predicting sweeps, but by keeping the map current.
A dedicated tool such as the Liquidity Sweep Indicator for MT4 plots the resting liquidity pools and flags the moment price pierces and rejects a level, so you are not squinting at wicks. On MetaTrader 5, the Liquidity Indicator for MT5 does the equivalent, drawing buy-side and sell-side pools and highlighting equal highs and lows automatically. Traders who work the broader framework often run a Smart Money Concepts indicator alongside it to combine liquidity with structure and order blocks on one chart.
Be clear about what these do and do not do. An indicator can mark where liquidity rests and alert you when a level is swept. It cannot tell you in advance whether a given poke is a sweep or the start of a breakout — that resolves only after the fact, and the judgement stays yours. Used well, the tool removes the tedious cartography and lets you spend attention on the read. Used badly, it becomes a signal to obey blindly, and blind obedience to any arrow is a reliable way to lose money. The indicator is a map, not a decision.
Frequently asked questions
Is a liquidity sweep the same as a stop hunt?
Yes. “Stop hunt” and “liquidity grab” are informal names for the same event: price pushes past an obvious level, triggers the stop and pending orders resting there, and then reverses. “Liquidity sweep” is the neutral term for it. The aggressive “hunt” language can mislead you into thinking your individual stop is being targeted; it is not — stops simply cluster in predictable places.
How do I tell a liquidity sweep from a real breakout?
You cannot know for certain in advance — that is the honest answer. A sweep pierces the level and closes back inside it, usually leaving a rejection wick, then shifts structure the other way. A breakout closes decisively beyond the level and keeps going with follow-through. Wait for the candle to close and for a structure shift before treating a move as a sweep rather than a break.
Where does liquidity rest on a chart?
Just beyond obvious levels. Buy-side liquidity sits above swing highs and equal highs; sell-side liquidity sits below swing lows and equal lows. Session highs and lows, the previous day’s high and low, and round numbers act the same way. Equal highs and equal lows are the strongest magnets because the whole market sees them as clean levels and stacks stops just past them.
Can a liquidity sweep be traded profitably?
It can be part of a profitable discretionary approach, but it is not an edge on its own and it guarantees nothing. A sweep only becomes tradeable with a higher-timeframe bias, a confirmed structure shift, a logical invalidation point, and strict position sizing. Many sweeps fail. Most retail traders lose money overall, and adding this pattern does not change that unless the risk management around it is sound.
What timeframe is best for spotting liquidity sweeps?
Sweeps appear on every timeframe, from the 1-minute to the daily. A common approach is to read bias and major liquidity on a higher timeframe — the 1-hour or 4-hour — then drop to a lower timeframe such as the 5- or 15-minute to time the entry after a sweep. Lower timeframes give more signals but more noise and more false sweeps.
Do I need an indicator to trade liquidity sweeps?
No. Everything a liquidity indicator draws — swing points, equal highs and lows, the sweep wick — can be marked by hand. A tool such as a fair value gap indicator or a liquidity indicator simply keeps that map current across pairs and timeframes and alerts you to a pierce, which saves time and reduces missed levels. It does not decide the trade for you or predict whether a poke will reverse.
Risk warning: Trading forex and CFDs carries a high risk of loss and is not suitable for everyone. Most retail traders lose money. Nothing here is financial advice; the worked example is illustrative and not a prediction. Practise on a demo account and never risk money you cannot afford to lose.
Ready to put this into practice?
Open an account with a regulated broker and apply what you have learned. These are the three brokers we recommend:
Trading forex and CFDs carries a significant risk of loss and is not suitable for everyone. Broker links are affiliate links — we may earn a commission at no cost to you.