

Inducement (IDM) is a deliberate-looking minor swing high or low sitting just in front of the real point of interest in Smart Money Concepts trading. It baits traders into entering early or resting stops at an obvious level; price sweeps that liquidity first, then reacts from the genuine order block. It is discretionary, not a guaranteed signal.
What inducement actually is
In Smart Money Concepts (SMC) and Inner Circle Trader (ICT) trading, inducement — often shortened to IDM — is the obvious level placed just before the level that actually matters. It is the tidy support or resistance that looks like a safe early entry, sitting between current price and your real target zone. Because it looks safe, traders pile in there and rest their stop-losses around it. Those stops are resting liquidity. Price runs through the inducement to collect that liquidity, then reacts from the genuine order block or fair value gap behind it.
The single most important thing to understand is this: inducement is defined only relative to a point of interest (POI). You cannot spot it in isolation. First you mark a zone you already expect price to react from — a higher-timeframe order block or fair value gap. Only then does inducement have any meaning. It is the obvious liquidity that sits in front of that real zone and must be taken first. Marked without a POI, an “inducement” is just a swing you circled after the fact.
It also helps to separate inducement from its neighbour. Inducement is the bait — the obvious level that gathers stops before the real zone. The liquidity sweep (or grab) is the act of price trading through that level to take those stops. They are sequential, not synonyms. Inducement forms first; the sweep is what happens to it. Confuse the two and the whole sequence stops making sense.
Be honest about what this is and is not. Inducement is a discretionary retail interpretation of order flow — a way of reading where stops probably sit — not a documented description of how banks operate, and not a guaranteed edge. It belongs to the same discretionary family as order blocks, liquidity, and killzones under the wider Smart Money Concepts framework. Used as a structuring lens it can sharpen how you read a chart. Sold as a signal that “the banks are coming,” it is marketing.
How to spot inducement on a chart
Spotting inducement is a sequence, not a single glance. Work through it in order.
Start from your point of interest. Mark the higher-timeframe order block or fair value gap you expect price to react from before you look for inducement. If you skip this step you will retro-fit an inducement onto whatever swing later reversed, and convince yourself you predicted it.
Find the most obvious minor swing between price and that POI. Look in the gap between where price is now and your zone. The inducement candidate is the level a typical trader would treat as support or resistance, or as their entry. The test is deliberately crude: if everyone can see it, it qualifies. Obviousness is the whole point — an inducement that nobody would trade collects no stops.
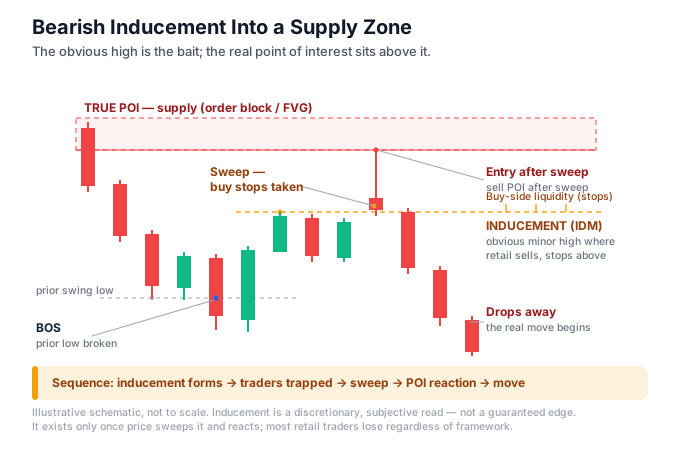
Apply the directional rule. In an uptrend, the inducement is usually the last minor swing low before the bullish POI — the first pullback low after a break of structure. In a downtrend, it is the last minor swing high before the bearish POI. This is the canonical pattern: the first valid pullback inside a leg is treated as the trap, not the entry.
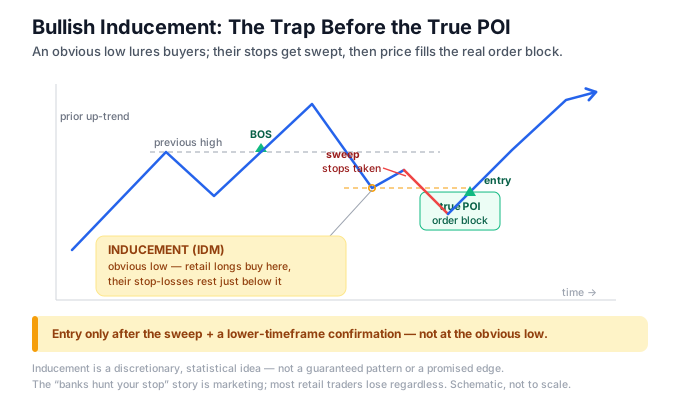
Run the proximity test. The inducement must be close enough to the POI that a single impulse can both sweep the level and reach the zone. If sweeping the level still leaves price far from your POI, it is more likely an intermediate structural target than genuine inducement. Distance breaks the mechanism — the move that grabs the stops should be the same move that delivers price to the zone.
Read the character of the move into it. Weak, choppy, slowing price that manufactures a neat little swing high or low often marks inducement. It looks like a “safe” early entry precisely because the move that built it was lazy. A clean, obvious level formed on tired price is exactly the shape the concept is describing.
Accept that it is confirmed only in hindsight. A genuine inducement is one that price sweeps on its way to the POI and then reverses from the POI. Until that full sequence happens, what you have is a candidate, not a fact. Say so to yourself. You are labelling probabilistically, and the honest trader holds that label loosely.
How to trade inducement — with a worked example
The rules for using inducement are mostly rules about what not to do.
Do not enter at the inducement itself. This is the entire concept. The obvious level is the trap; entering there is exactly the behaviour that provides the liquidity for the real move. The most-repeated ICT rule of thumb captures it: never take the first pullback after a break of structure — that is the inducement, not the entry.
Wait for the sweep. Price must trade through the inducement — dip below the inducement low in a bullish setup, spike above the inducement high in a bearish one — and take those resting stops before you do anything.
Wait for a reaction at the true POI. After the sweep, look for price to tap your higher-timeframe order block or FVG and show something: a lower-timeframe shift in structure (a change of character), a fresh order block, or a fair value gap forming in your intended direction. If you are unsure how a break of structure differs from a change of character, the distinction between BOS and CHoCH is worth getting straight before you rely on it here.
Enter on the post-sweep confirmation, not on hope. A typical entry is a retest of the price delivery array — the order block or FVG that forms after the sweep — in the higher-timeframe direction.
Place the stop beyond the invalidation point. That means past the swept extreme or the far side of the POI, not at a random tight distance. If price reclaims the level, your read was simply wrong; accept the loss and move on.
Target the next real liquidity pool. Aim at an opposing swing high or low, an old high or low, or a session extreme, and consider taking partials — the “expected” move frequently underdelivers.
A concrete example
Say EUR/USD is in an uptrend on the 1-hour chart. Price breaks structure above a previous swing high, confirming bullish intent, then pulls back. You have already marked a 1-hour bullish order block below, at 1.0850–1.0845, as your POI. On the pullback, the first minor swing low prints at 1.0870 — clean, obvious, the level every breakout trader would buy and rest stops beneath. That is your inducement candidate. It passes the proximity test: a single push down can sweep 1.0870 and reach 1.0845.
You do nothing at 1.0870. Price dips to 1.0868, taking the stops below the inducement low, and trades into the order block at 1.0847. On the 5-minute chart you see price reject the zone and print a change of character to the upside. You enter on the retest of the 5-minute order block that formed inside the sweep, at around 1.0852, with a stop at 1.0838 — below the swept low and the far side of the POI. Your target is the old high that sits above, a genuine liquidity pool. If price instead closes back below 1.0838, the read is invalidated and you are out for a defined, small loss.
Notice what did the work: waiting. The trader who bought the obvious 1.0870 pullback was the liquidity. The trader who waited for that liquidity to be taken got a defined-risk entry from the real zone. If you would rather have the candidate levels flagged automatically while you learn the pattern, the inducement indicator for MT4 marks obvious pre-POI liquidity on the chart — but treat it as a prompt to check the sequence yourself, never as a signal to click.
Common mistakes
Treating the obvious level as the entry. If a level looks like a clean, safe entry, that is precisely why it is suspect. Trading it puts your stop in the pile of liquidity the next move is aiming at.
Believing the banks are hunting your stop. No institution knows or cares about your individual order. Price gravitates toward clustered resting liquidity because that is where enough volume exists to fill large positions — a structural tendency, not a personal conspiracy. The “smart money is coming for your stop” narrative is marketing. The real, unglamorous version of “smart money” is simply large participants who need liquidity to transact; understanding that is more useful than the drama.
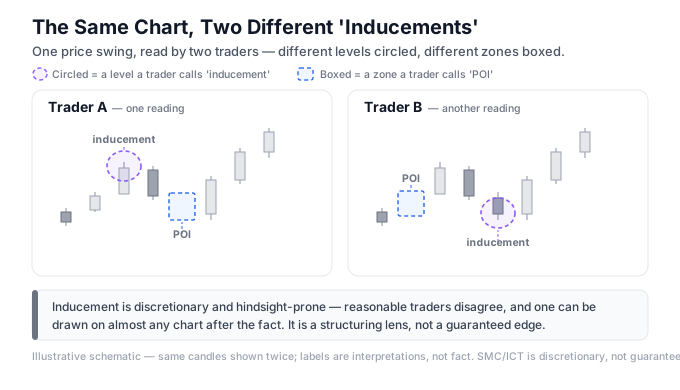
Marking inducement after the fact and calling it predictive. Because the label is subjective, you can retro-fit one onto almost any reversal. A concept you can only confirm in hindsight is a description, not a reliable forecast. If you find yourself circling the inducement after the move, you learned nothing about the next trade.
Ignoring the proximity test. Labelling a swing far from the POI as inducement, when it is really just an intermediate structural level or target, breaks the mechanism and leads to entries with no logic behind the stop.
Confusing the terms. Inducement is the bait placed before the sweep; the liquidity grab is the act of taking those stops. Sequential, not the same word for one thing.
Over-tightening or over-widening the stop. Placing your stop right behind the obvious level is the retail behaviour being exploited. Placing it randomly far away breaks your risk maths. Stops belong at genuine invalidation — no closer, no further.
Forcing the setup in the wrong conditions. In low-liquidity or news-driven windows, “sweeps” are often just noise. Traders force the pattern, get stopped, and blame the concept. Session timing matters — knowing when the forex sessions overlap tells you when liquidity is real enough for the idea to mean anything.
How inducement fits the wider SMC framework
Inducement is one gear in a larger machine. The standard SMC sequence runs: inducement (bait) forms → traders enter and rest stops → price sweeps the inducement (liquidity grab) → price taps the true POI → the reaction and move begin. Order blocks, fair value gaps, liquidity pools, and killzones all describe pieces of that same order-flow story. If you are building the picture from scratch, start with the Smart Money Concepts guide and read inducement as the piece that explains why price so often overshoots an obvious level before turning.
Timing sits alongside it. ICT killzones are the windows when many ICT traders expect liquidity to be engineered and taken. In the canonical Trader Theory version, quoted in New York local time (US Eastern — EST in winter, EDT in summer), the London Killzone runs 02:00–05:00, the New York AM Killzone 07:00–10:00, the London Close Killzone 10:00–12:00, and the Asian Killzone 20:00–00:00. These windows vary between sources — some cite a New York window of 08:00–11:00 or an Asian window of 19:00–21:00 — so treat them as convention, not fixed law.
And here is the caveat you must carry through all of it. There is no robust, independently published statistical edge for inducement. It is subjective and hindsight-prone: two competent traders will mark different levels on the same chart, and you can find an inducement on almost any chart after the fact. The majority of retail forex traders lose money irrespective of the strategy they use, and no entry technique changes that. Treat inducement as a structuring lens for reading liquidity — not a guaranteed edge — and protect yourself with the only thing that reliably works: risk control. Never risk more than a small, fixed percentage per trade, and build the rule into a written trading plan you actually follow.
Frequently asked questions
What is inducement (IDM) in Smart Money Concepts?
Inducement is a deliberate-looking minor swing high or low placed just before the real point of interest. It baits traders into entering early or resting stops at an obvious level. Those stops become liquidity: price sweeps the inducement first, then reacts from the genuine order block. It is a discretionary, subjective concept, not a guaranteed signal.
How do you identify inducement on a chart?
First mark your point of interest — a higher-timeframe order block or FVG. The inducement is the most obvious minor swing sitting between price and that POI, usually the first pullback after a break of structure, and close enough that one impulse can sweep it and reach the zone. It is only fully confirmed in hindsight, once price actually sweeps it.
What is the difference between inducement and a liquidity sweep?
They are sequential, not the same thing. Inducement is the bait — the obvious level that lures traders in and gathers their stops before the real zone. The liquidity sweep (or grab) is the act of price trading through that level to take those stops. Inducement forms first; the sweep is what happens to it.
Where do you enter after inducement in SMC trading?
Not at the inducement itself — that is the trap. You wait for price to sweep the inducement, then look for a reaction at your true point of interest: a lower-timeframe change of character, order block, or fair value gap forming after the sweep. Entry is on that post-sweep confirmation, with the stop placed beyond the swept invalidation point.
Is inducement a reliable trading strategy?
No. Inducement is one of the most subjective and hindsight-prone ideas in ICT — competent traders mark different levels on the same chart, and you can find one on almost any chart after the fact. It has no robust published statistical edge and works only as a discretionary structuring lens. Most retail traders lose money regardless of the method.
Do banks really hunt retail traders’ stop losses with inducement?
Not personally. No institution knows or targets your individual order. Price gravitates toward clustered resting stops because that is where enough volume exists to fill large orders — a structural tendency, not a conspiracy against you. The “smart money is coming for your stop” narrative is marketing; treat inducement as a way to read liquidity, not as magic.
Ready to put this into practice?
Open an account with a regulated broker and apply what you have learned. These are the three brokers we recommend:
Trading forex and CFDs carries a significant risk of loss and is not suitable for everyone. Broker links are affiliate links — we may earn a commission at no cost to you.