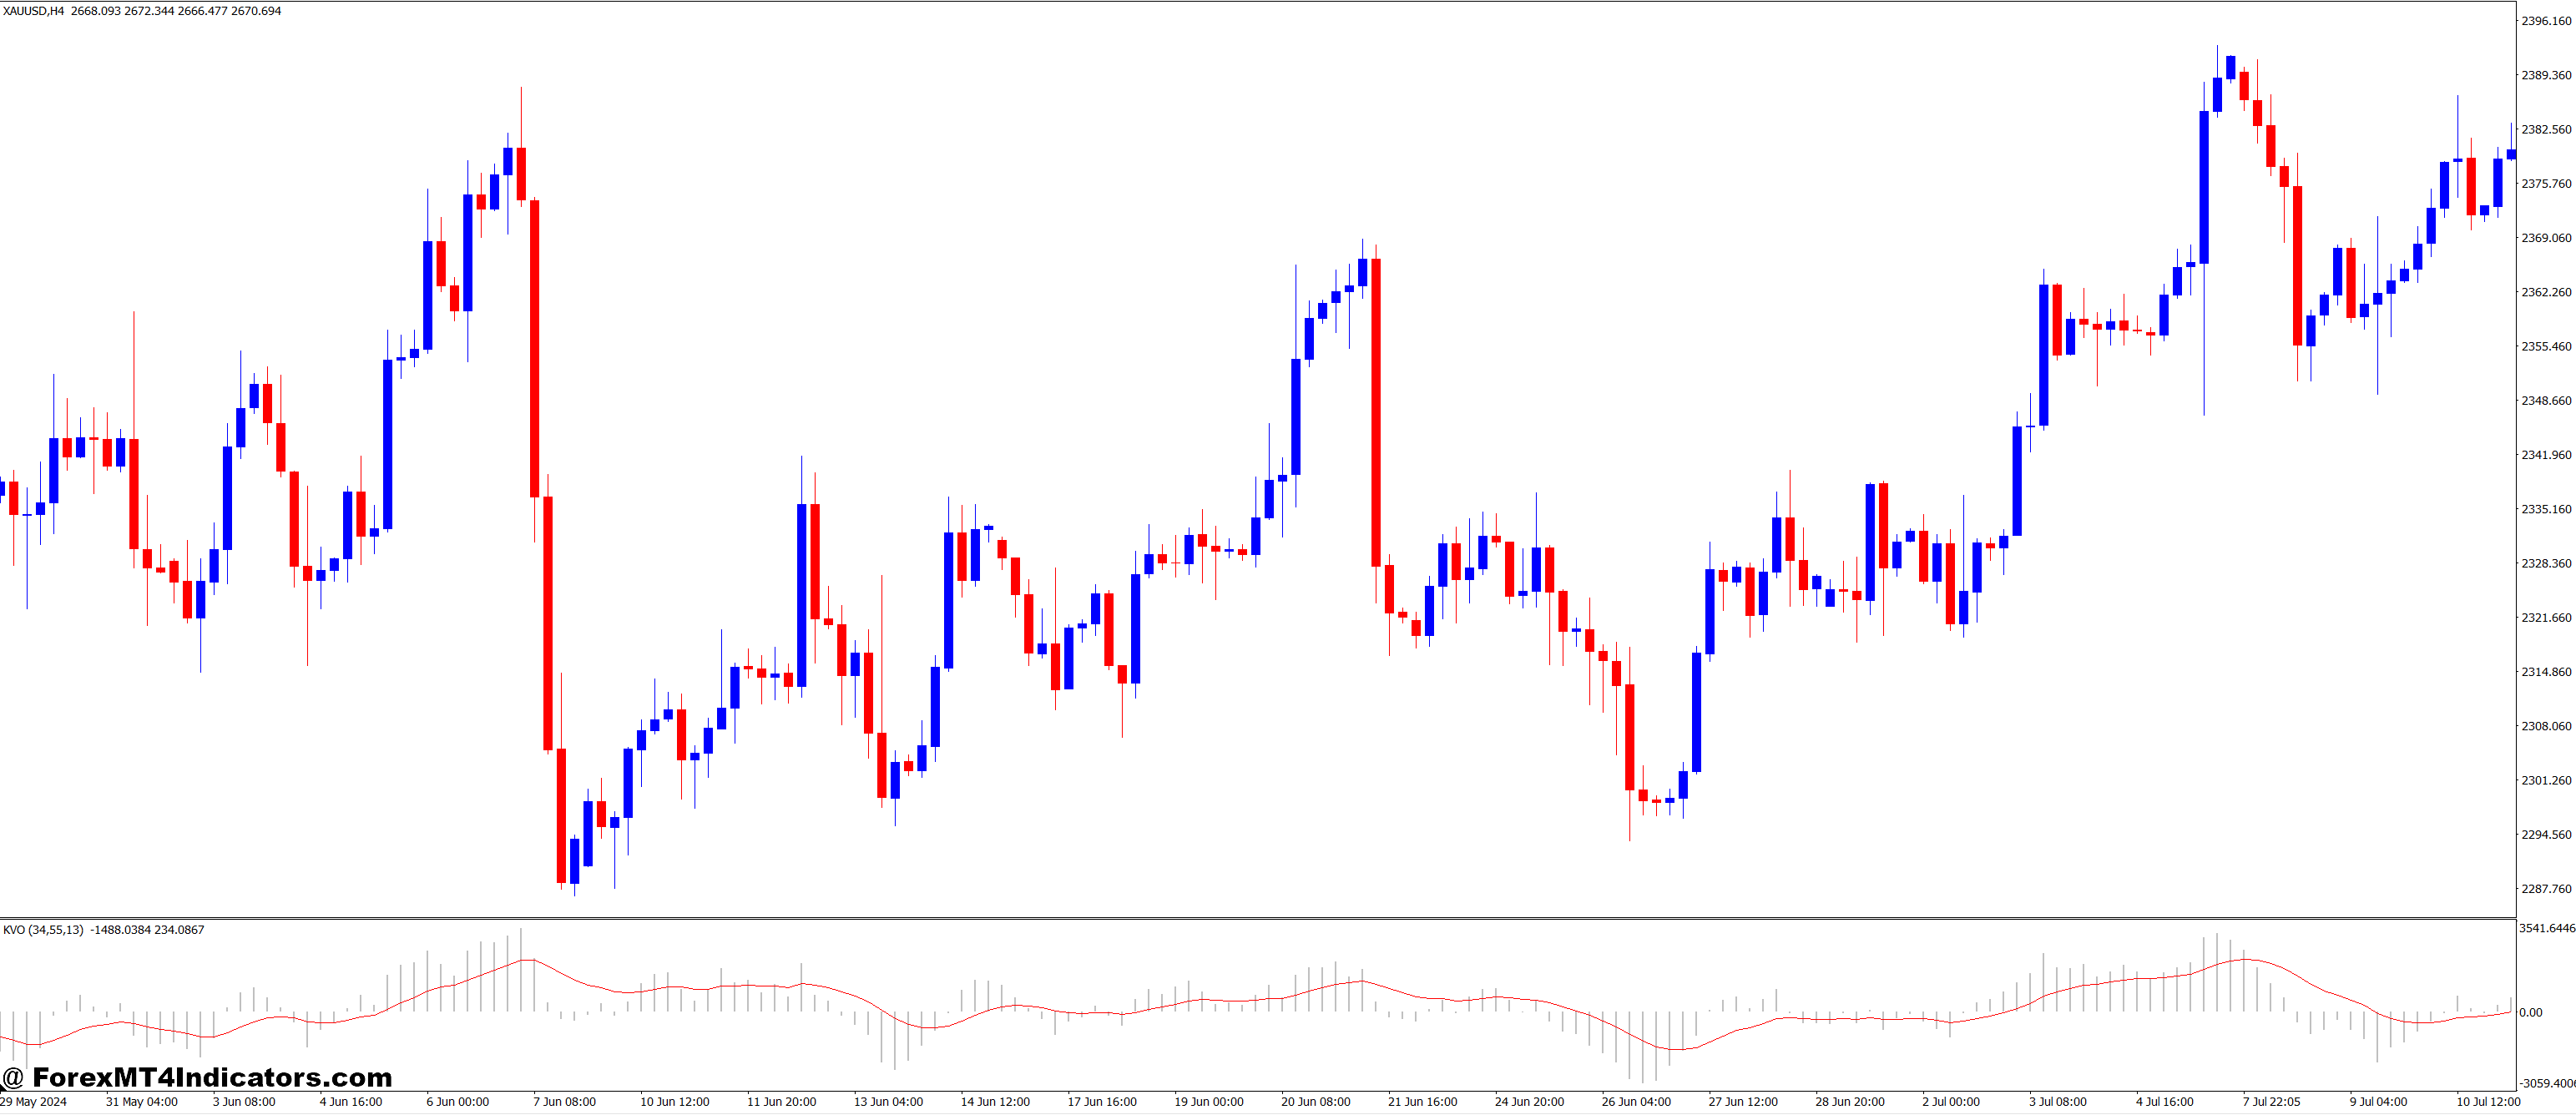
The Klinger Oscillator KVO MT4 Indicator steps in as a game-changer. It helps traders see when volume supports the trend or warns of a reversal. With this tool, they can make smarter decisions and avoid being caught off guard.
What Is the Klinger Oscillator KVO Indicator
The Klinger Oscillator, often called KVO, is a volume-based indicator that helps traders spot trend direction and momentum changes. It works by comparing the long-term and short-term movement of price and volume. In simple terms, it tells whether the “big money” is backing the current trend. On the MT4 platform, this indicator becomes even more useful by offering easy visualization directly on price charts. It’s ideal for swing traders, scalpers, or anyone who wants to get a clearer view of what’s happening behind the price action.
How Does It Work in MT4
The KVO MT4 Indicator calculates volume force and displays it as an oscillator line. When the KVO line crosses above its signal line, it may point to a bullish trend. When it crosses below, it could mean a bearish move is starting. These signals are based on volume pressure, not just price movement, making them more reliable in many cases. MT4 users can customize the settings, adjust smoothing periods, and even combine KVO with other tools like RSI or MACD for stronger confirmation.
Why It Matters for Everyday Traders
Many indicators focus only on price, which can be misleading during low volume or false breakouts. The Klinger Oscillator helps by adding volume context. This is especially useful during consolidation zones or just before big breakouts. Traders can use KVO to avoid getting trapped in false moves and wait for volume-backed trends. It adds a layer of confidence, helping traders see not just where the market is going, but whether it has the strength to stay there.
How to Trade with Klinger Oscillator KVO MT4 Indicator
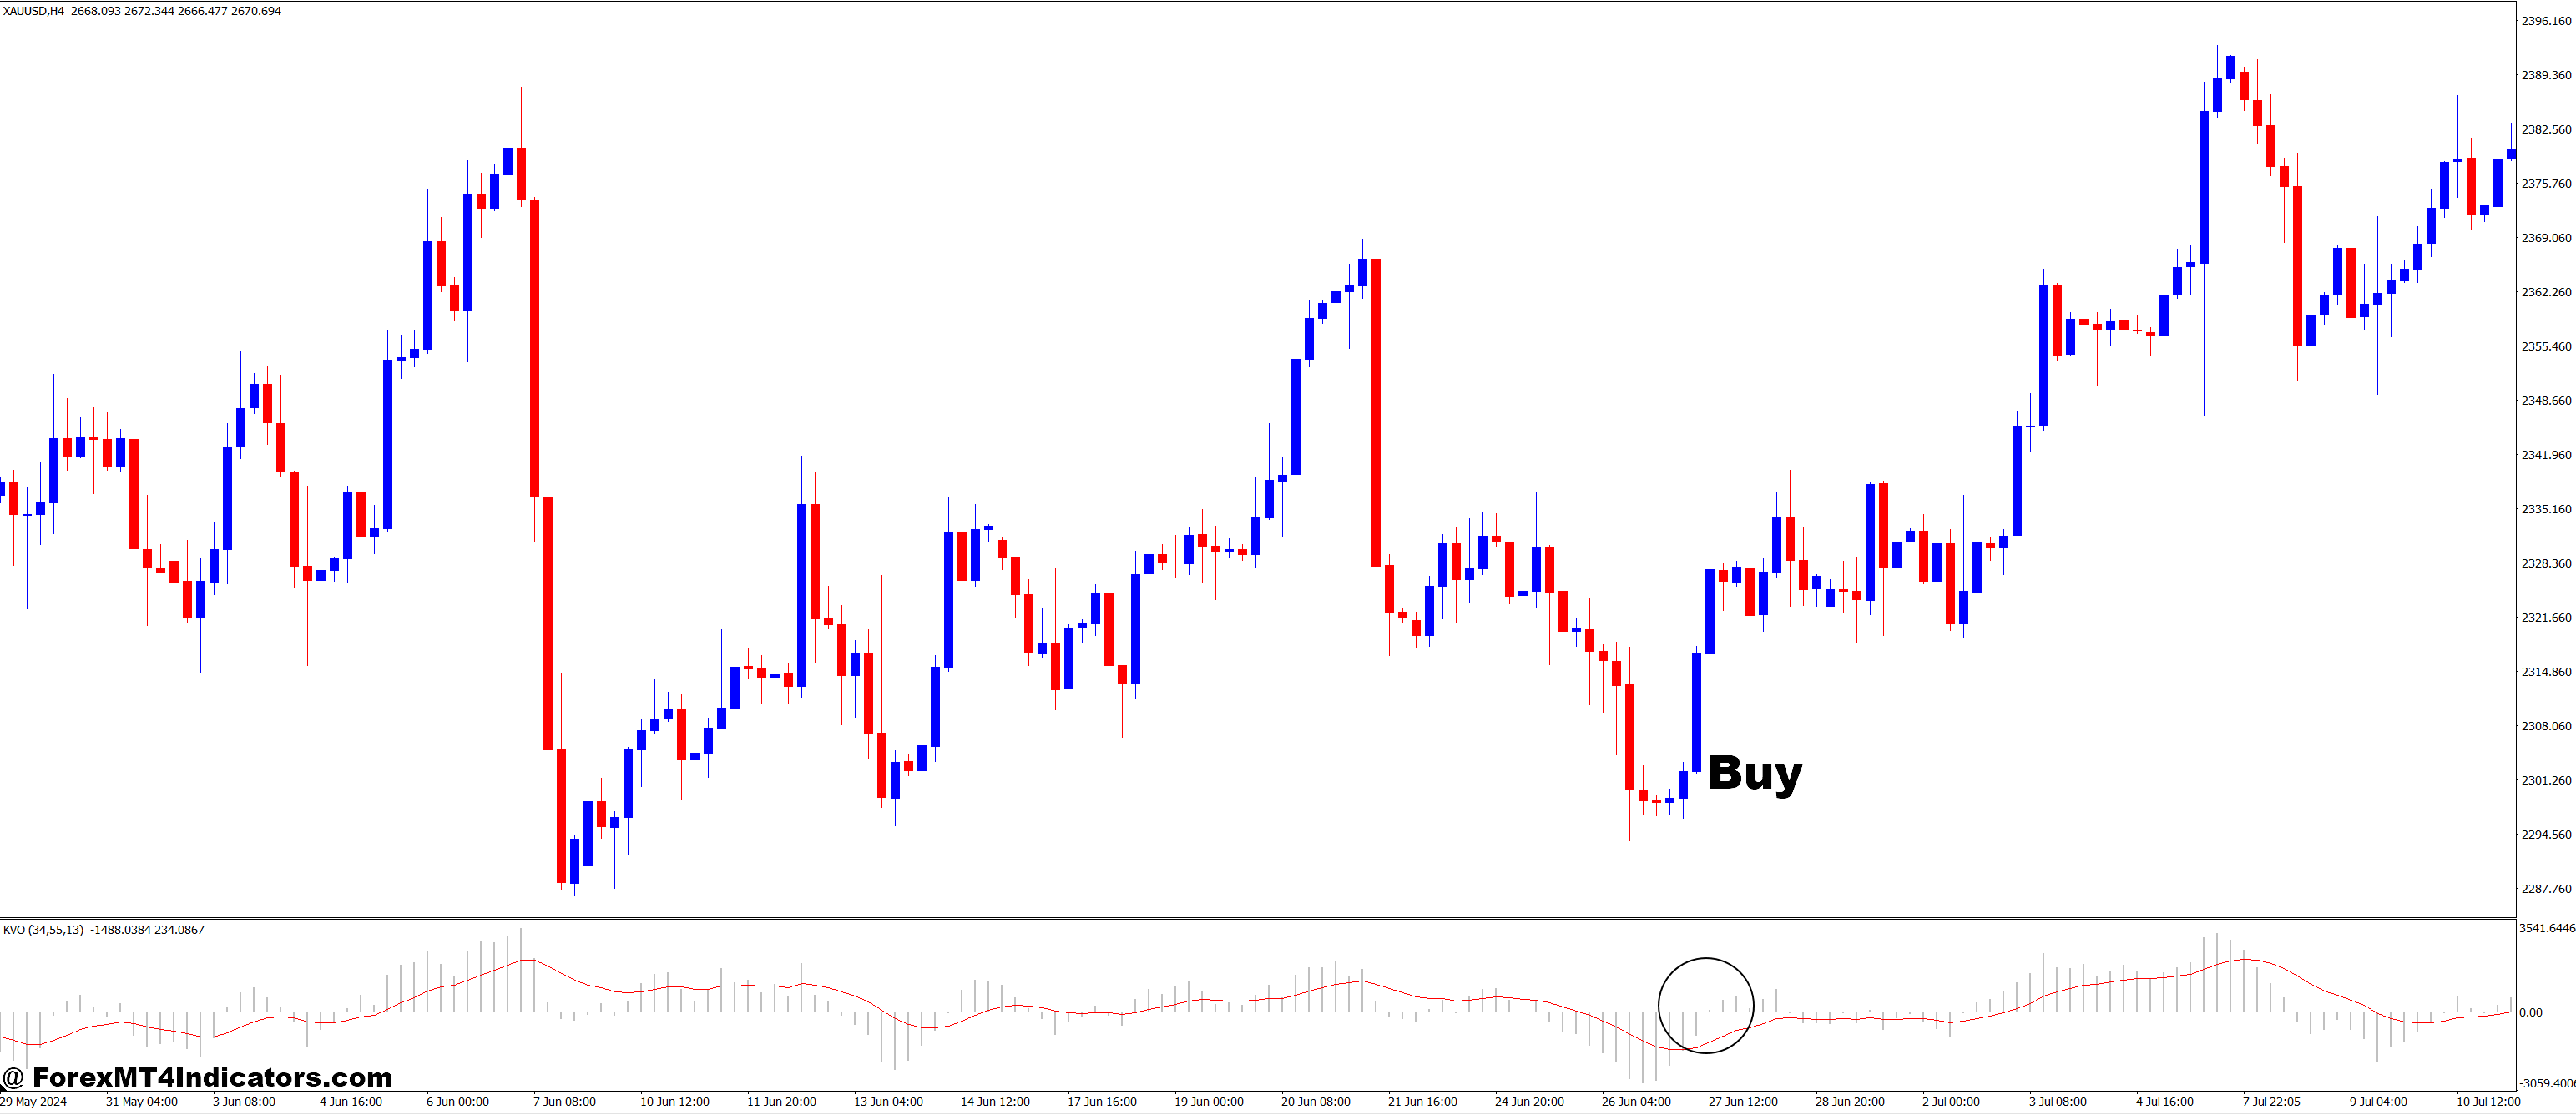
Buy Entry
- KVO line crosses above the signal line (usually a bullish sign).
- The KVO histogram moves from negative to positive territory.
- Price action confirms with higher lows or a bullish candlestick pattern.
- Optional: Confirm with a rising trend in volume or another supporting indicator (e.g., RSI above 50).
- Best used when price breaks above a key resistance level or trendline.
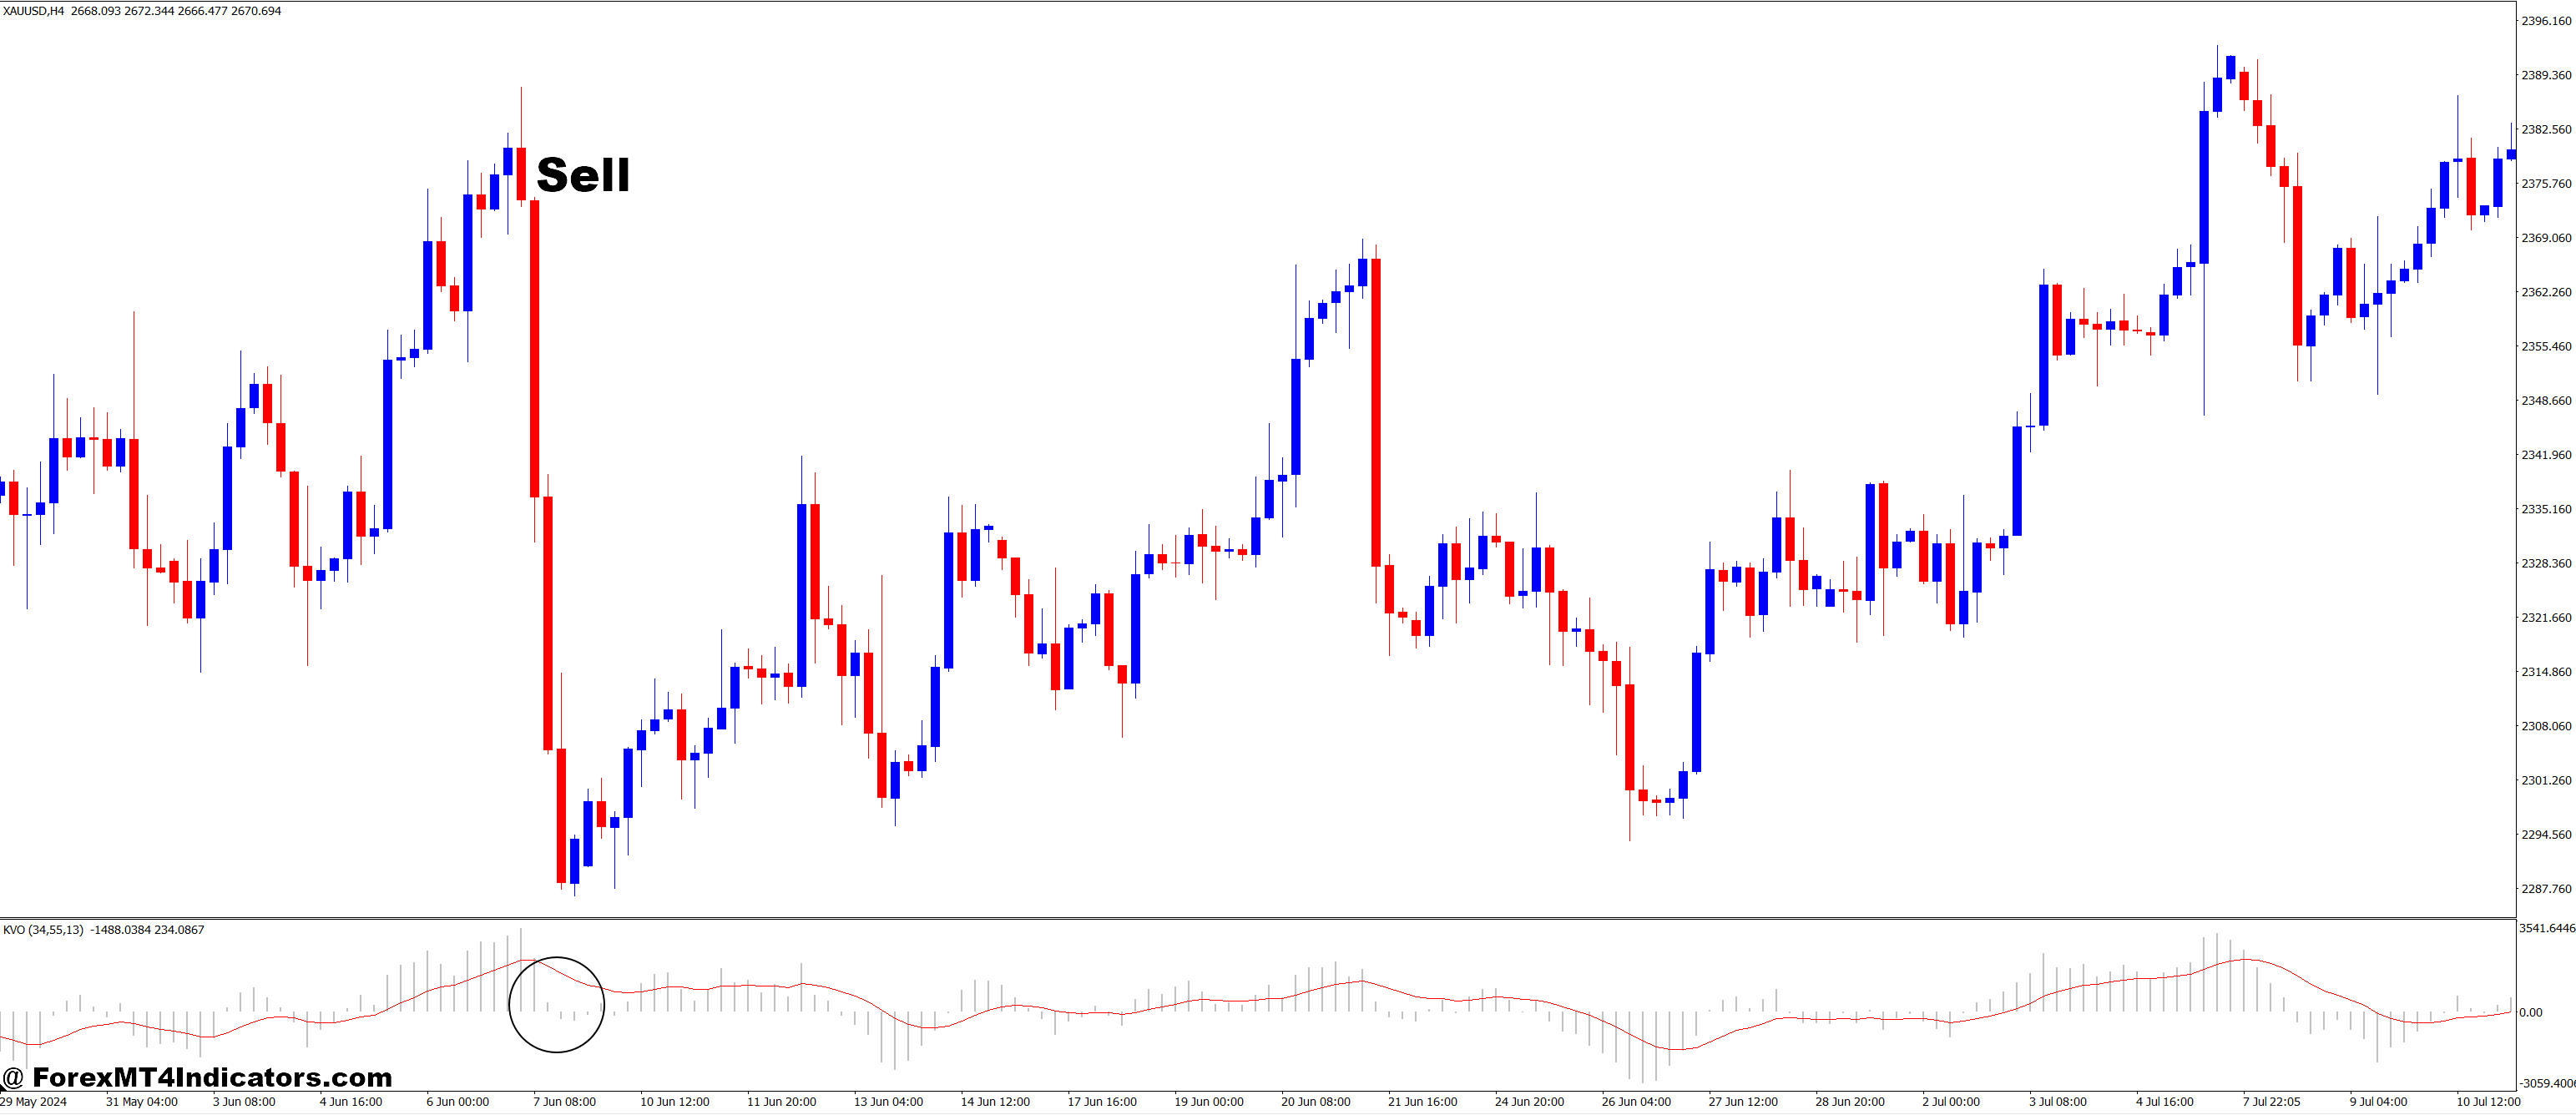
Sell Entry
- KVO line crosses below the signal line (often a bearish sign).
- The KVO histogram turns from positive to negative.
- Price action shows lower highs or a bearish candlestick pattern.
- Optional: Confirm with falling volume or other indicators (e.g., RSI below 50).
- Ideal during a trendline break or a support zone breakdown.
Conclusion
The Klinger Oscillator KVO MT4 Indicator offers a powerful way to bring volume analysis into your trading strategy. With its ability to highlight real momentum behind price moves, it helps traders avoid noise and focus on solid entries and exits. Whether used alone or with other tools, it’s a valuable addition to any MT4 setup aiming for smarter, more informed trading.
Recommended MT4/MT5 Broker
XM Broker
- Free $50 To Start Trading Instantly! (Withdraw-able Profit)
- Deposit Bonus up to $5,000
- Unlimited Loyalty Program
- Award Winning Forex Broker
- Additional Exclusive Bonuses Throughout The Year
- Exclusive 90% VIP Cash Rebates for all Trades!
Already an XM client but missing out on cashback? Open New Real Account and Enter this Partner Code: VIP90
(Free MT4 Indicators Download)

Enter Your Email Address below, download link will be sent to you.


