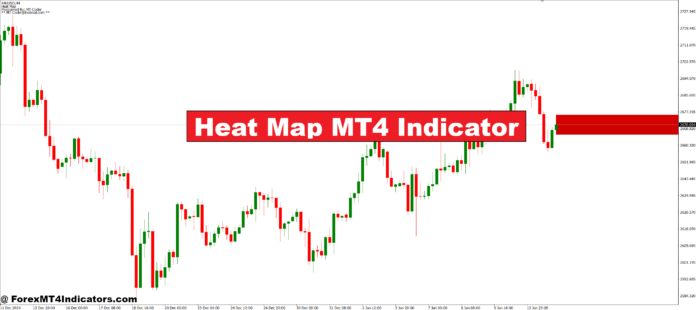
The Heat Map MT4 Indicator provides a visual representation of market strength across different currency pairs. It uses color intensity to show how strong or weak each currency is in real-time. Green shades often indicate strength, while red shades highlight weakness. This quick visual summary helps traders save time by removing the need to manually analyze multiple charts or timeframes.
Benefits of Using the Indicator
This indicator is especially useful for traders who rely on correlation and trend confirmation. It simplifies complex market data into easy-to-read visuals, making it perfect for beginners and professionals alike. By comparing multiple pairs, traders can easily identify trending markets and avoid sideways or low-volatility conditions. This improves trade timing and overall accuracy.
How It Enhances Trading Decisions
The Heat Map MT4 Indicator helps traders stay ahead by providing instant market clarity. Instead of guessing which pair is strong or weak, they can base their decisions on real data. For instance, if USD shows strong performance across multiple pairs while EUR weakens, traders can confidently look for USD-buy or EUR-sell setups. This makes trading more objective and less emotional.
Customization and Flexibility
One of the best features of this indicator is its flexibility. Traders can adjust color settings, timeframes, and update speeds to match their trading style. Whether someone trades short-term scalps or long-term swings, the Heat Map adapts easily. Its user-friendly interface ensures that even new traders can interpret results quickly without confusion.
How to Trade with Heat Map MT4 Indicator
Buy Entry
- Look for currencies highlighted in green, showing strong bullish momentum.
- Identify a currency pair where the base currency is strong (green) and the quote currency is weak (red).
- Confirm the trend direction on the price chart (preferably using moving averages or trendlines).
- Enter a buy trade when the pair aligns with the strength shown on the heat map.
- Place a stop loss below the most recent swing low or a key support level.
- Set a take profit target based on the next resistance zone or a favorable risk-to-reward ratio (1:2 or higher).
Sell Entry
- Look for currencies highlighted in red, indicating bearish strength.
- Choose a currency pair where the base currency is weak (red) and the quote currency is strong (green).
- Verify the downtrend on the chart to avoid false signals.
- Enter a sell trade once the price confirms downward momentum in line with the heat map reading.
- Place a stop loss above the recent swing high or resistance area.
- Set a take profit at the next support zone or according to your desired risk-to-reward ratio.
Conclusion
The Heat Map MT4 Indicator is a must-have tool for traders who want a clear view of market strength and currency movement. Turning raw data into simple visual cues helps reduce guesswork, improve entry timing, and increase trading confidence. With this indicator, traders can make smarter, faster, and more informed decisions in any market condition.
Recommended MT4/MT5 Broker
XM Broker
- Free $50 To Start Trading Instantly! (Withdraw-able Profit)
- Deposit Bonus up to $5,000
- Unlimited Loyalty Program
- Award Winning Forex Broker
- Additional Exclusive Bonuses Throughout The Year
- Exclusive 90% VIP Cash Rebates for all Trades!
Already an XM client but missing out on cashback? Open New Real Account and Enter this Partner Code: VIP90
(Free MT4 Indicators Download)

Enter Your Email Address below, download link will be sent to you.


