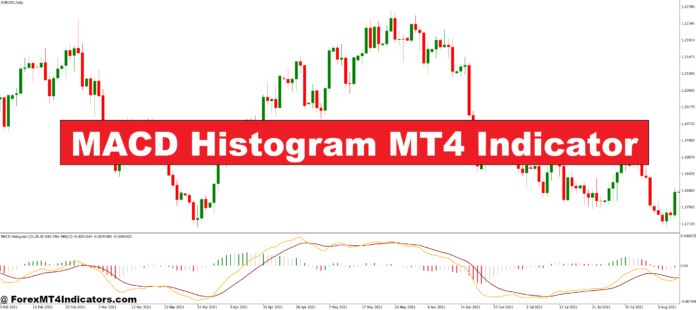
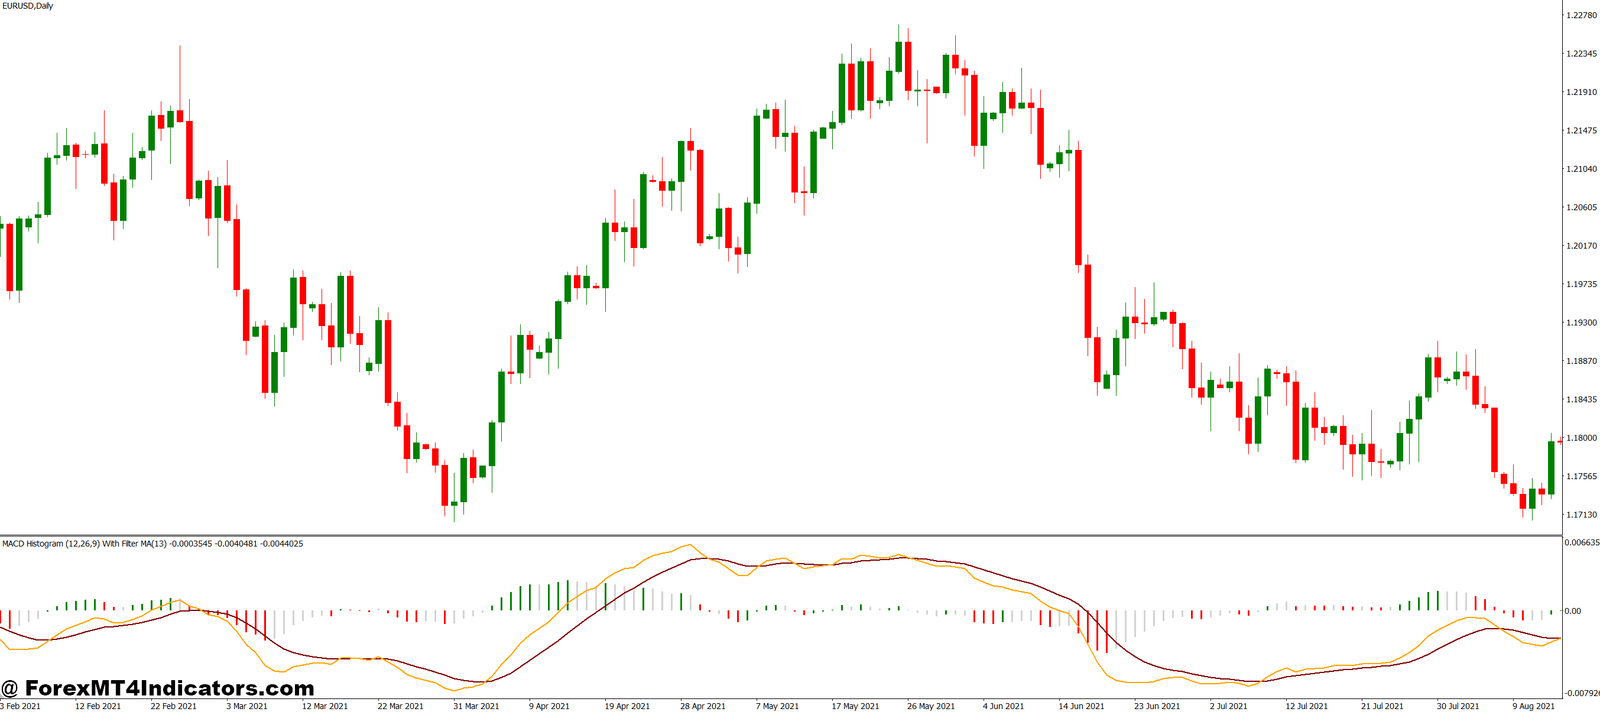
The MACD Histogram MT4 Indicator is a powerful momentum tool designed to show the relationship between two moving averages of a security’s price. It converts complex data into simple, visual bars that rise and fall based on market momentum. When the histogram bars increase, it signals strengthening momentum; when they decrease, it suggests weakness. Traders use this visual cue to anticipate potential trend reversals or continuations with greater accuracy.
Key Features and Benefits
This indicator allows traders to identify bullish and bearish signals without complex analysis. The histogram provides real-time updates as the market moves, making it suitable for both short-term and long-term trading strategies. It helps filter out market noise and provides a clear picture of price momentum. Many traders combine it with other tools like moving averages or RSI to confirm entries and exits. Its simplicity and effectiveness make it ideal for beginners and experienced traders alike.
How It Works on the MT4 Platform
Once installed on the MetaTrader 4 platform, the MACD Histogram appears below the main chart as a series of bars. When the bars rise above the zero line, it indicates bullish momentum; when they fall below, bearish momentum takes over. The higher the bars, the stronger the trend. Traders often look for histogram crossovers, where the bars switch sides, to identify early signals of trend changes.
Practical Trading Tips
Using the MACD Histogram MT4 Indicator effectively requires patience and observation. Traders should avoid making decisions based on a single bar and instead confirm the signal with price action or other indicators. Combining the MACD Histogram with support and resistance levels, or a trendline strategy, can help refine entries and exits. This approach minimizes false signals and enhances accuracy in real-market conditions.
How to Trade with MACD Histogram MT4 Indicator
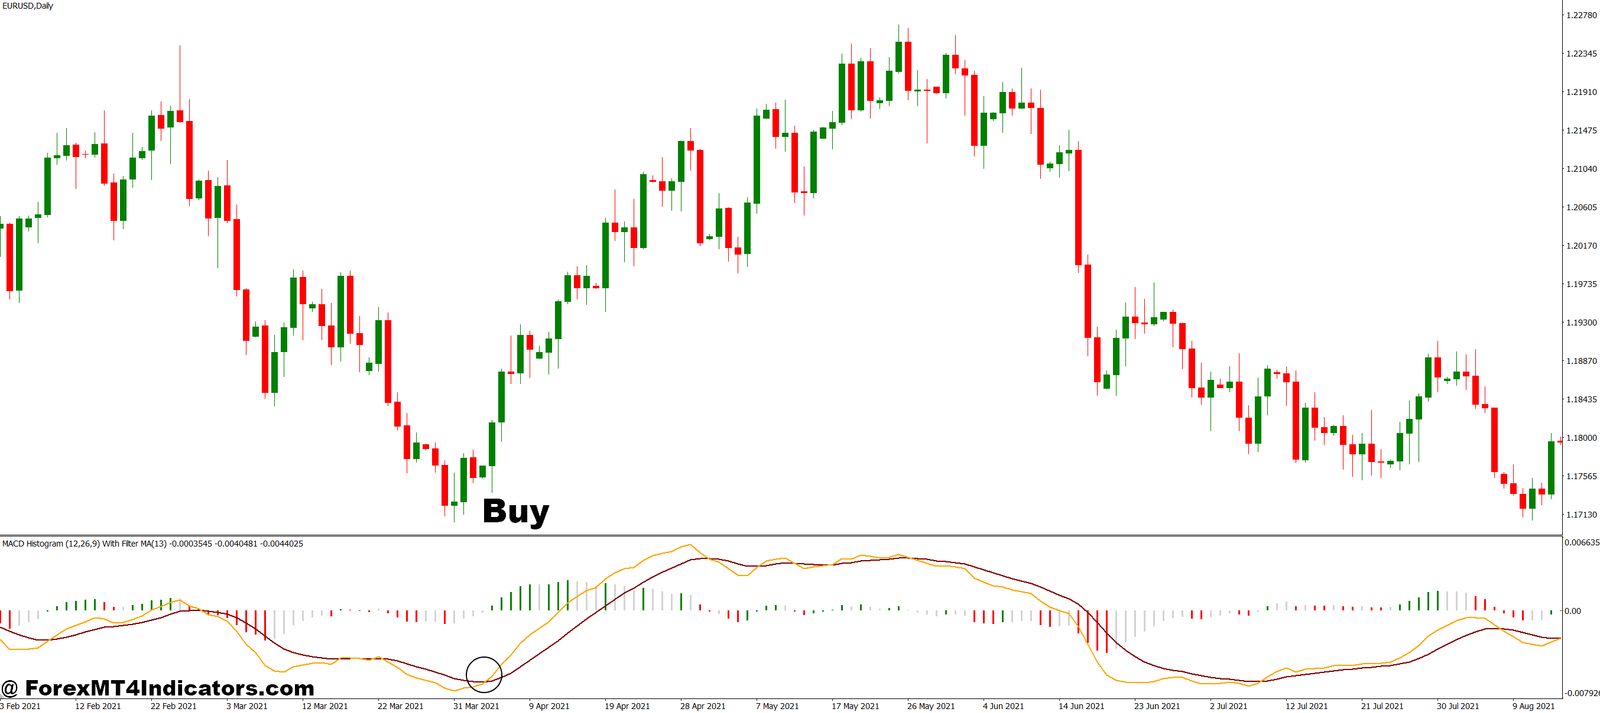
Buy Entry
- Wait for the MACD Histogram bars to rise above the zero line, showing bullish momentum.
- Confirm that the histogram bars are increasing in height, indicating growing buying pressure.
- Check that the price is making higher highs and higher lows on the main chart.
- Enter a buy trade once momentum strengthens, preferably after a small pullback or consolidation.
- Place a stop loss below the recent swing low or support level.
- Consider taking profit when histogram bars start to shorten or move back toward zero.
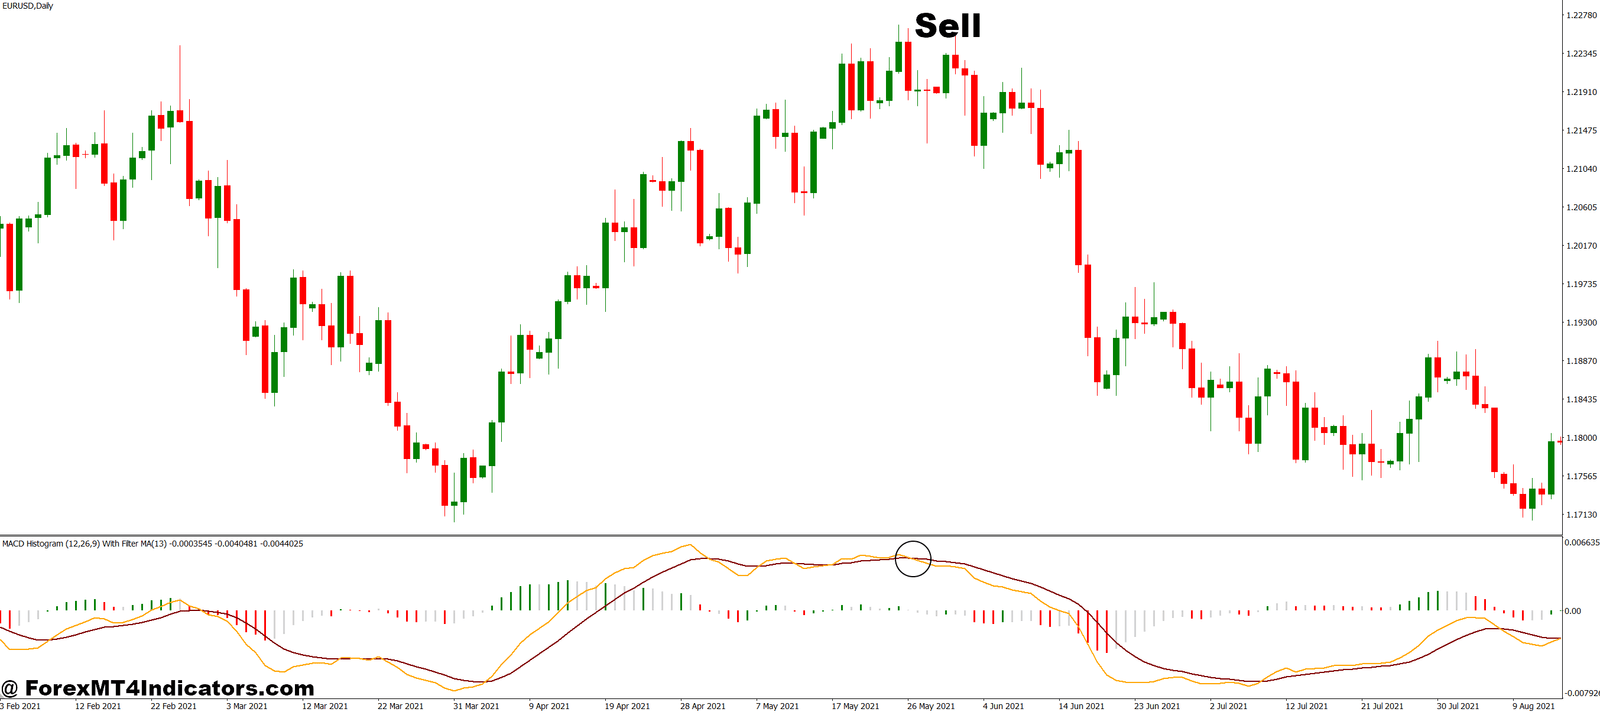
Sell Entry
- Wait for the MACD Histogram bars to drop below the zero line, signaling bearish momentum.
- Confirm that the histogram bars are getting longer in the negative area, showing stronger selling pressure.
- Ensure the price is forming lower highs and lower lows on the chart.
- Enter a sell trade after confirming the downtrend, ideally following a minor retracement.
- Place a stop loss above the recent swing high or resistance level.
- Take profit when histogram bars begin to shrink or turn back toward zero.
Conclusion
The MACD Histogram MT4 Indicator is more than just a visual tool it’s a momentum map that helps traders stay on the right side of the market. By understanding how to interpret the histogram bars, traders can identify strong moves early, avoid weak setups, and trade with more confidence. It’s an essential addition to any trader’s toolkit, especially for those seeking a balance between simplicity and accuracy in their technical analysis.
Recommended MT4/MT5 Broker
XM Broker
- Free $50 To Start Trading Instantly! (Withdraw-able Profit)
- Deposit Bonus up to $5,000
- Unlimited Loyalty Program
- Award Winning Forex Broker
- Additional Exclusive Bonuses Throughout The Year
- Exclusive 90% VIP Cash Rebates for all Trades!
Already an XM client but missing out on cashback? Open New Real Account and Enter this Partner Code: VIP90
(Free MT4 Indicators Download)

Enter Your Email Address below, download link will be sent to you.


