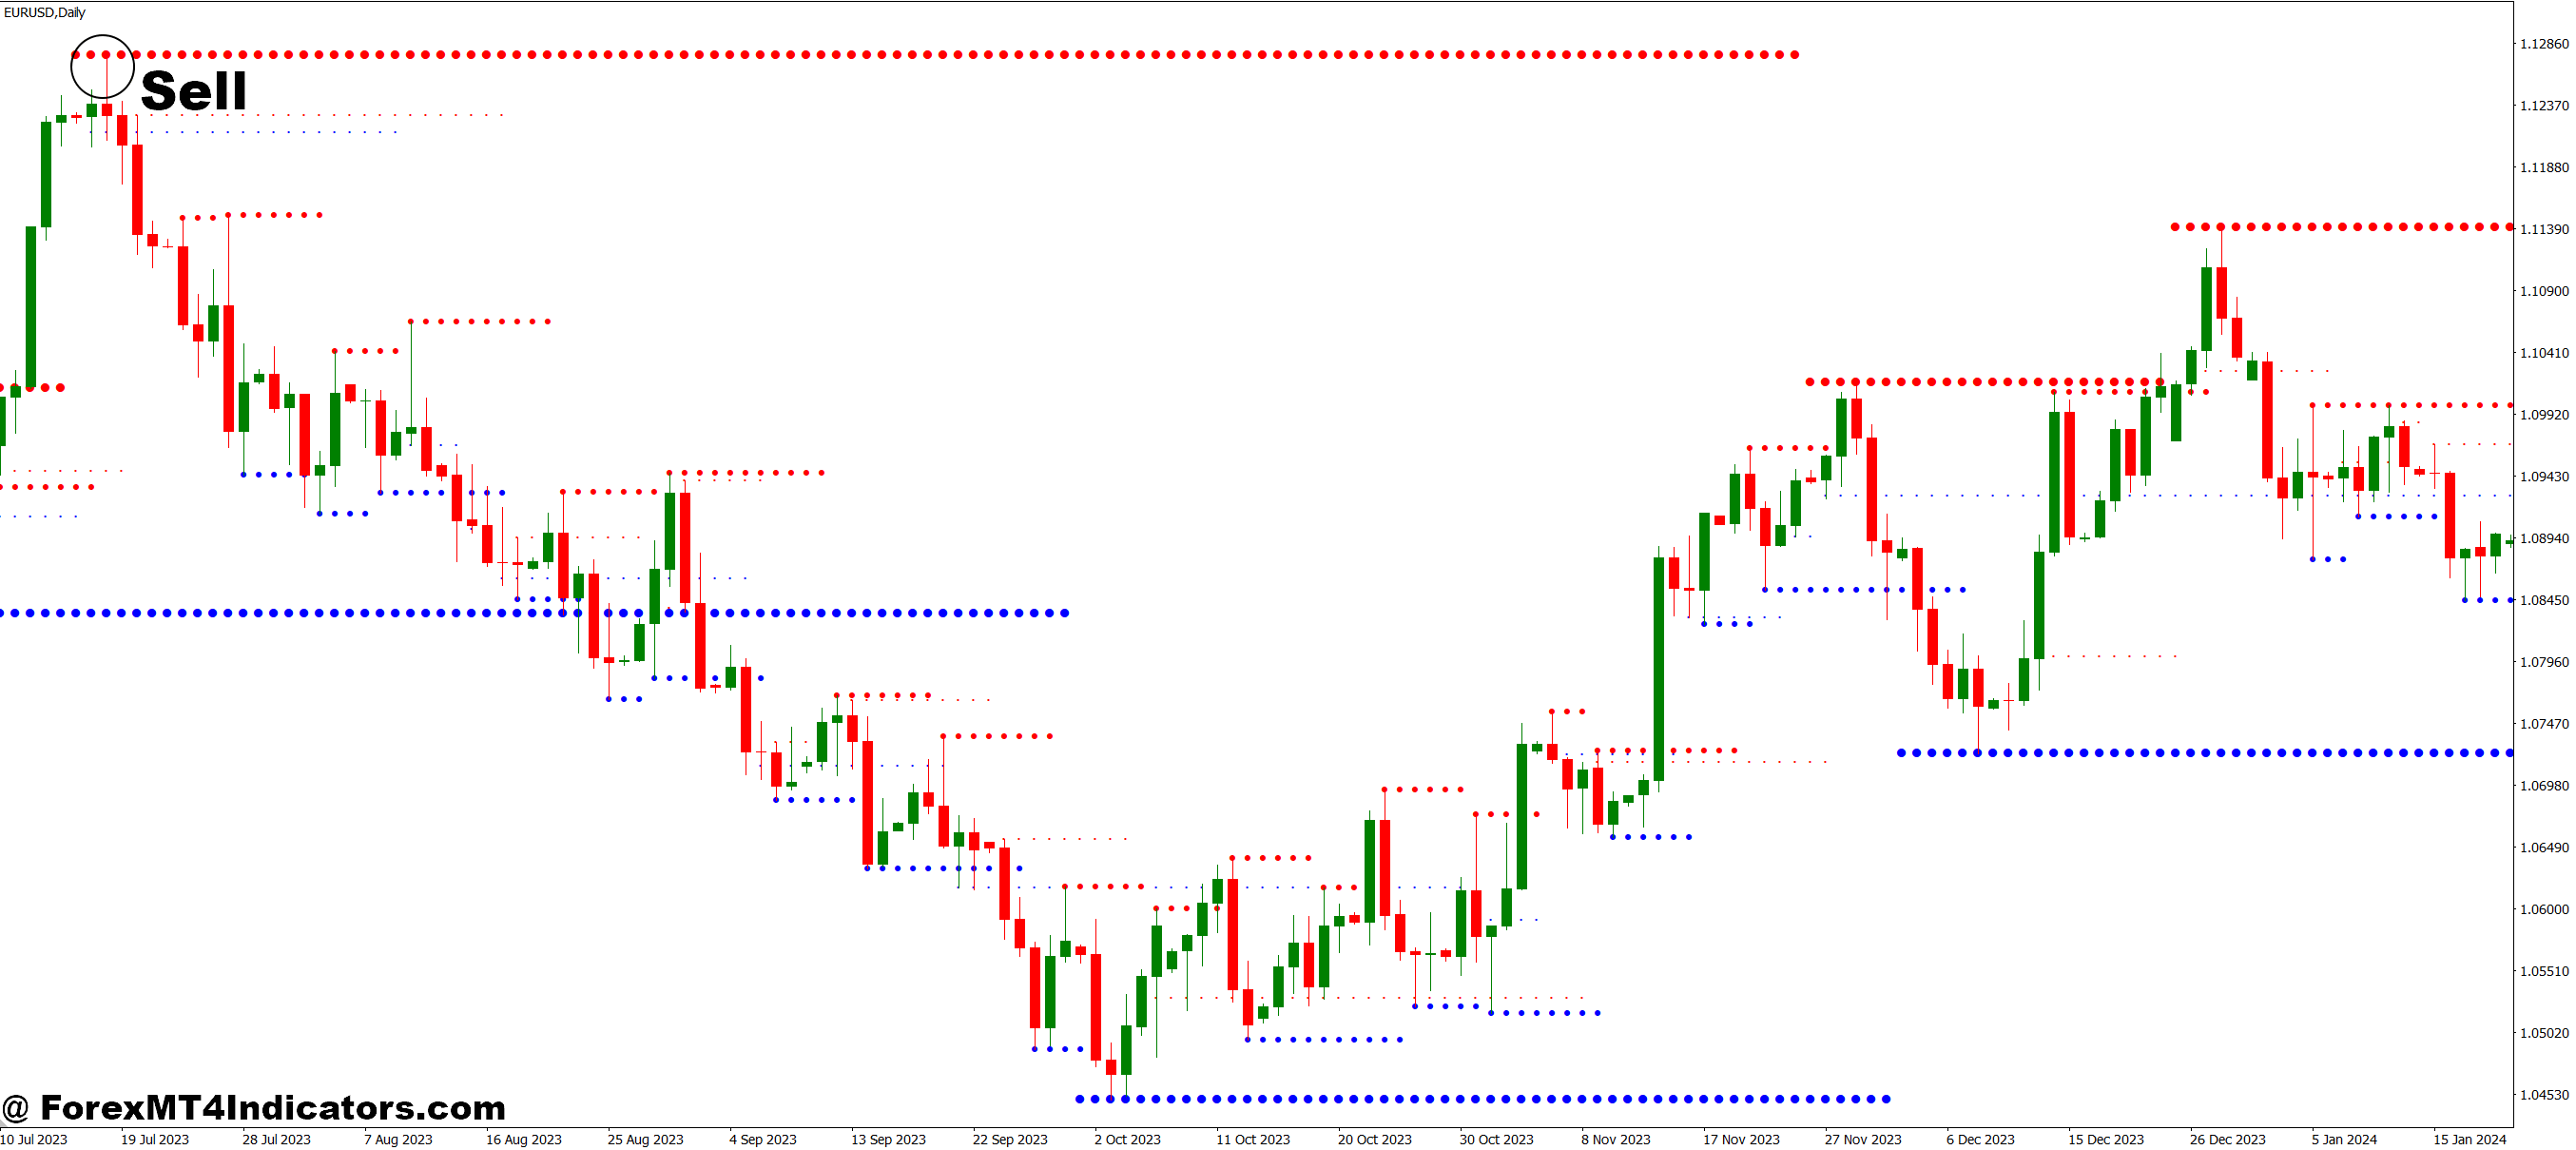
The MTF (Multi-Time Frame) Resistance and Support MT4 Indicator is a powerful trading tool that visualizes crucial price zones from higher timeframes such as H1, H4, and D1 on your current chart. These zones represent areas where the price has historically reacted—either bouncing upward or reversing downward. By combining these key levels from multiple timeframes, the indicator gives traders a broader market perspective, making it easier to anticipate potential turning points.
Why It Matters in Trading
Support and resistance are the backbone of technical analysis. However, most traders limit themselves to one timeframe, missing the bigger picture. This indicator bridges that gap by integrating data from higher charts, allowing traders to see where major buyers and sellers might step in. It helps them identify stronger confluence areas, which often lead to high-probability trades. With this advantage, traders can avoid false breakouts and improve their entry accuracy.
How Traders Use It
Traders often use the MTF Resistance and Support MT4 Indicator alongside trend indicators or oscillators for confirmation. When the price approaches a resistance zone, they look for signs of weakness or reversal patterns to go short. Conversely, if the price touches a support level and shows bullish momentum, they consider entering a buy trade. This combination of price action and multi-timeframe support/resistance zones makes the indicator highly effective for both short-term scalping and long-term swing trading.
Benefits and Customization
The indicator offers flexibility in how it displays levels traders can adjust colors, thickness, and the specific timeframes they want to include. It’s user-friendly and suitable for all experience levels, from beginners learning market structure to professionals refining their strategy. Since it updates dynamically, it continuously adapts as new highs or lows are formed in the market, ensuring that traders always have up-to-date information.
How to Trade with MTF Resistance and Support MT4 Indicator
Buy Entry
- Wait for the price to approach or touch a support level shown by the indicator.
- Confirm the level with a bullish reversal candle (like a hammer, bullish engulfing, or pin bar).
- Check that the higher timeframe trend (e.g., H4 or D1) is also bullish or showing signs of strength.
- Enter a buy trade when the next candle confirms upward momentum.
- Place a stop-loss slightly below the identified support zone.
- Set your take-profit near the next resistance level or at a 1:2 risk/reward ratio.
Sell Entry
- Wait for the price to approach or test a resistance level plotted by the indicator.
- Look for a bearish reversal pattern (such as a shooting star, bearish engulfing, or doji).
- Ensure that the higher timeframe trend aligns with a bearish bias.
- Enter a sell trade once the next candle confirms downward movement.
- Place a stop-loss just above the resistance zone.
- Set your take-profit at the next support level or based on a 1:2 risk/reward target.
Conclusion
The MTF Resistance and Support MT4 Indicator is an essential tool for traders who value precision and simplicity. By bringing multi-timeframe analysis into a single chart, it saves time and enhances accuracy. Whether one trades forex, commodities, or indices, this indicator provides a clear roadmap of key price levels—helping traders make smarter, more confident trading decisions every day.
Recommended MT4/MT5 Broker
XM Broker
- Free $50 To Start Trading Instantly! (Withdraw-able Profit)
- Deposit Bonus up to $5,000
- Unlimited Loyalty Program
- Award Winning Forex Broker
- Additional Exclusive Bonuses Throughout The Year
- Exclusive 90% VIP Cash Rebates for all Trades!
Already an XM client but missing out on cashback? Open New Real Account and Enter this Partner Code: VIP90
(Free MT4 Indicators Download)

Enter Your Email Address below, download link will be sent to you.


