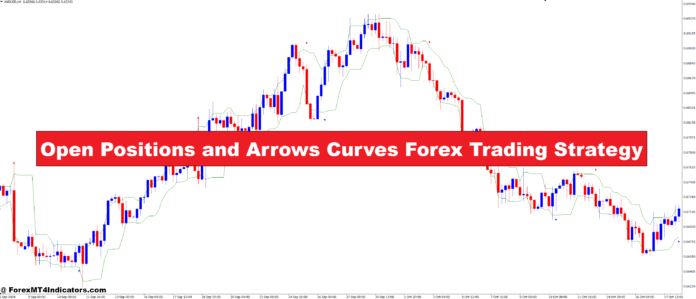
Are you lost in the world of forex trading? You’re not alone. Many traders get stuck in market ups and downs and miss chances. The Open Positions and Arrows Curves forex trading strategy can help. It makes choosing trades easier and more confident.
This strategy uses visual signs and trend analysis to find the best times to buy or sell. It works for all kinds of traders, no matter their experience. It’s a great tool to add to your trading arsenal.
Key Takeaways
- Simplifies forex trading decisions
- Combines trend analysis with visual indicators
- Suitable for various trading styles
- Helps identify optimal entry and exit points
- Enhances trading confidence and efficiency
Understanding Arrow Indicators in Forex Trading
Arrow indicators are key in forex trading. They make complex data easy to see, helping traders find trends and chances. In technical analysis, these indicators are great for making smart choices.
What Are Arrow Indicators
Arrow indicators in forex trading are visual signals on price charts. They show when to buy or sell based on market conditions. These indicators look at price changes and show arrows when certain rules are met. This makes it easier for traders to see market trends.
Types of Trading Arrows
There are many types of arrow indicators in forex trading. Some common ones are:
- Trend arrows: Show the overall market direction
- Entry arrows: Signal when to start a trade
- Exit arrows: Tell when to close a trade
- Reversal arrows: Highlight possible trend changes
Each type has its role in technical analysis. They help traders make better choices.
Importance in Technical Analysis
Arrow indicators are very important in technical analysis for several reasons:
- They make complex data easy to understand, helping spot trends
- Non-repainting indicators give reliable trading signals
- They help traders find good times to enter and exit trades
- Arrow indicators can be used with other tools for more confirmation
By using arrow indicators, forex traders can make better choices. This can help them do better in trading.
Trading Platform Setup and Implementation
Setting up your trading platform is key for forex trading success. MetaTrader4 is a top choice, known for its easy-to-use interface. It’s perfect for the Open Positions and Arrows Curves strategy. Let’s go through how to set up your trading space.
To start, download MetaTrader4 from your broker’s site. After installing, you’ll need to add the right indicators. The process is simple. Just find the “Indicators” folder in MetaTrader4 and move the ArrowsandCurves.ex4 and MAAngle.ex4 files there.
Once the indicators are in place, restart MetaTrader4. This makes sure the platform knows about the new indicators. To add them to your chart, drag and drop them from the Navigator window. Or right-click on the indicator name and choose “Attach to a chart”.
Customizing your trading platform is important. Try different timeframes and currency pairs to see what fits your style. With MetaTrader4 set up, you’re ready to use the Open Positions and Arrows Curves strategy.
Chart Setup and Required Indicators
Setting up your forex chart right is key for good trading. This part talks about the important indicators and timeframe analysis for the Open Positions and Arrows Curves strategy.
ArrowsandCurves.ex4 Settings
The ArrowsandCurves.ex4 indicator is a big part of this strategy. Put it on your MetaTrader 4 platform with the default settings. It shows arrows on your chart to help find entry and exit points.
MAAngle.ex4 Configuration
Then, add the MAAngle.ex4 indicator to your chart. It looks at moving average angles to show trend strength and direction. Use the default settings for the best results with this strategy.
Timeframe Selection
This strategy works well across different timeframes. While any timeframe can be used, many traders do well with the 30-minute (M30) chart. It balances short-term noise and long-term trends well.
Remember, your chart setup is the base of your trading choices. Proper setup of these forex indicators and thoughtful timeframe analysis can boost your trading. Try different settings to see what fits your trading style and market conditions best.
Managing Stop Loss and Take Profit Levels
Effective risk management is key in forex trading. Setting the right stop loss and take profit levels can greatly help your success. Let’s look at how to use these elements in your strategy.
Dynamic Stop Loss Placement
For long entries, set your stop loss a few pips below the low of the last candle. This method changes with the market, protecting you while letting prices move.
Take Profit Calculations
Set take profit levels dynamically. Trades close after two candles. This balances gains with risk.
| Profit Target | Average Gain | Maximum Drawdown |
|---|---|---|
| No Target | 1.89% | 19.5% |
| 5% | 1.60% | 19.5% |
| 10% | 1.83% | 19.5% |
Risk Management Guidelines
Follow these tips to improve your trading:
- Risk 1-5% of your account per trade
- Seek a risk-to-reward ratio of at least 1:2
- Target 400 points while risking 100 points
- Use lower leverage for steady profits
Successful trading balances profits with careful risk. By using these stop-loss and take-profit strategies, you can protect your investments and increase your trading success.
Short Position Trading Guidelines
Forex shorting helps traders make money when markets go down. It’s important to know how to spot short positions and sell signals. Here are some tips for trading short positions well.
When you think about forex shorting, watch for red bars on the MAAngle.ex4 indicator. This means a possible downtrend. The best time to go short is when the indicator goes from positive to negative and shows a red arrow.
It’s key to know when the market is good for short positions. Look for bearish trends, high volatility, and bad economic news. Always check sell signals with more than one indicator to make trades more likely to succeed.
| Strategy | Annual Return | Max Drawdown | Ulcer Index |
|---|---|---|---|
| Trade Around Core Position | 11.3% | 25% | 3.8 |
| Buy and Hold | 9.9% | 55% | 12.5 |
The table shows two strategies. It shows that active trading, like short positions, is better than just holding onto stocks. The active strategy has less risk and better risk management.
Market Conditions and Signal Filtering
Successful forex trading needs a good grasp of market conditions and signal filtering. This part looks at how traders can boost their strategy. It focuses on trend analysis, trading volume, and market volatility.
Trend Analysis
Trend identification is key for smart trading decisions. The SuperTrend indicator, made by Olivier Seban in 2009, is a favorite for trend analysis. It shows green lines for uptrends and red for downtrends, using a 10-period setting with a 3 multiplier.
Volume Considerations
Trading volume is very important in market analysis. High volume means strong market moves and possible trend reversals. Traders usually risk 2% of their deposit per trade when using volume-based indicators like SuperTrend.
Market Volatility Impact
Market volatility affects trading results a lot. The Average True Range (ATR) is a key in measuring volatility. The SuperTrend indicator uses ATR in its calculations, adjusting for market changes:
- Upper band = (High + Low) / 2 + (Multiplier * ATR)
- Lower band = (High + Low) / 2 – (Multiplier * ATR)
By adding these elements to your trading plan, you can make your signals more accurate and profitable. Keep in mind, that these tools work differently in various timeframes and market conditions.
Probability Distribution in Trading Decisions
Probability distribution curves are very important in trading. They help traders understand the market’s uncertainty. Tools like histograms and kernel density estimates (KDEs) show the chances of different outcomes.
The Open Positions and Arrows Curves strategy uses these tools. It helps traders see the risks and rewards. This makes complex math easier for everyone.
Many trading strategies rely on technical indicators. For example, the Relative Strength Index (RSI) gives values from 0 to 100. Values over 70 mean the market is overbought, and values under 30 mean it’s oversold.
Bollinger Bands use a moving average and two standard deviation lines. They help predict when prices might break out.
Monte Carlo simulations are key for trading probability analysis. They show hidden risks in strategies. For example, a backtest might show a $1,663.90 drawdown, but Monte Carlo could find a $5,195.17 worst-case scenario.
Traders use Monte Carlo to guess risk better. They might find that 95% of drawdowns won’t go over 30%. This helps them avoid bad strategies and make better choices.
Strategy Optimization Techniques
Mastering strategy optimization is key to trading success. This process involves fine-tuning your approach to maximize profits and minimize risks. Let’s explore essential techniques for improving your trading strategy.
Parameter Adjustment
Tweaking parameters can significantly impact your trading outcomes. For instance, adjusting moving average periods or indicator settings can lead to improved signal accuracy. Experiment with different timeframes to find the sweet spot for your strategy.
Backtesting Methods
Backtesting is key for strategy evaluation. Use historical data to simulate trades and assess performance. Python offers efficient backtesting tools, allowing quick compilation of statistics for rapid strategy optimization.
Performance Metrics
Analyzing key metrics helps gauge strategy effectiveness. Consider these important factors:
- Win rate
- Profit factor
- Maximum drawdown
- Sharpe ratio
Heatmaps provide visual insights into how strategy parameters influence trading outcomes. They help identify optimal values for variables, improving overall performance.
| Strategy | In-Sample Performance | Out-of-Sample Performance | Correlation Coefficient (R²) |
|---|---|---|---|
| Strategy A (120, 30 EMA) | Strong | Weak | 0.85 |
| Strategy B (120, 14 EMA) | Consistent | Consistent | 0.92 |
Remember, successful strategies require clear mechanical rules. This eliminates subjective decisions that can skew results. By applying these optimization techniques, you’ll be well on your way to developing a robust trading strategy.
Common Trading Pitfalls to Avoid
Trading mistakes can hurt your success in the forex market. One big mistake is thinking a few wins prove an indicator works. But, it takes 100-200 trades to test it, with a 70% win rate as the goal.
Letting emotions control your trading is another big mistake. Traders who follow their feelings might trade too much or hold onto losing trades. Good risk management can help avoid these problems.
Another mistake is relying too much on indicators. Tools like Open Positions and Arrows Curves are helpful but don’t make all your decisions with them. Mixing different ways to analyze the market leads to better results.
| Trading Aspect | Common Mistake | Best Practice |
|---|---|---|
| Strategy Validation | Assuming effectiveness after a few trades | Test on 100-200 trades, aiming for 70% accuracy |
| Emotional Control | Letting emotions drive decisions | Implement strict risk management rules |
| Indicator Usage | Over-relying on single indicators | Combine multiple analysis methods |
| Trade Frequency | Overtrading | Focus on quality trades, not quantity |
Successful trading needs patience and discipline. The saying “money is made by sitting, not trading” shows the value of waiting for the right moment. It’s better to wait for good opportunities than to trade all the time.
How to Trade with Open Positions and Arrows Curves Forex Trading Strategy
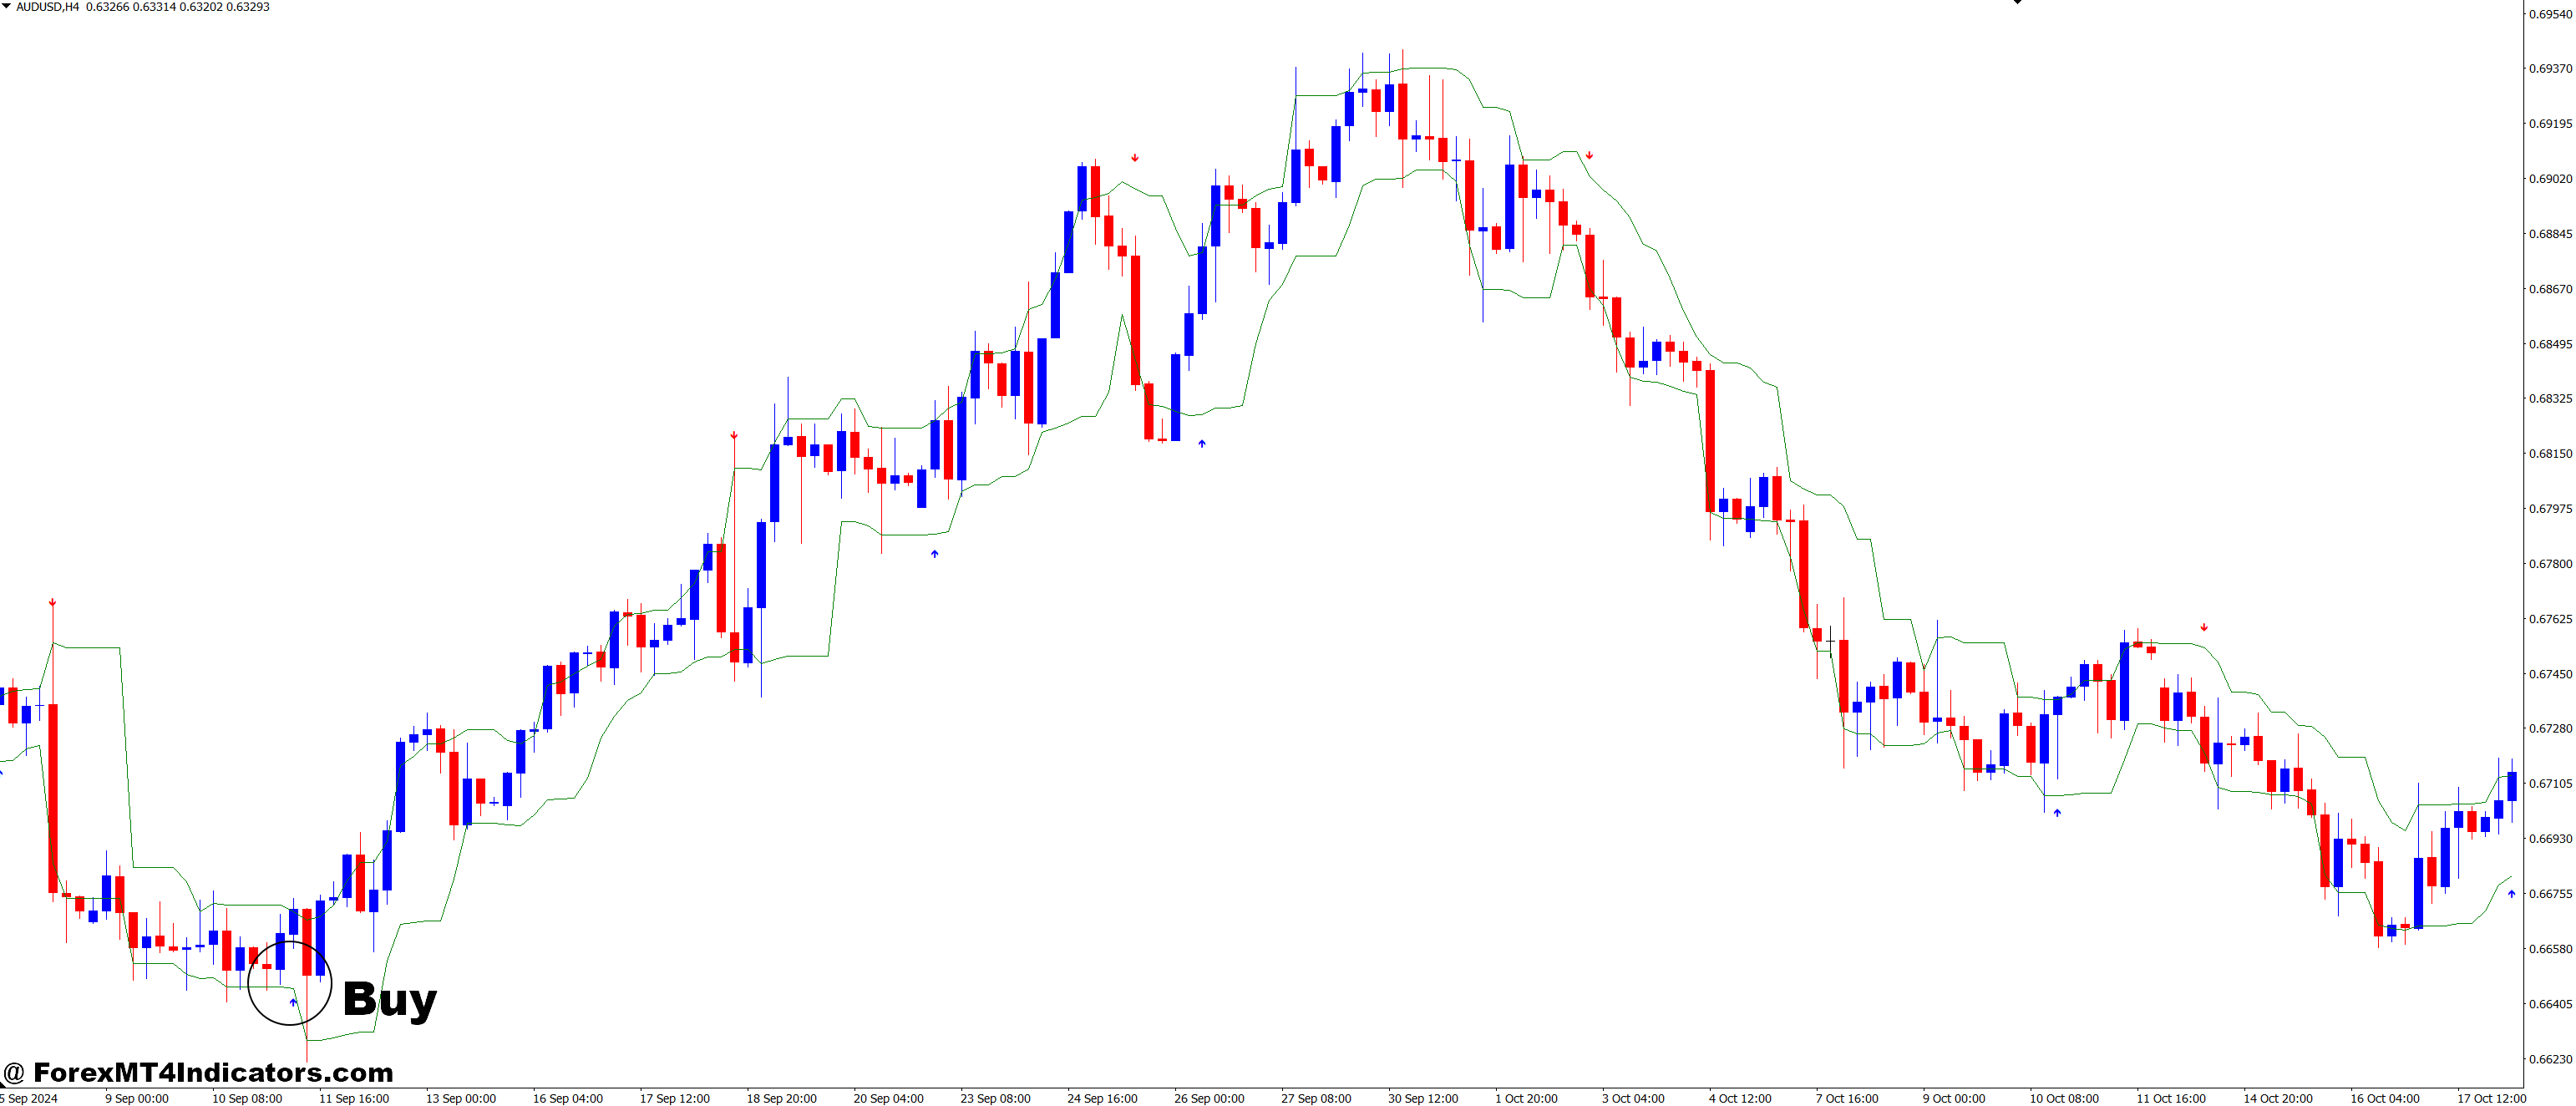
Buy Entry
- Trend Confirmation: Ensure the market is in an uptrend:
- Price is above the moving averages (e.g., 50 EMA and 200 EMA).
- Higher highs and higher lows are being formed.
- Arrow Signal: Look for a green arrow or upward-pointing arrow.
- Additional Confirmation (Optional):
- RSI or Stochastic should not be overbought (below 70 on RSI, for example).
- The price should be near or at a support level (for better entry points).
- Entry Point: Enter the buy trade when the green arrow appears in an uptrend.
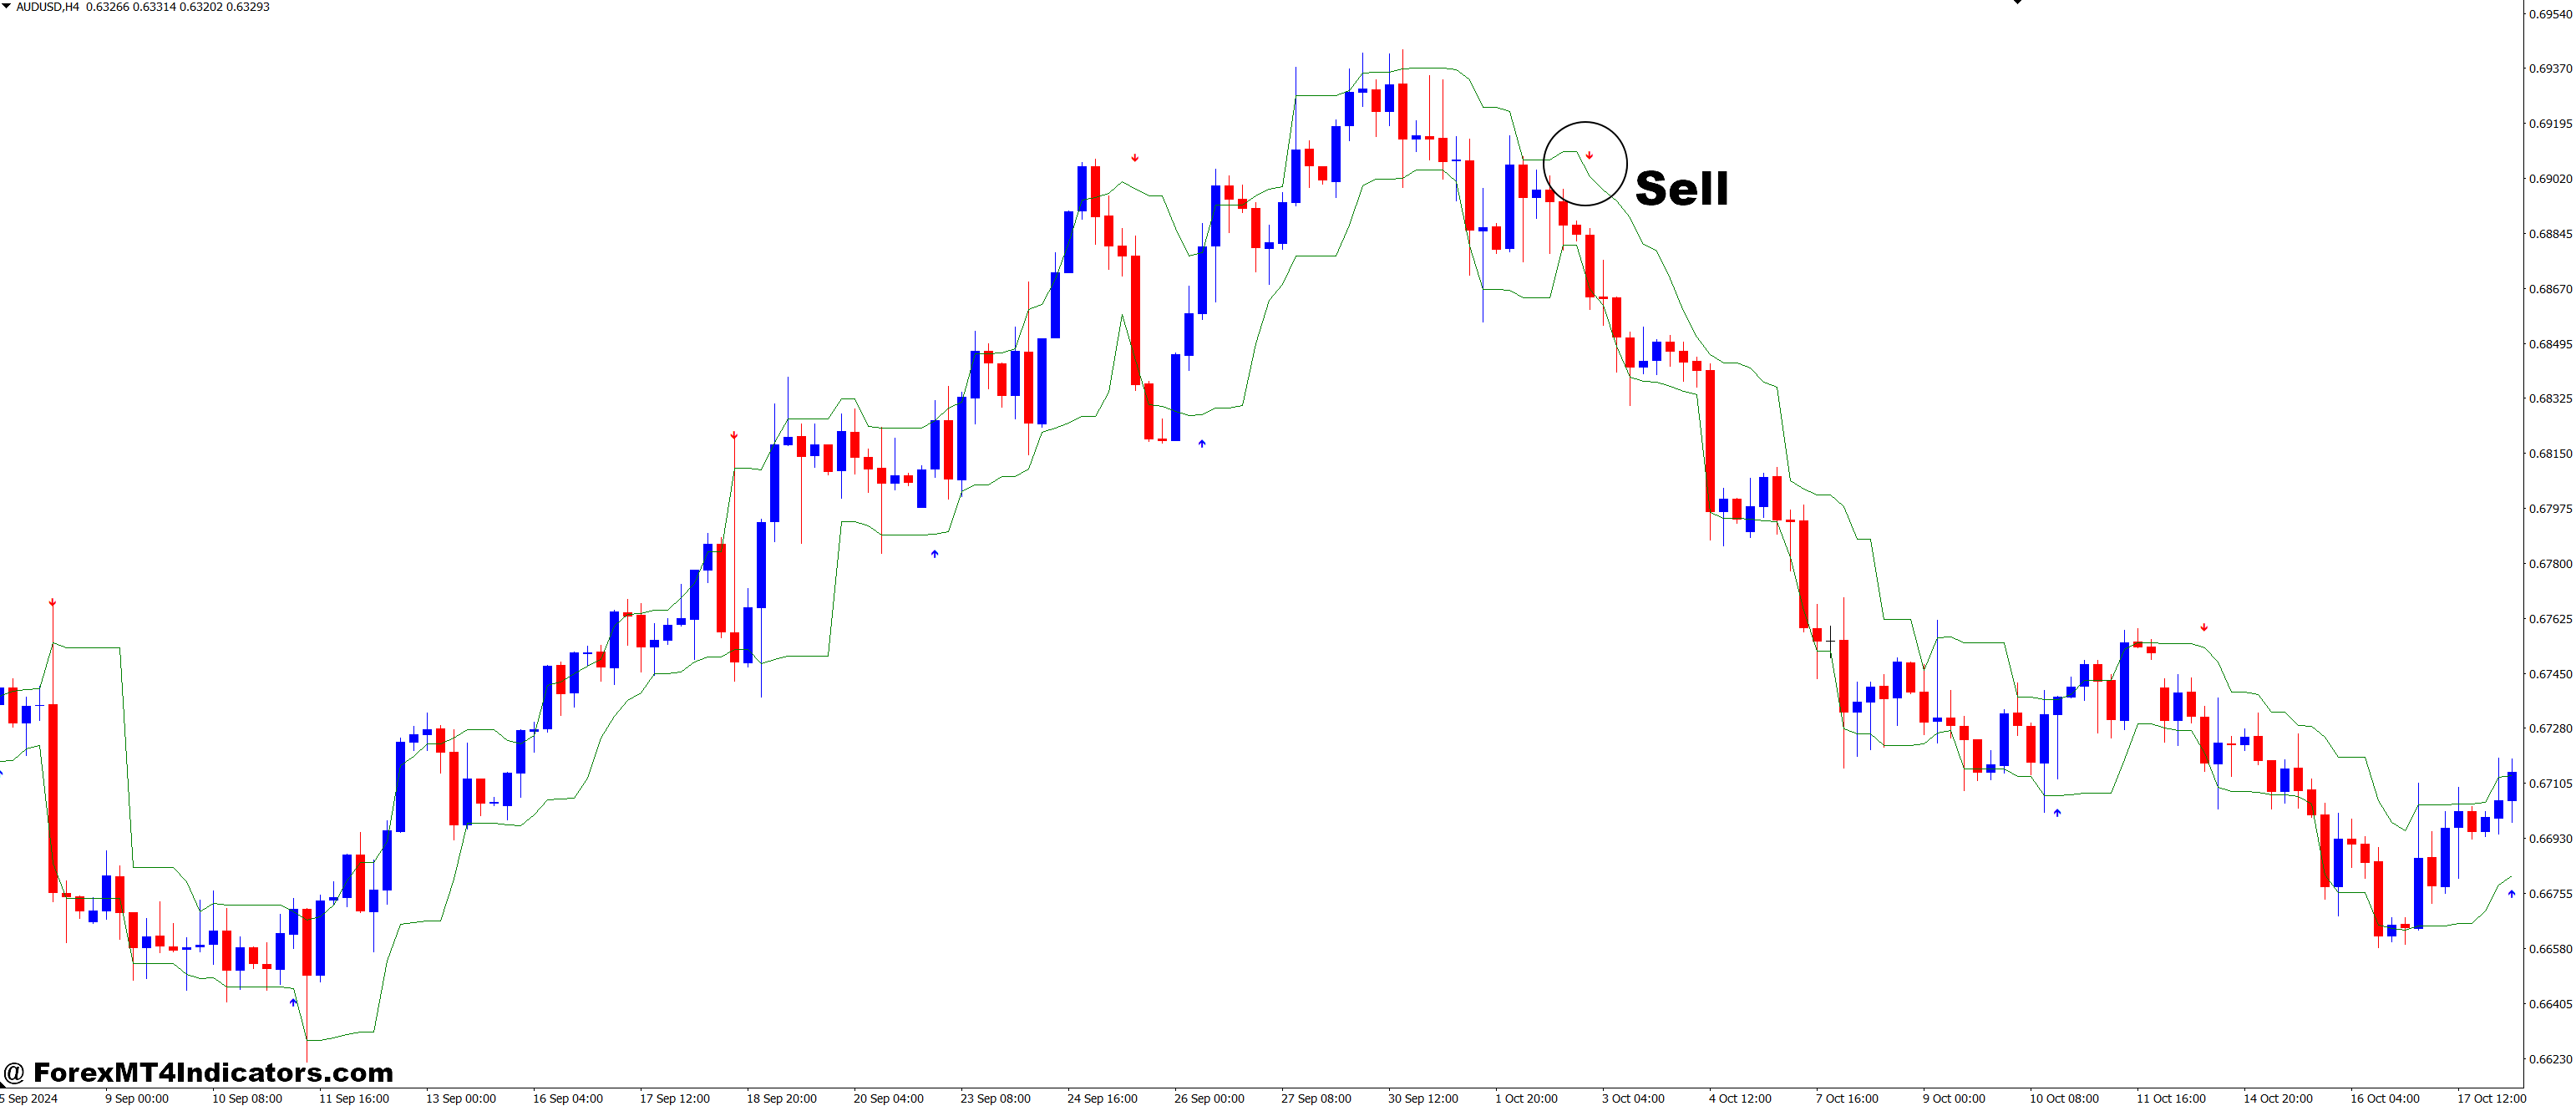
Sell Entry
- Trend Confirmation: Ensure the market is in a downtrend:
- Price is below the moving averages (e.g., 50 EMA and 200 EMA).
- Lower highs and lower lows are being formed.
- Arrow Signal: Look for a red arrow or a downward-pointing arrow.
- Additional Confirmation (Optional):
- RSI or Stochastic should not be oversold (above 30 on RSI, for example).
- The price should be near or at a resistance level (for better entry points).
- Entry Point: Enter the sell trade when the red arrow appears in a downtrend.
Conclusion
The Open Positions and Arrows Curves Forex Trading Strategy is a powerful tool for traders. It helps them understand the complex world of currency markets. This forex strategy summary shows how important it is to mix technical analysis with good risk management.
By using probability distribution curves and trend recognition, traders can find great opportunities. They can also manage their positions well.
Improving at trading is a never-ending journey. This strategy is a great starting point. The forex market is open 24/5 and involves over 180 countries.
This makes it essential to have flexible strategies. The 9 EMA approach works well in trending markets like cryptocurrencies. But, it’s not as effective in all markets. This shows the need to adjust techniques for different trading tools.
Learning never stops in the forex world. Traders need to keep up with market changes. They should know about major currency pairs and how trading sessions affect volatility.
By always learning and adapting, traders can get better. They can improve their chances of success in the fast-changing world of forex trading.
Recommended MT4 Broker
XM Broker
- Free $50 To Start Trading Instantly! (Withdraw-able Profit)
- Deposit Bonus up to $5,000
- Unlimited Loyalty Program
- Award Winning Forex Broker
- Additional Exclusive Bonuses Throughout The Year
- Exclusive 90% VIP Cash Rebates for all Trades!
Already an XM client but missing out on cashback? Open New Real Account and Enter this Partner Code: VIP90
Click here below to download:
Enter Your Email Address below, download link will be sent to you.


