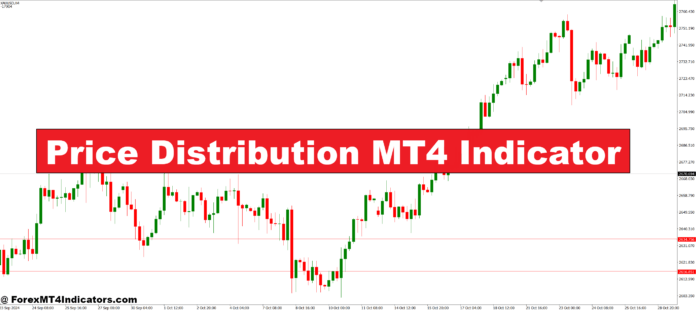
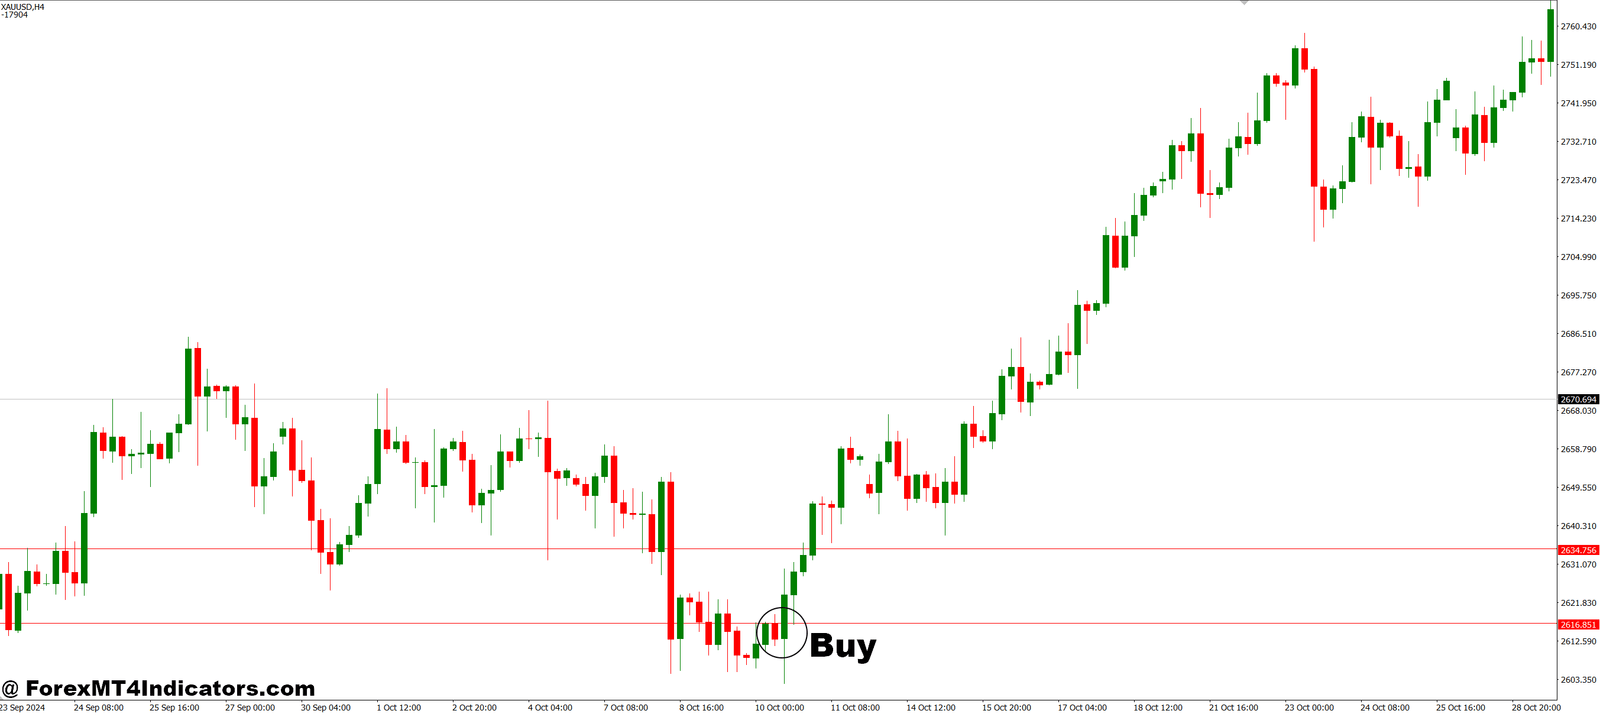
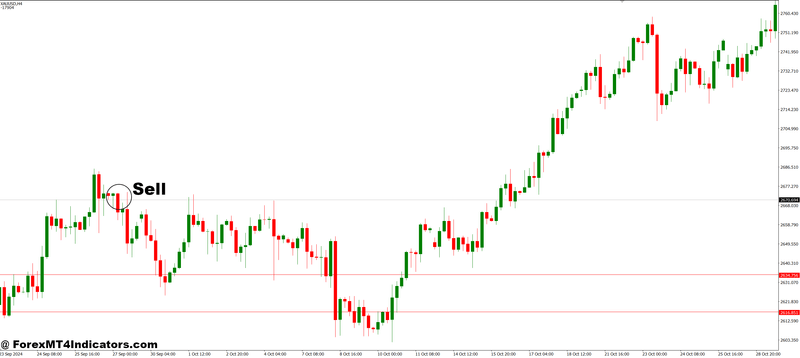
The Price Distribution MT4 Indicator is designed to display the market’s price activity in a simple, visual form. It plots a histogram or horizontal bars across the chart to show which price levels have seen the most trading activity. The wider the bar, the more time price has spent there, indicating stronger support or resistance zones. Traders can use this information to gauge where price may pause or reverse. It’s especially useful in sideways markets where traditional indicators struggle to define entry or exit points.
How the Indicator Helps Traders
Unlike basic moving averages or oscillators, this indicator focuses on market structure rather than momentum. It gives traders a clear view of price concentration areas, helping them understand how the market behaves at specific price levels. For example, if price repeatedly reacts to a certain zone with wide distribution, it may signal an important level where large traders are active. This insight allows traders to plan smarter entries and exits with reduced risk.
Practical Uses in Trading
The Price Distribution MT4 Indicator can be used in multiple trading styles—scalping, swing trading, or position trading. Scalpers can use it to pinpoint intraday balance areas, while swing traders can identify long-term accumulation or distribution zones. Combining it with trend-based tools like moving averages or RSI can further enhance accuracy. The indicator is easy to customize, allowing users to adjust colors and levels to match their strategy and comfort.
How to Trade with Price Distribution MT4 Indicator
Buy Entry
- Wait for the price to move above a high-volume price zone (a wide bar area).
- Confirm that the market forms a bullish candle closing above the distribution zone.
- Look for price rejection from lower zones, showing buying pressure.
- Place a buy order near the breakout area or after a retest of the high-volume zone.
- Set a stop-loss just below the most recent distribution level or local swing low.
Sell Entry
- Wait for the price to move below a high-volume price zone, indicating selling dominance.
- Confirm that the market forms a bearish candle closing below the distribution zone.
- Watch for retests of the broken area, signaling resistance.
- Enter a sell position after rejection or confirmation of the retest.
- Set a stop-loss just above the recent high or top of the distribution area.
Conclusion
The Price Distribution MT4 Indicator gives traders a deeper look into how prices behave over time, showing where the market is likely to react. By identifying key price zones and activity areas, it helps traders make more informed decisions and reduce guesswork. Whether used alone or with other tools, it provides a solid foundation for understanding market behavior and improving trade timing.
Recommended MT4/MT5 Broker
XM Broker
- Free $50 To Start Trading Instantly! (Withdraw-able Profit)
- Deposit Bonus up to $5,000
- Unlimited Loyalty Program
- Award Winning Forex Broker
- Additional Exclusive Bonuses Throughout The Year
- Exclusive 90% VIP Cash Rebates for all Trades!
Already an XM client but missing out on cashback? Open New Real Account and Enter this Partner Code: VIP90
(Free MT4 Indicators Download)

Enter Your Email Address below, download link will be sent to you.


