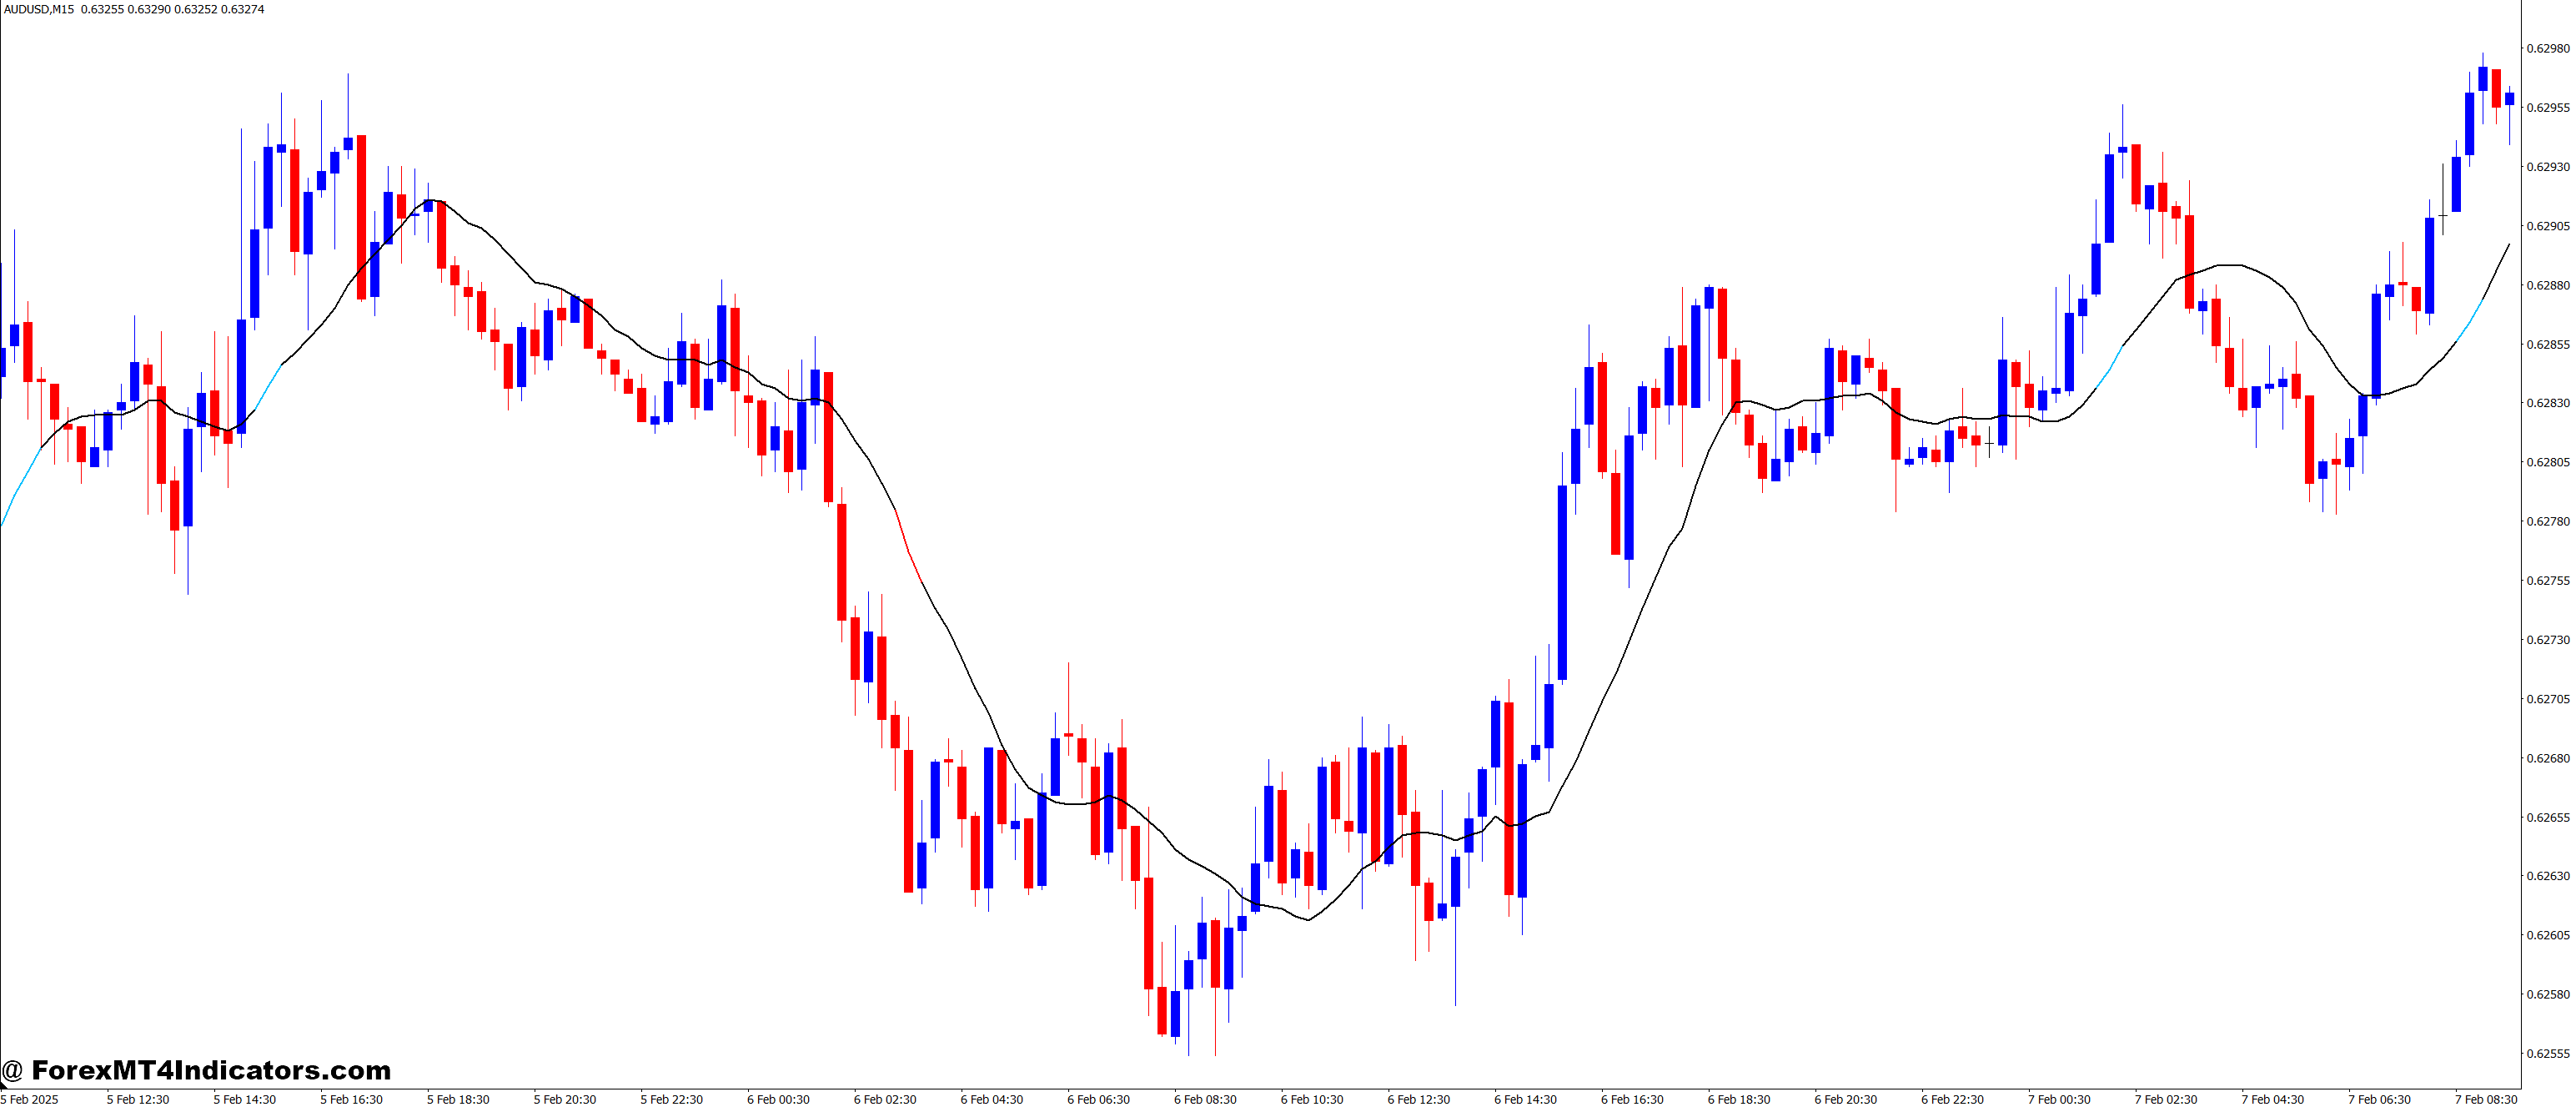
The RSI in MA indicator is a technical analysis tool that combines two powerful concepts—the Relative Strength Index (RSI) and the Moving Average (MA). The RSI is typically used to measure the momentum of a currency pair, indicating whether it’s overbought or oversold. When combined with the smoothing effect of a Moving Average, the RSI becomes even more reliable, offering clearer signals to traders. This indicator can help traders better identify trend reversals and price corrections in the market, making it an essential tool for both new and experienced traders.
How It Works in MT4
On the MetaTrader 4 (MT4) platform, the RSI in MA indicator can be added to the chart just like any other custom indicator. The moving average smooths out the RSI line, helping to filter out noise and improve the clarity of the signals. This is especially helpful in volatile markets where the standard RSI might give false signals. By observing the interaction between the RSI and the moving average, traders can identify strong trends, making it easier to decide when to enter or exit a trade. The flexibility of MT4 allows traders to adjust the period of the moving average and RSI, tailoring it to their preferred trading strategy.
Advantages of Using RSI in MA
Using the RSI in MA indicator comes with several advantages. First, it helps to minimize the noise that can be found in the standard RSI, providing more accurate signals. Second, it allows traders to spot potential trend reversals and price corrections earlier, which can lead to better entry and exit points. Finally, it’s easy to customize in MT4, allowing traders to fine-tune the settings based on their unique trading style. Whether you’re trading short-term or long-term, this indicator can improve the quality of your trades and make your trading decisions more precise.
How to Trade with RSI in MA MT4 Indicator
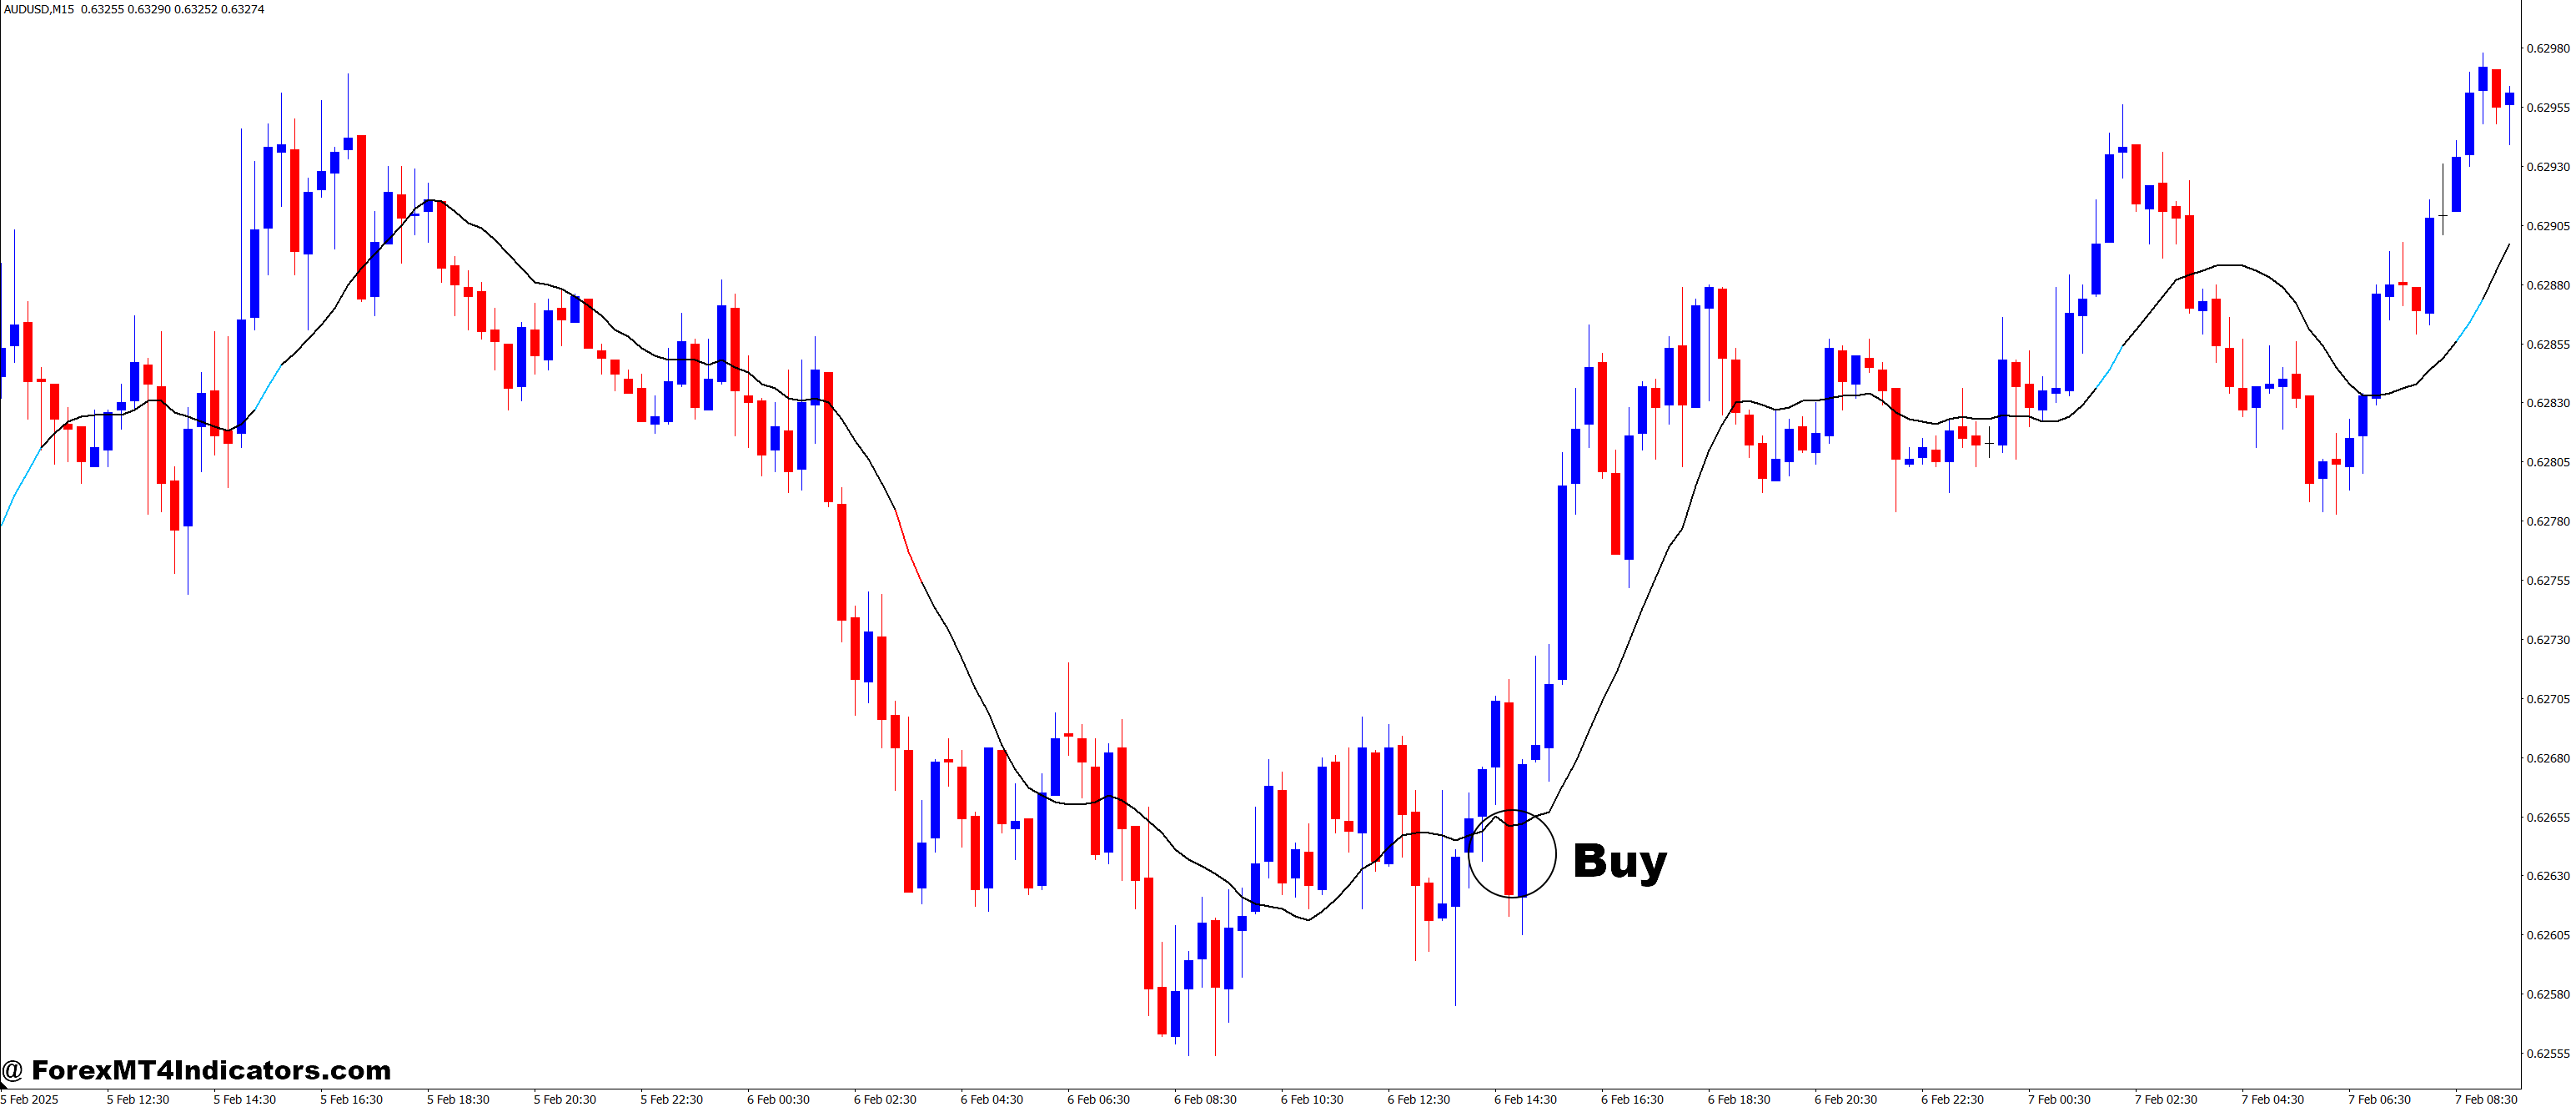
Buy Entry
- RSI crosses above the Moving Average: Look for the RSI line to cross above the moving average line, indicating increasing bullish momentum.
- RSI level above 30: Ensure that the RSI is above 30, confirming that the market is not oversold and has room to move upward.
- RSI rises from below 30: If the RSI moves from an oversold condition (below 30) towards the moving average, it signals a potential buying opportunity.
- Confirm with higher timeframe: To increase the reliability, check higher timeframes (like H1 or H4) to ensure the overall trend is bullish.
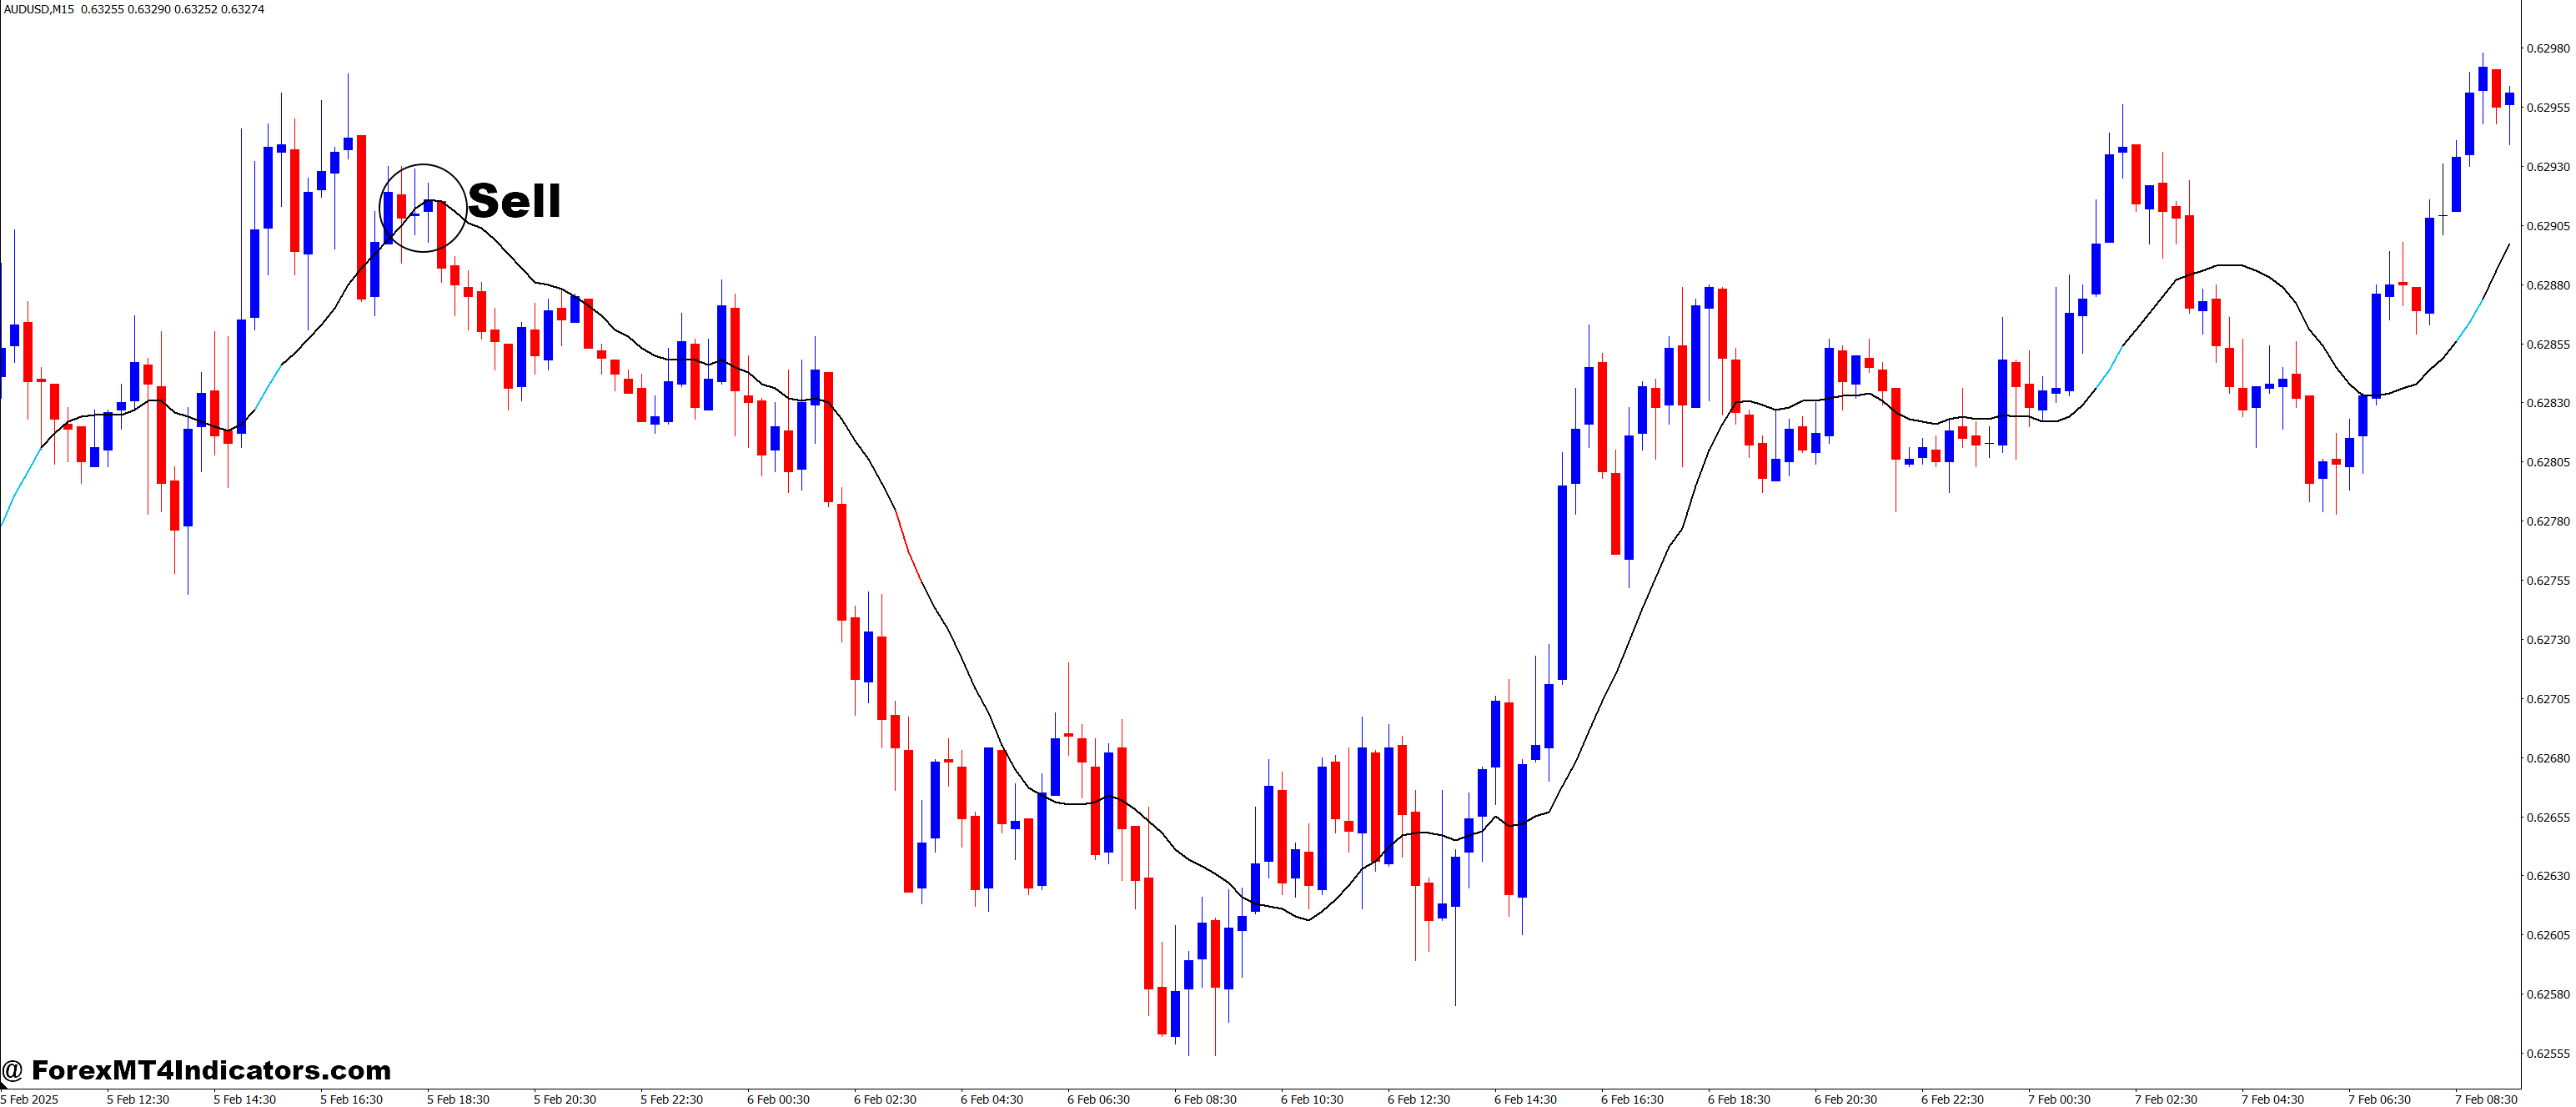
Sell Entry
- RSI crosses below the Moving Average: Watch for the RSI line crossing below the moving average, signaling a potential reversal to a downtrend.
- RSI level above 70: If the RSI is above 70, the market is overbought and could be due for a price pullback or correction.
- RSI falls from above 70: If the RSI moves down from overbought conditions, it can indicate the start of a bearish trend.
- Confirm with higher timeframe: Similarly, check the trend on higher timeframes to confirm that the market is indeed in a downtrend before entering the short position.
Conclusion
Incorporating the RSI in MA MT4 indicator into your trading strategy can significantly improve your decision-making process. By smoothing the signals and making it easier to spot market trends, this tool offers both beginners and experienced traders a more reliable way to navigate the forex market. If you’ve struggled with interpreting RSI signals in the past, using it in combination with a moving average could be the key to more successful trades.
Recommended MT4/MT5 Broker
XM Broker
- Free $50 To Start Trading Instantly! (Withdraw-able Profit)
- Deposit Bonus up to $5,000
- Unlimited Loyalty Program
- Award Winning Forex Broker
- Additional Exclusive Bonuses Throughout The Year
- Exclusive 90% VIP Cash Rebates for all Trades!
Already an XM client but missing out on cashback? Open New Real Account and Enter this Partner Code: VIP90
(Free MT4 Indicators Download)

Enter Your Email Address below, download link will be sent to you.


