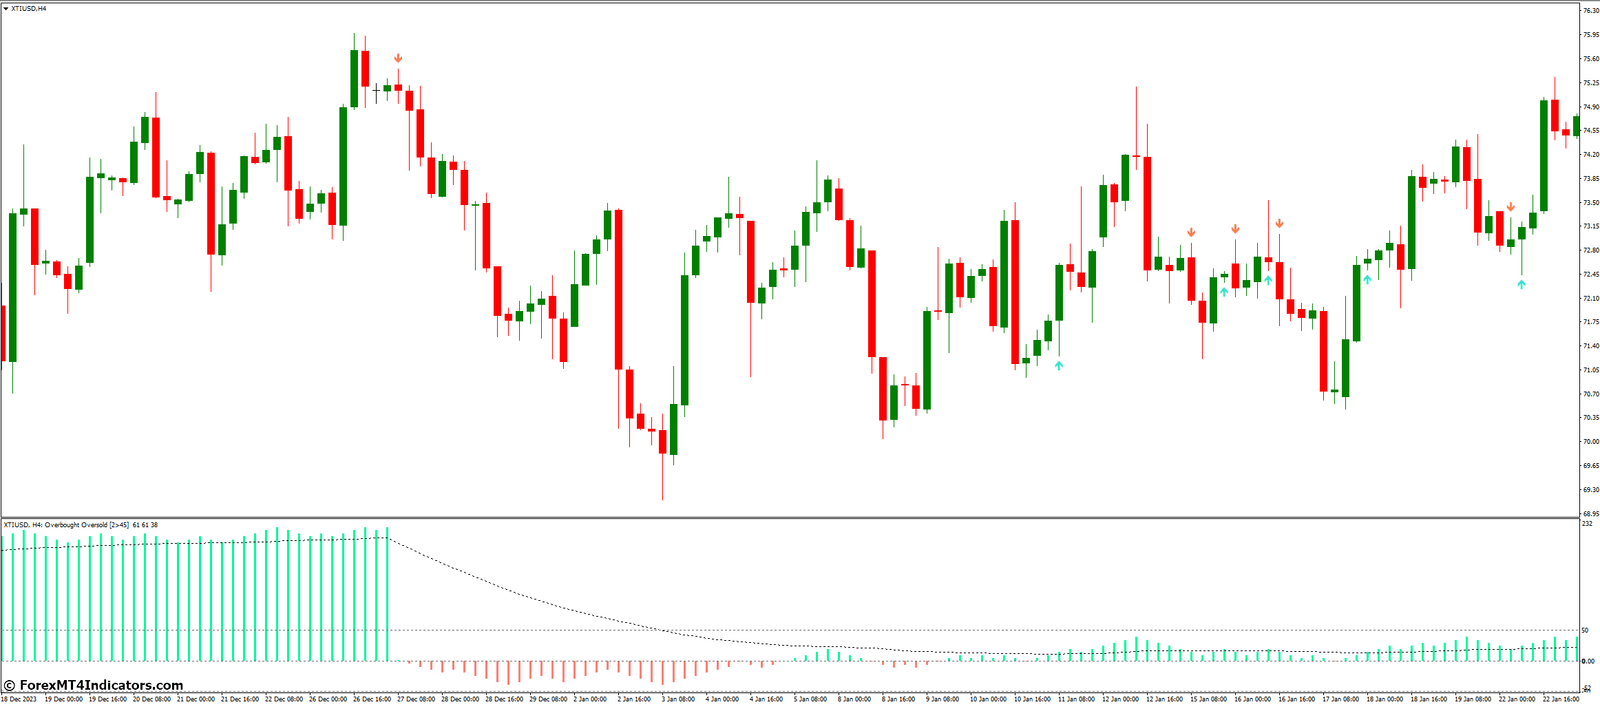
Understanding market sentiment is crucial for any trader. Simply put, it reflects the collective mood of market participants are they feeling optimistic (bullish) or pessimistic (bearish)? Overbought/Oversold indicators play a vital role in gauging this sentiment by identifying potential extremes in price movements.
Demystifying Overbought and Oversold Conditions
Imagine a scenario where a particular stock price keeps surging continuously. This sustained upward trend might indicate an overbought condition, suggesting the price may be due for a correction or pullback. Conversely, an asset witnessing a continuous price decline might be considered oversold, hinting at a possible reversal and potential price increase.
Overbought/Oversold Indicators in MT4
MT4 offers a treasure trove of technical indicators, and Overbought/Oversold variants equip traders with valuable insights. Let’s explore some popular options:
- Relative Strength Index (RSI): This widely used momentum indicator oscillates between 0 and 100. Readings above 70 generally signify overbought territory, while values below 30 suggest a potentially oversold market.
- Stochastic Oscillator (%K, %D): This indicator compares the closing price of an asset to its price range over a specific period. Overbought readings typically exceed 80, while oversold levels fall below 20.
- Bollinger Bands (BB): These bands depict a range of volatility around a moving average. When the price reaches the upper Bollinger Band, it might indicate overbought conditions, while venturing near the lower band suggests a potentially oversold market.
The Limitations of Overbought/Oversold Indicators
While these indicators provide valuable insights, it’s crucial to acknowledge their limitations:
- False Signals and Market Trends: Markets can experience extended periods of consolidation, where prices move sideways. In such scenarios, overbought/oversold indicators might generate misleading signals.
- Confirmation Bias: Traders may misinterpret indicator readings to fit their existing beliefs, leading to biased decision-making.
The Art of Combining Analysis
To truly leverage the power of Overbought/Oversold indicators, it’s essential to combine them with other technical analysis tools:
- Price Action: Analyzing price movements themself provides valuable clues. Look for support and resistance levels, candlestick patterns, and price rejections to confirm indicator signals.
- Volume Analysis: Studying trading volume alongside indicator readings can offer additional context.
Volume Analysis and Advanced Strategies
Building on the concept of combining analysis methods, understanding volume plays a crucial role:
- High volume during overbought readings: This might suggest a stronger conviction from sellers, potentially leading to a more significant price correction.
- Low volume during oversold readings: This could indicate a lack of buying pressure, and the price might not necessarily experience a sharp rebound.
Advanced Strategies with Overbought/Oversold Indicators
By incorporating other technical analysis tools, traders can refine their strategies:
- Divergence Between Indicator and Price: When the indicator and price movement contradict each other, it can signal a potential trend reversal. For instance, if the RSI continues to climb while the price starts to decline, it might suggest a weakening uptrend and a possible price correction.
- Combining with Moving Averages: Moving averages act as dynamic support and resistance levels. When an overbought/oversold signal coincides with a price reaching a key moving average, it can strengthen the potential for a reversal.
Trading Tips and Risk Management
While Overbought/Oversold indicators offer valuable insights, remember these crucial trading principles:
- Avoiding Over-reliance on Single Indicators: No single indicator is a foolproof predictor of future price movements. Always combine indicator signals with other forms of analysis and validate them with price action and market context.
- Implementing Proper Risk Management Strategies: Employing stop-loss orders is essential to limit potential losses. Additionally, practicing proper position sizing ensures you don’t risk a significant portion of your capital on any single trade.
How to Trade with Overbought and Oversold Indicator
Buy Entry
- When the indicator crosses below the oversold threshold, consider a buy entry.
- Look for bullish price action or confirmation from other indicators to validate the buy signal.
Sell Entry
- When the indicator crosses above the overbought threshold, consider a sell entry.
- Look for bearish price action or confirmation from other indicators to validate the sell signal.
Overbought and Oversold Indicator Settings
Conclusion
Understanding Overbought/Oversold indicators equips you with a valuable tool in your technical analysis toolbox. Remember, the financial markets are dynamic and ever-evolving.
Recommended MT4/MT5 Broker
XM Broker
- Free $50 To Start Trading Instantly! (Withdraw-able Profit)
- Deposit Bonus up to $5,000
- Unlimited Loyalty Program
- Award Winning Forex Broker
- Additional Exclusive Bonuses Throughout The Year
- Exclusive 90% VIP Cash Rebates for all Trades!
Already an XM client but missing out on cashback? Open New Real Account and Enter this Partner Code: VIP90
(Free MT4 Indicators Download)

Enter Your Email Address below, download link will be sent to you.


