
Forex candlestick cheat sheet
By Tim Morris · Updated July 2026 · ~4 min read
This free forex candlestick cheat sheet puts the 12 highest-probability patterns — bullish reversals, bearish reversals, and indecision or continuation signals — on a single page. Save it, print it, and keep it beside your charts. Each pattern is explained below.
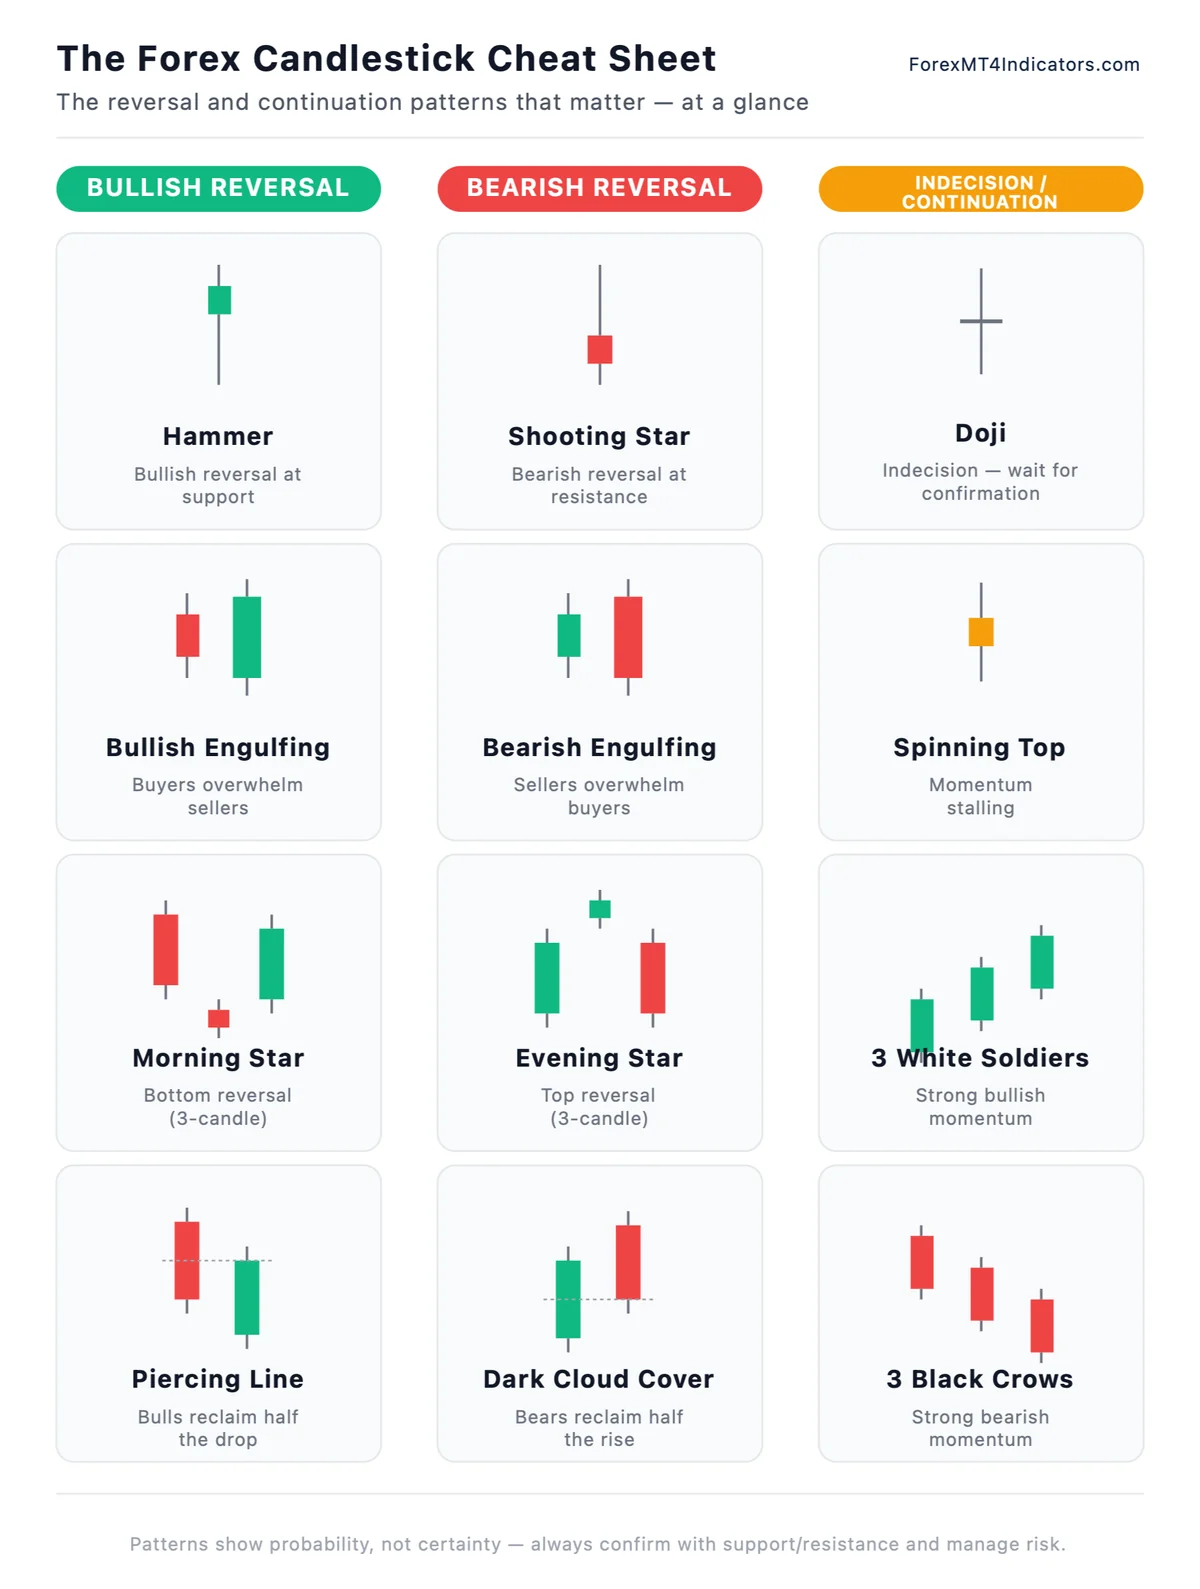
What each pattern means
A candlestick’s body runs from the open to the close; the thin wicks mark the high and low. Green means price closed above its open, red means it closed below. These 12 patterns are the ones worth knowing first.
Bullish reversal — after a decline
- Hammer — a small body with a long lower wick. Sellers pushed price down but buyers rejected the lows; most meaningful at support.
- Bullish engulfing — a green candle whose body fully covers the previous red one. Buyers have overwhelmed sellers.
- Morning star — a three-candle bottom: a red candle, a small-bodied “star”, then a strong green candle closing well into the first.
- Piercing line — a green candle that opens below the prior red candle’s close, then closes back above the midpoint of that red candle’s body, reclaiming more than half of its drop.
Bearish reversal — after an advance
- Shooting star — a small body with a long upper wick. Buyers pushed up but sellers rejected the highs; most meaningful at resistance.
- Bearish engulfing — a red candle whose body fully covers the previous green one. Sellers have overwhelmed buyers.
- Evening star — the top-reversal mirror of the morning star: green, a small star, then a strong red candle closing into the first.
- Dark cloud cover — a red candle that opens above the prior green candle’s close, then closes back below the midpoint of that green candle’s body, erasing more than half of its rise.
Indecision & continuation
- Doji — open and close are nearly equal, forming a cross. Neither side is in control; wait for confirmation.
- Spinning top — a small body with wicks on both sides. Momentum is stalling and the trend may be pausing.
- Three white soldiers — three strong green candles in a row, showing strong bullish momentum; often a reversal after a decline.
- Three black crows — three strong red candles in a row, showing strong bearish momentum; often a reversal after an advance.
How to use this cheat sheet
- Read patterns in context. A pattern is a clue, not a command — confirm it with the trend and with support or resistance nearby.
- Higher timeframes are more reliable. The same pattern generally carries more weight on the 4-hour or daily than on the 1-minute.
- Define your risk first. Decide where your stop goes before you enter and size the position accordingly — our free position size calculator does the math for you.
Frequently asked questions
How do you read a candlestick?
The body shows the open and close for the period; the wicks show the high and low. A green (or white) body closed above its open, a red (or black) body closed below. The shape tells you who won the period — buyers or sellers.
What is the most reliable candlestick pattern?
No pattern is guaranteed. Engulfing patterns and the morning/evening star are among the most widely watched, and any pattern is stronger when it appears at support or resistance on a higher timeframe.
Are candlestick patterns profitable?
Candlesticks are a reading tool, not a system. They show probability, not certainty, and work best combined with context and disciplined risk management — they don’t guarantee a profit.
Educational only — not financial advice. Trading forex carries a high level of risk; never risk money you can’t afford to lose. Patterns show probability, not certainty.
Ready to trade them?
Get the full Candlestick Playbook
- ✓Every pattern with exact entries, stops & exits
- ✓How to trade them with support & resistance
- ✓Real annotated MT4 / MT5 chart examples — 76 pages
Instant PDF download · one-time payment. Educational content — trading carries risk.