

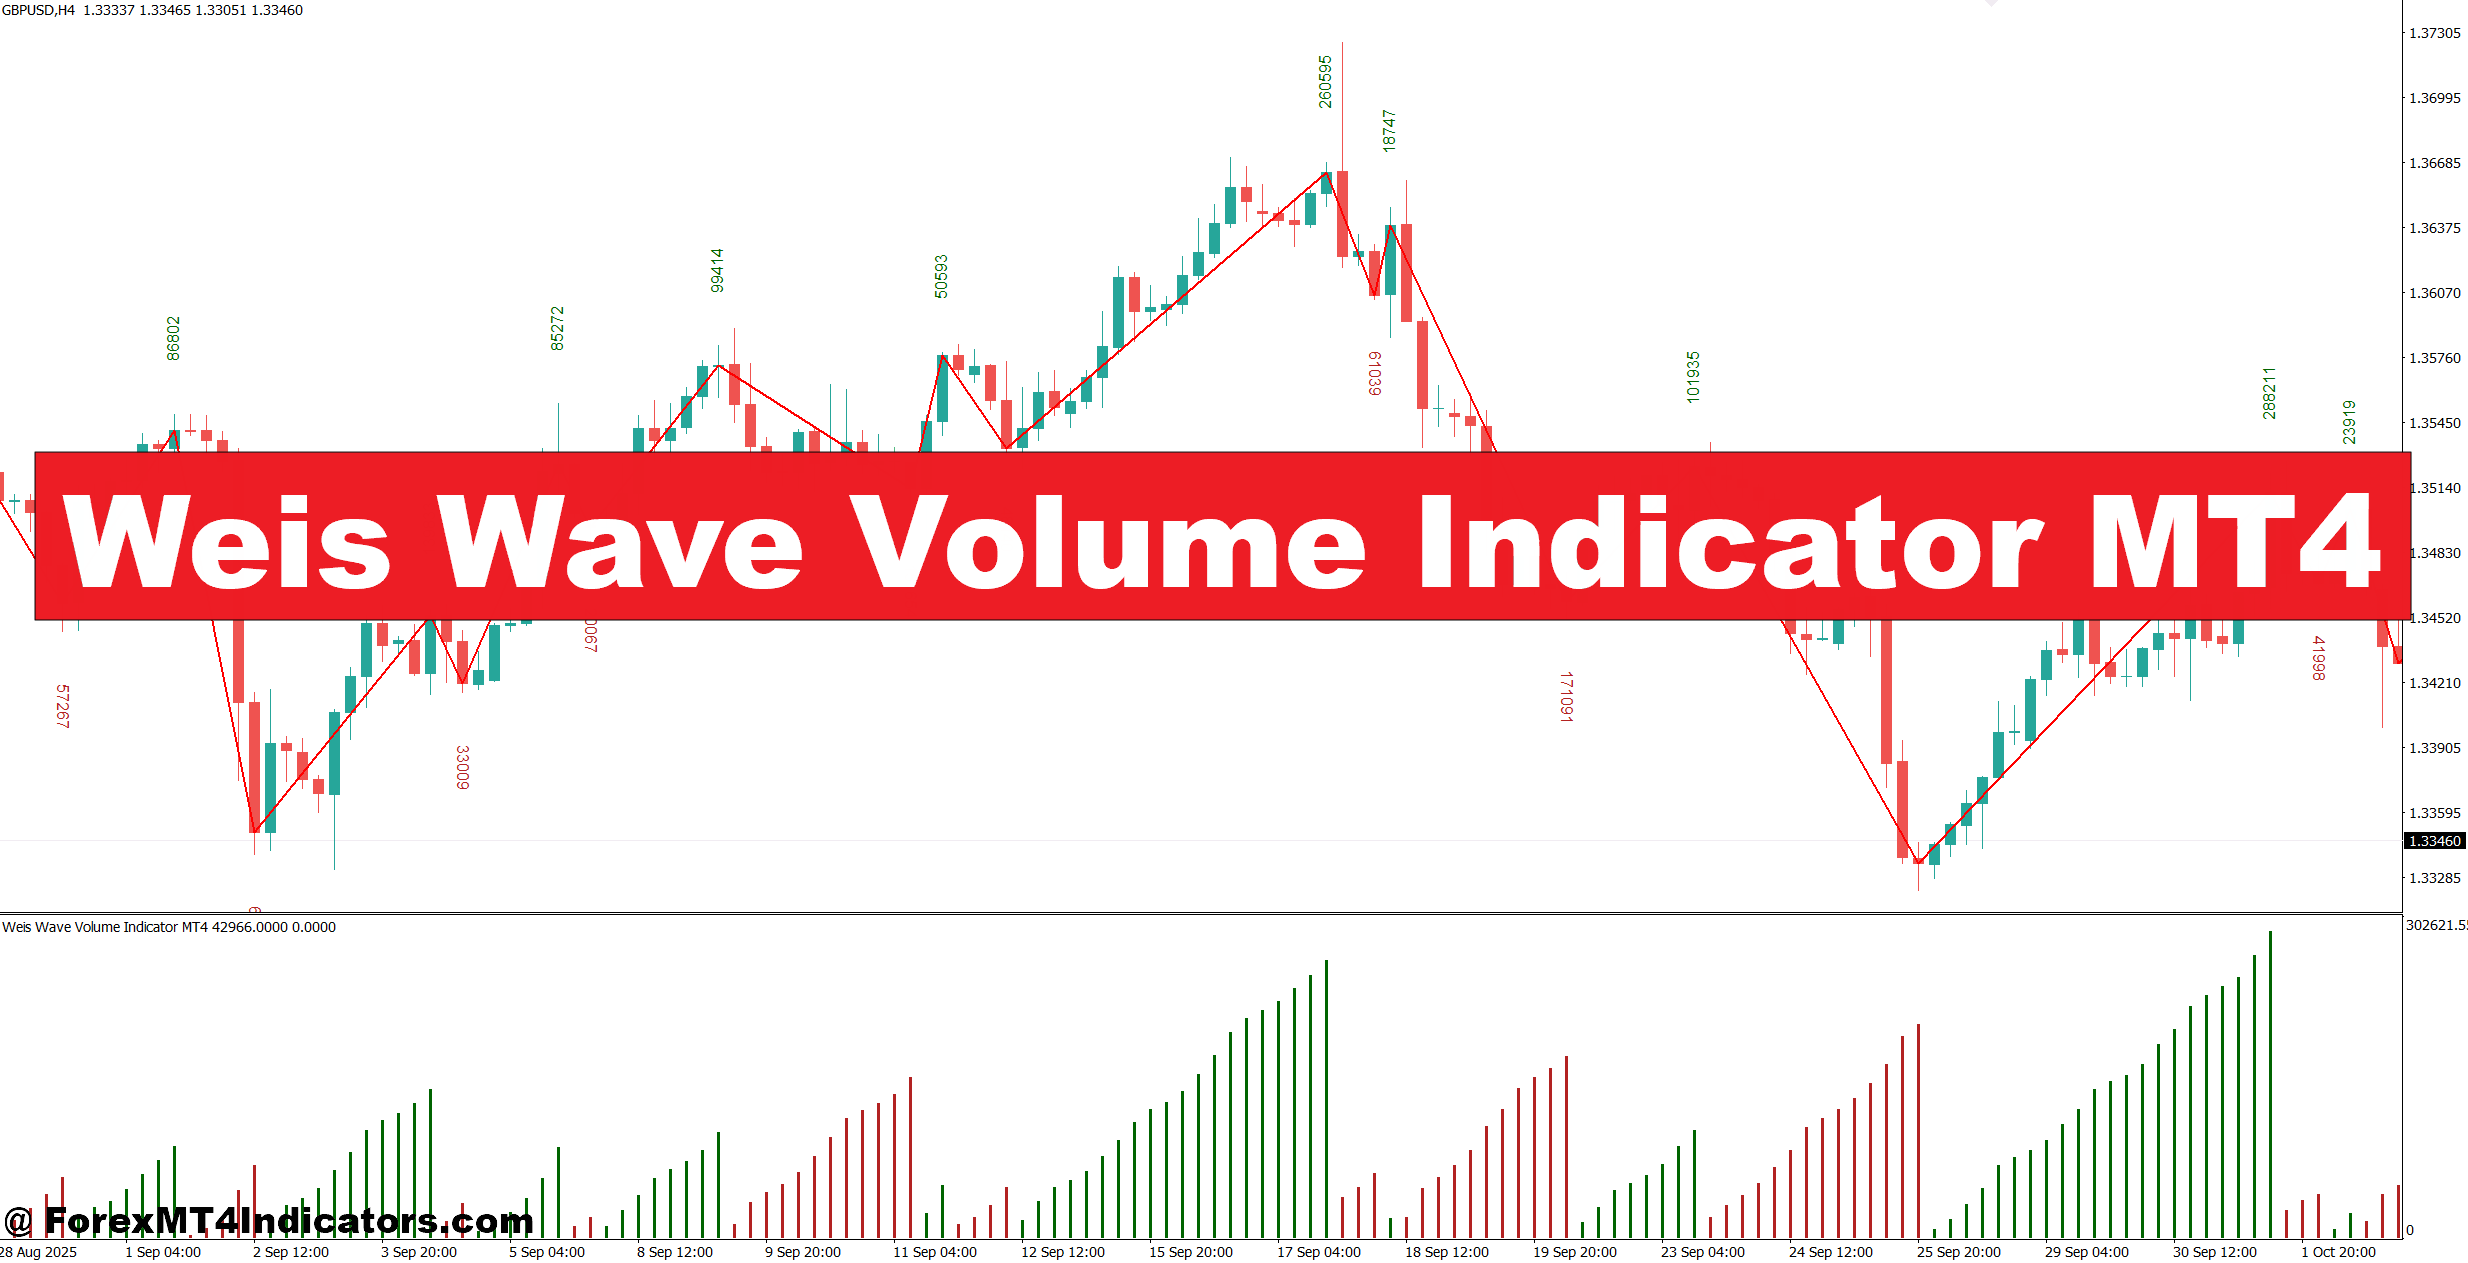
The Weis Wave Volume Indicator MT4 helps traders look beyond candles by combining price movement with volume analysis. Instead of focusing on every individual bar, it groups price swings into volume waves, making it easier to spot buying and selling pressure. This gives traders another way to judge whether a trend has real strength or is beginning to fade.
Many traders use traditional volume indicators, but they often create too much noise during choppy conditions. The Weis Wave Volume Indicator MT4 simplifies the information by highlighting meaningful waves instead of every small fluctuation. That makes trend analysis easier and provides a clearer picture before entering a trade. Here’s how the indicator works and where it fits into a practical trading strategy.
What Is the Weis Wave Volume Indicator MT4?
The Weis Wave Volume Indicator MT4 is a volume-based technical analysis tool inspired by Richard D. Wyckoff’s market principles and later expanded by trader David Weis. It measures the amount of trading volume during each directional price swing instead of displaying volume on every candle.
When price moves in one direction, the indicator keeps adding volume to that wave. Once price changes direction by a predefined amount, the current wave ends, and a new one begins. This approach filters out much of the short-term market noise.
Unlike a standard volume histogram, traders can quickly compare one buying wave with the previous buying wave or one selling wave with earlier selling pressure. That comparison often reveals whether institutional participation is increasing or weakening.
How the Indicator Calculates Market Pressure
The logic behind the indicator is straightforward. It tracks price movement using a reversal value or swing threshold. As long as price continues moving in the same direction, the indicator accumulates tick volume from every candle within that move.
When the required reversal occurs, the completed wave displays its total accumulated volume, and a new wave starts in the opposite direction.
For example:
- An upward move lasting 18 candles may accumulate 9,800 units of tick volume.
- The next upward wave reaches a higher price but records only 6,900 units.
- Price makes a new high, but buying participation is weaker than before.
That difference can warn traders that momentum is slowing even though price continues rising.
MT4 uses tick volume instead of centralized exchange volume because the forex market has no single exchange. While tick volume isn’t identical to actual traded contracts, many professional traders find it highly correlated with market activity.
Using the Weis Wave Volume Indicator MT4 in Real Trading
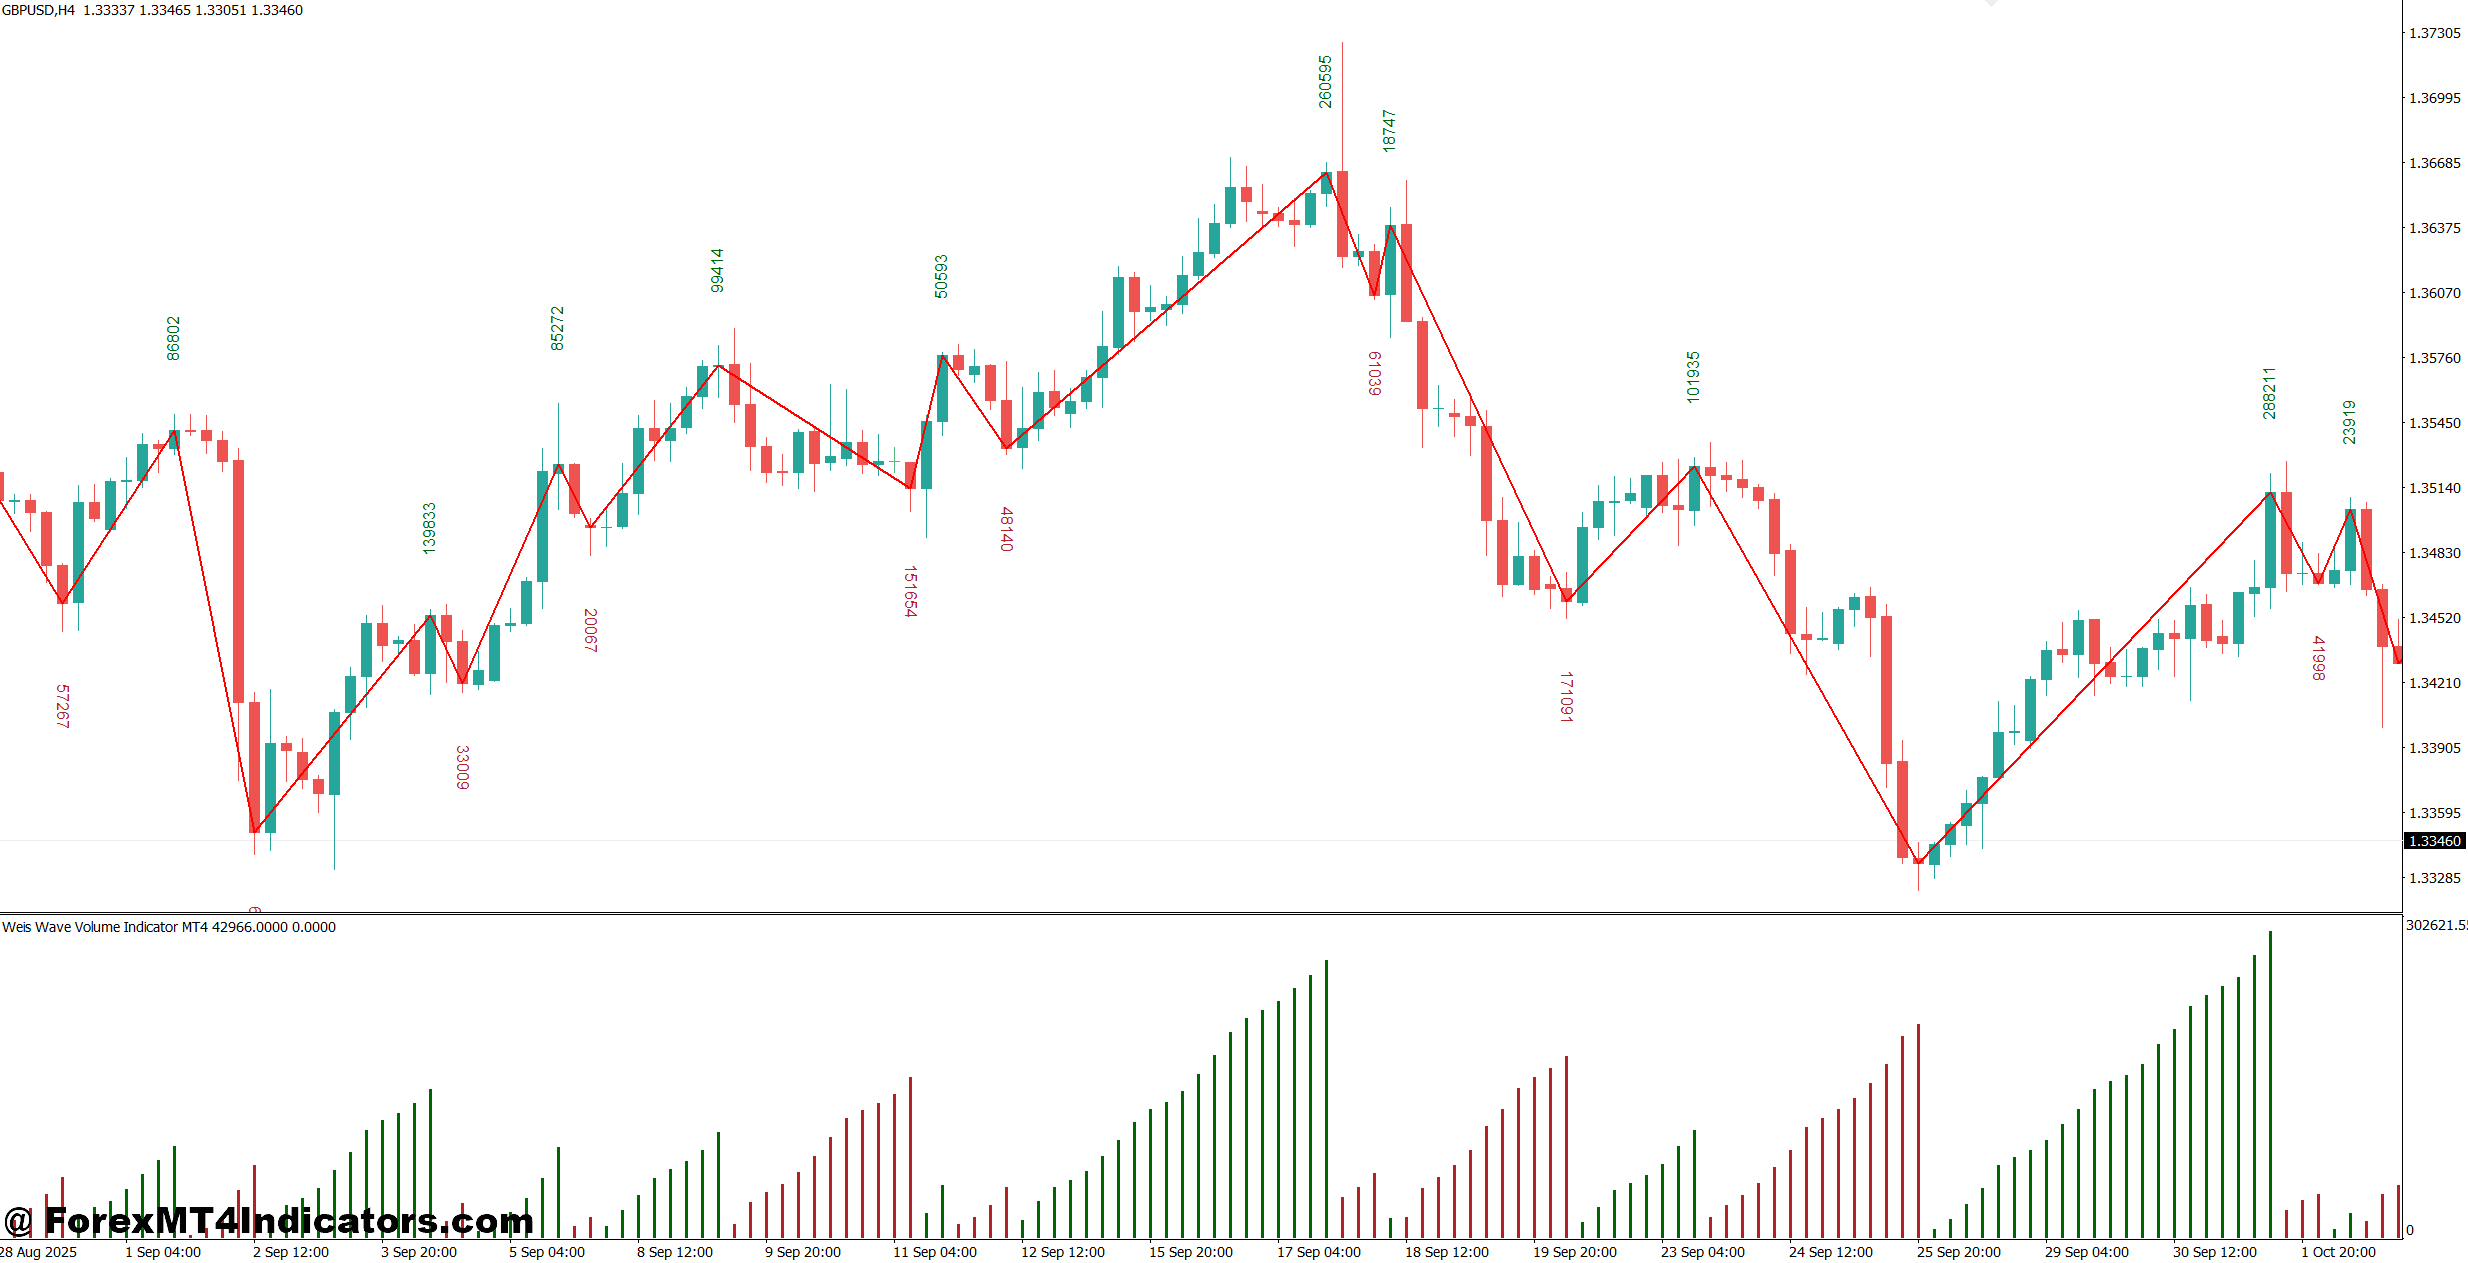
The indicator works best when traders combine it with market structure instead of treating it as a stand-alone signal generator.
Imagine EUR/USD on the 1-hour chart. Price breaks above resistance at 1.1080 after several hours of consolidation. The latest bullish wave shows noticeably higher accumulated volume than the previous two buying waves. At the same time, price closes above resistance with strong momentum. That combination suggests buyers are actively supporting the breakout rather than chasing a temporary spike.
Now consider GBP/USD on the 4-hour chart. Price prints another higher high, but the latest bullish wave carries much lower volume than the previous rally. A bearish engulfing candle forms near resistance around 1.2860. This doesn’t automatically create a sell signal, but it warns traders that buying pressure may be weakening.
When testing this on volatile NFP days, many traders notice that wave volume increases dramatically during the first few minutes after the release. Waiting for the first wave to finish before making a decision often helps avoid getting caught in fast whipsaws.
Another useful application involves trend continuation. During a healthy uptrend, corrective selling waves usually show lower volume than bullish waves. If corrective waves suddenly begin carrying equal or greater volume, the trend deserves another look because sellers may be gaining control.
Trading forex carries substantial risk. No indicator guarantees profits. Traders should always confirm signals with price action, support and resistance levels, and sound risk management.
Best Settings and Customization
Most MT4 versions allow traders to adjust the reversal amount or swing sensitivity. Smaller values create more waves, while larger settings filter out minor price fluctuations.
Many traders prefer these starting points:
Scalping (M5-M15)
- Lower reversal settings
- Faster wave detection
- Works well for EUR/USD and GBP/USD during London and New York sessions
Intraday Trading (M30-H1)
- Medium reversal settings
- Better balance between sensitivity and market noise
- Suitable for major forex pairs and gold
Swing Trading (H4-Daily)
- Larger reversal values
- Focuses only on major buying and selling swings
- Reduces false reversals during normal pullbacks
Some traders also combine the Weis Wave Volume Indicator MT4 with a 50-period Exponential Moving Average. They only look for bullish wave confirmation above the moving average and bearish confirmation below it. This simple filter removes many low-quality setups during sideways markets.
Advantages, Drawbacks, and Comparison with Similar Indicators
One of the biggest strengths of the Weis Wave approach is its ability to organize volume into meaningful price swings. Traders spend less time interpreting dozens of separate volume bars and more time comparing actual buying and selling campaigns.
Another benefit is that divergence becomes easier to spot. Rising prices supported by shrinking wave volume often deserve extra caution, especially near established resistance.
The indicator also has limitations. It depends on tick volume, which varies slightly between brokers. Different reversal settings can produce different wave structures, so traders should test several configurations before using it in live trading. During slow ranging markets, wave signals may become inconsistent because volume differences are relatively small.
Compared with the On Balance Volume (OBV) indicator, Weis Wave provides more visual context because volume is grouped into individual swings rather than a continuous cumulative line. Compared with Volume Profile, it focuses on the strength of directional moves instead of showing where trading activity occurred by price level.
Many experienced traders use Weis Wave alongside support and resistance zones, trendlines, and candlestick confirmation instead of replacing those tools. That combination often creates higher-quality trade ideas than relying on volume alone.
How to Trade with Weis Wave Volume Indicator MT4
Buy Entry
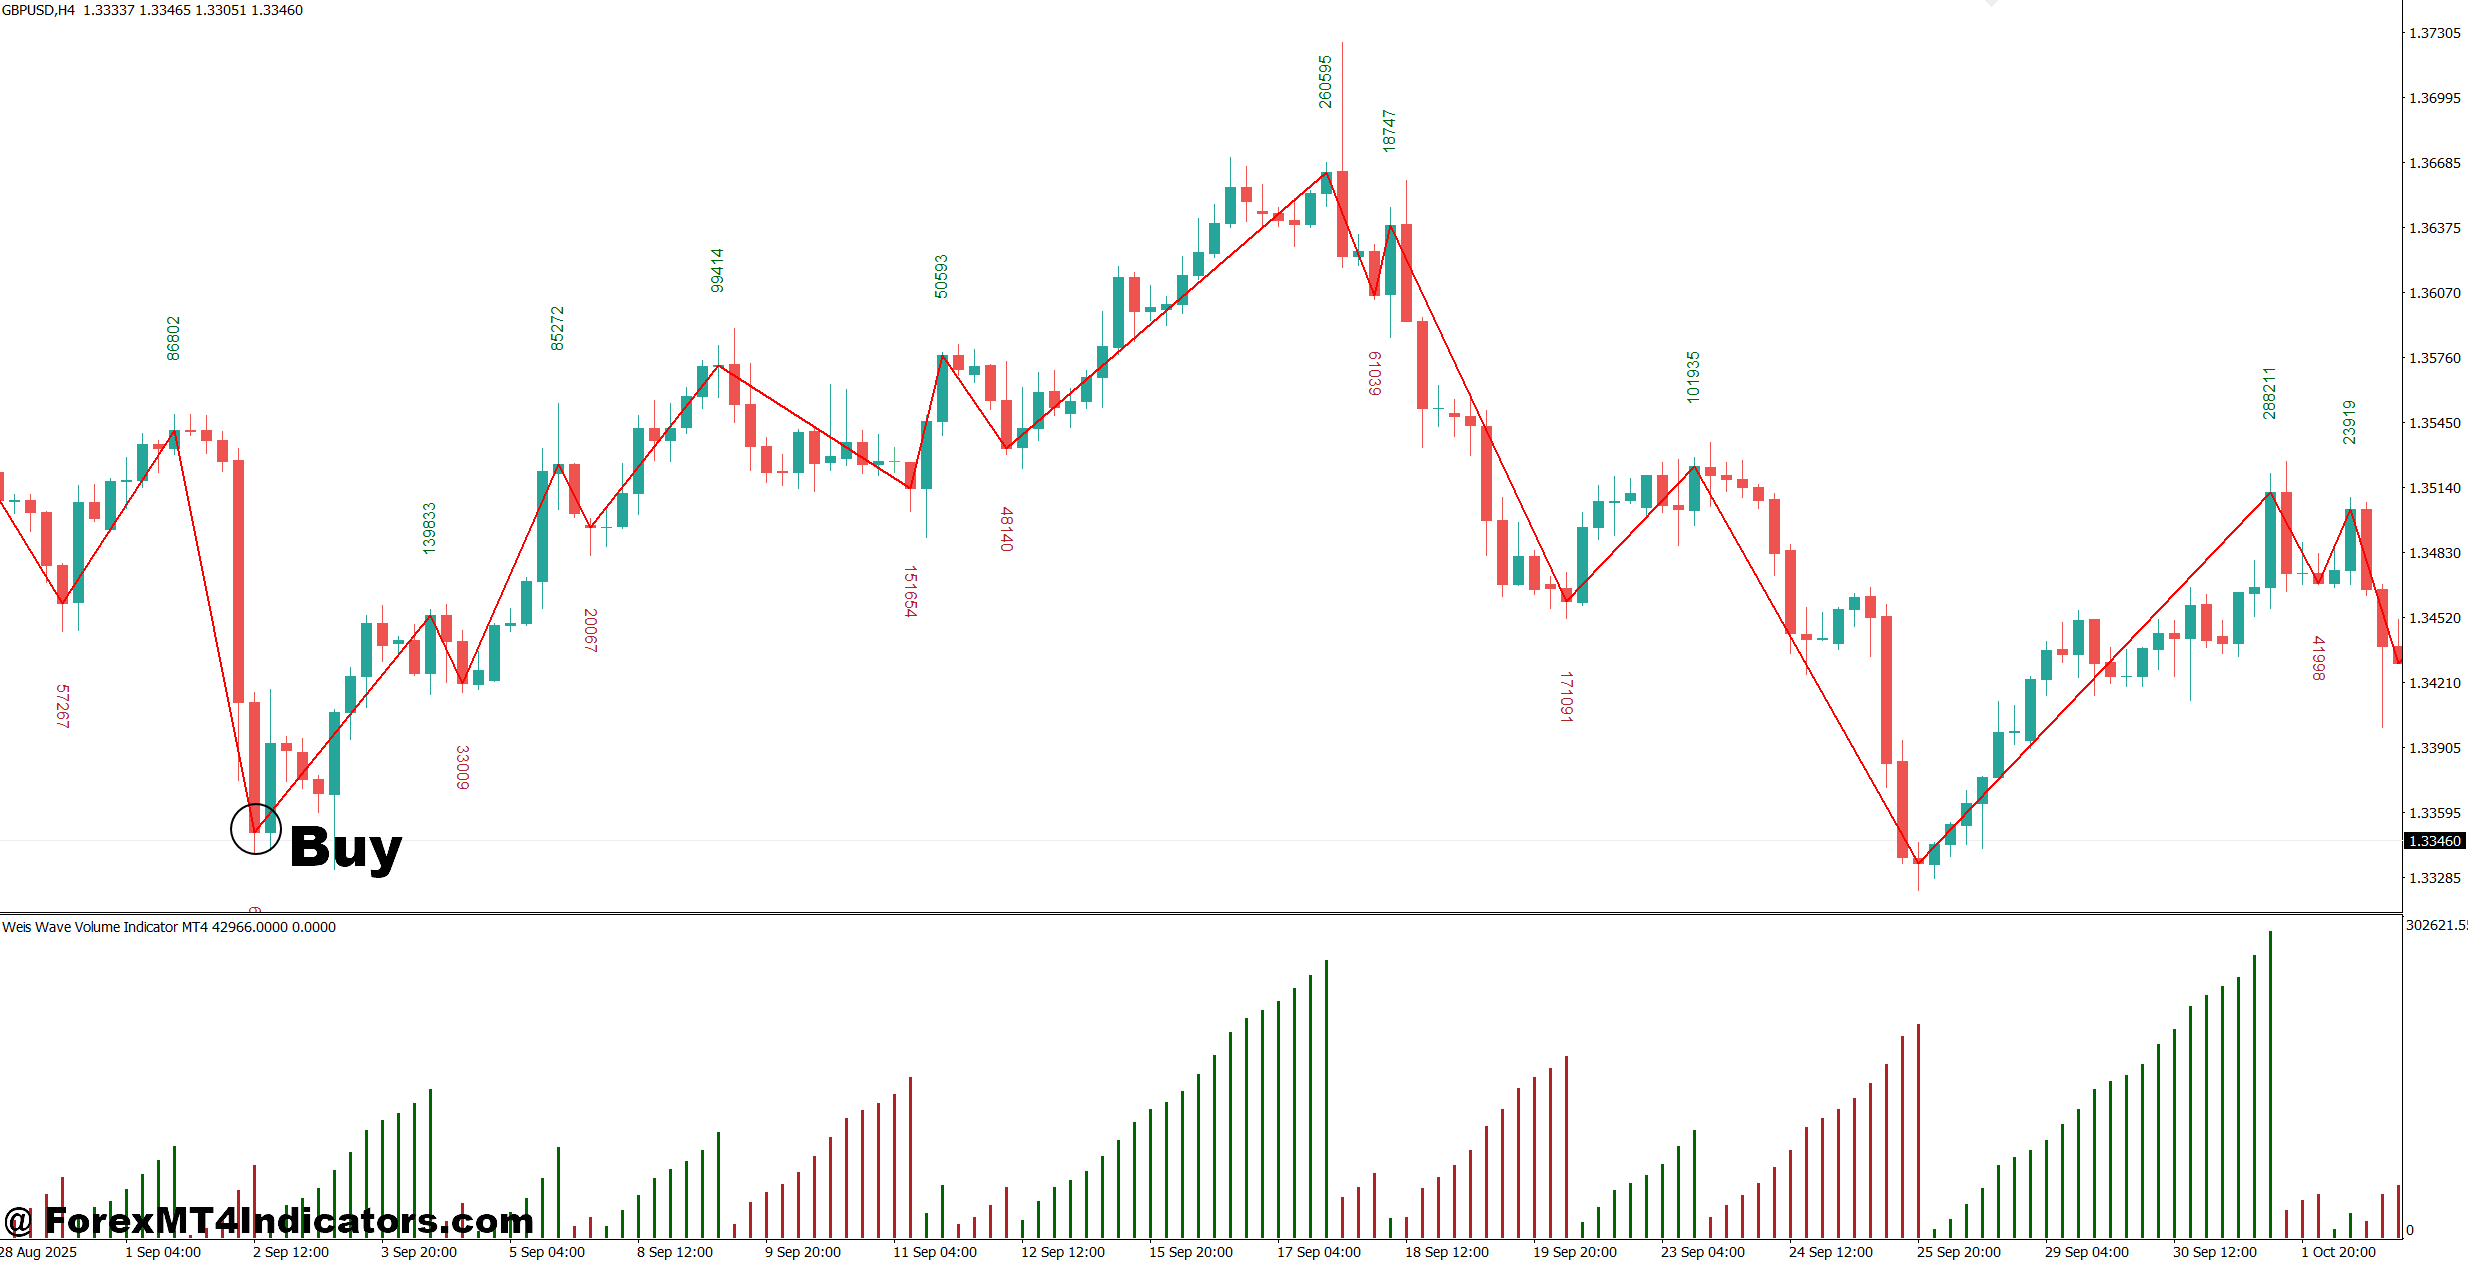
- Confirm rising wave volume – Enter a buy when a bullish wave shows 15-20% higher volume than the previous wave on the 1-hour EUR/USD chart.
- Trade breakout confirmation – Buy after price closes 10-15 pips above resistance with a strong bullish volume wave.
- Follow the main trend – Take buy trades only when price stays above the 50 EMA on the 4-hour timeframe.
- Buy after a pullback – Enter when a pullback forms a lower-volume bearish wave and bullish momentum returns.
- Place a protective stop – Set the stop loss 20-30 pips below the recent swing low to control risk.
- Target a healthy reward – Aim for at least a 1:2 risk-to-reward ratio or the next resistance level.
- Avoid low-volume sessions – Skip buy signals during quiet Asian sessions unless volume clearly increases.
- Wait for candle confirmation – Don’t buy until the breakout candle closes with strong bullish pressure.
Sell Entry
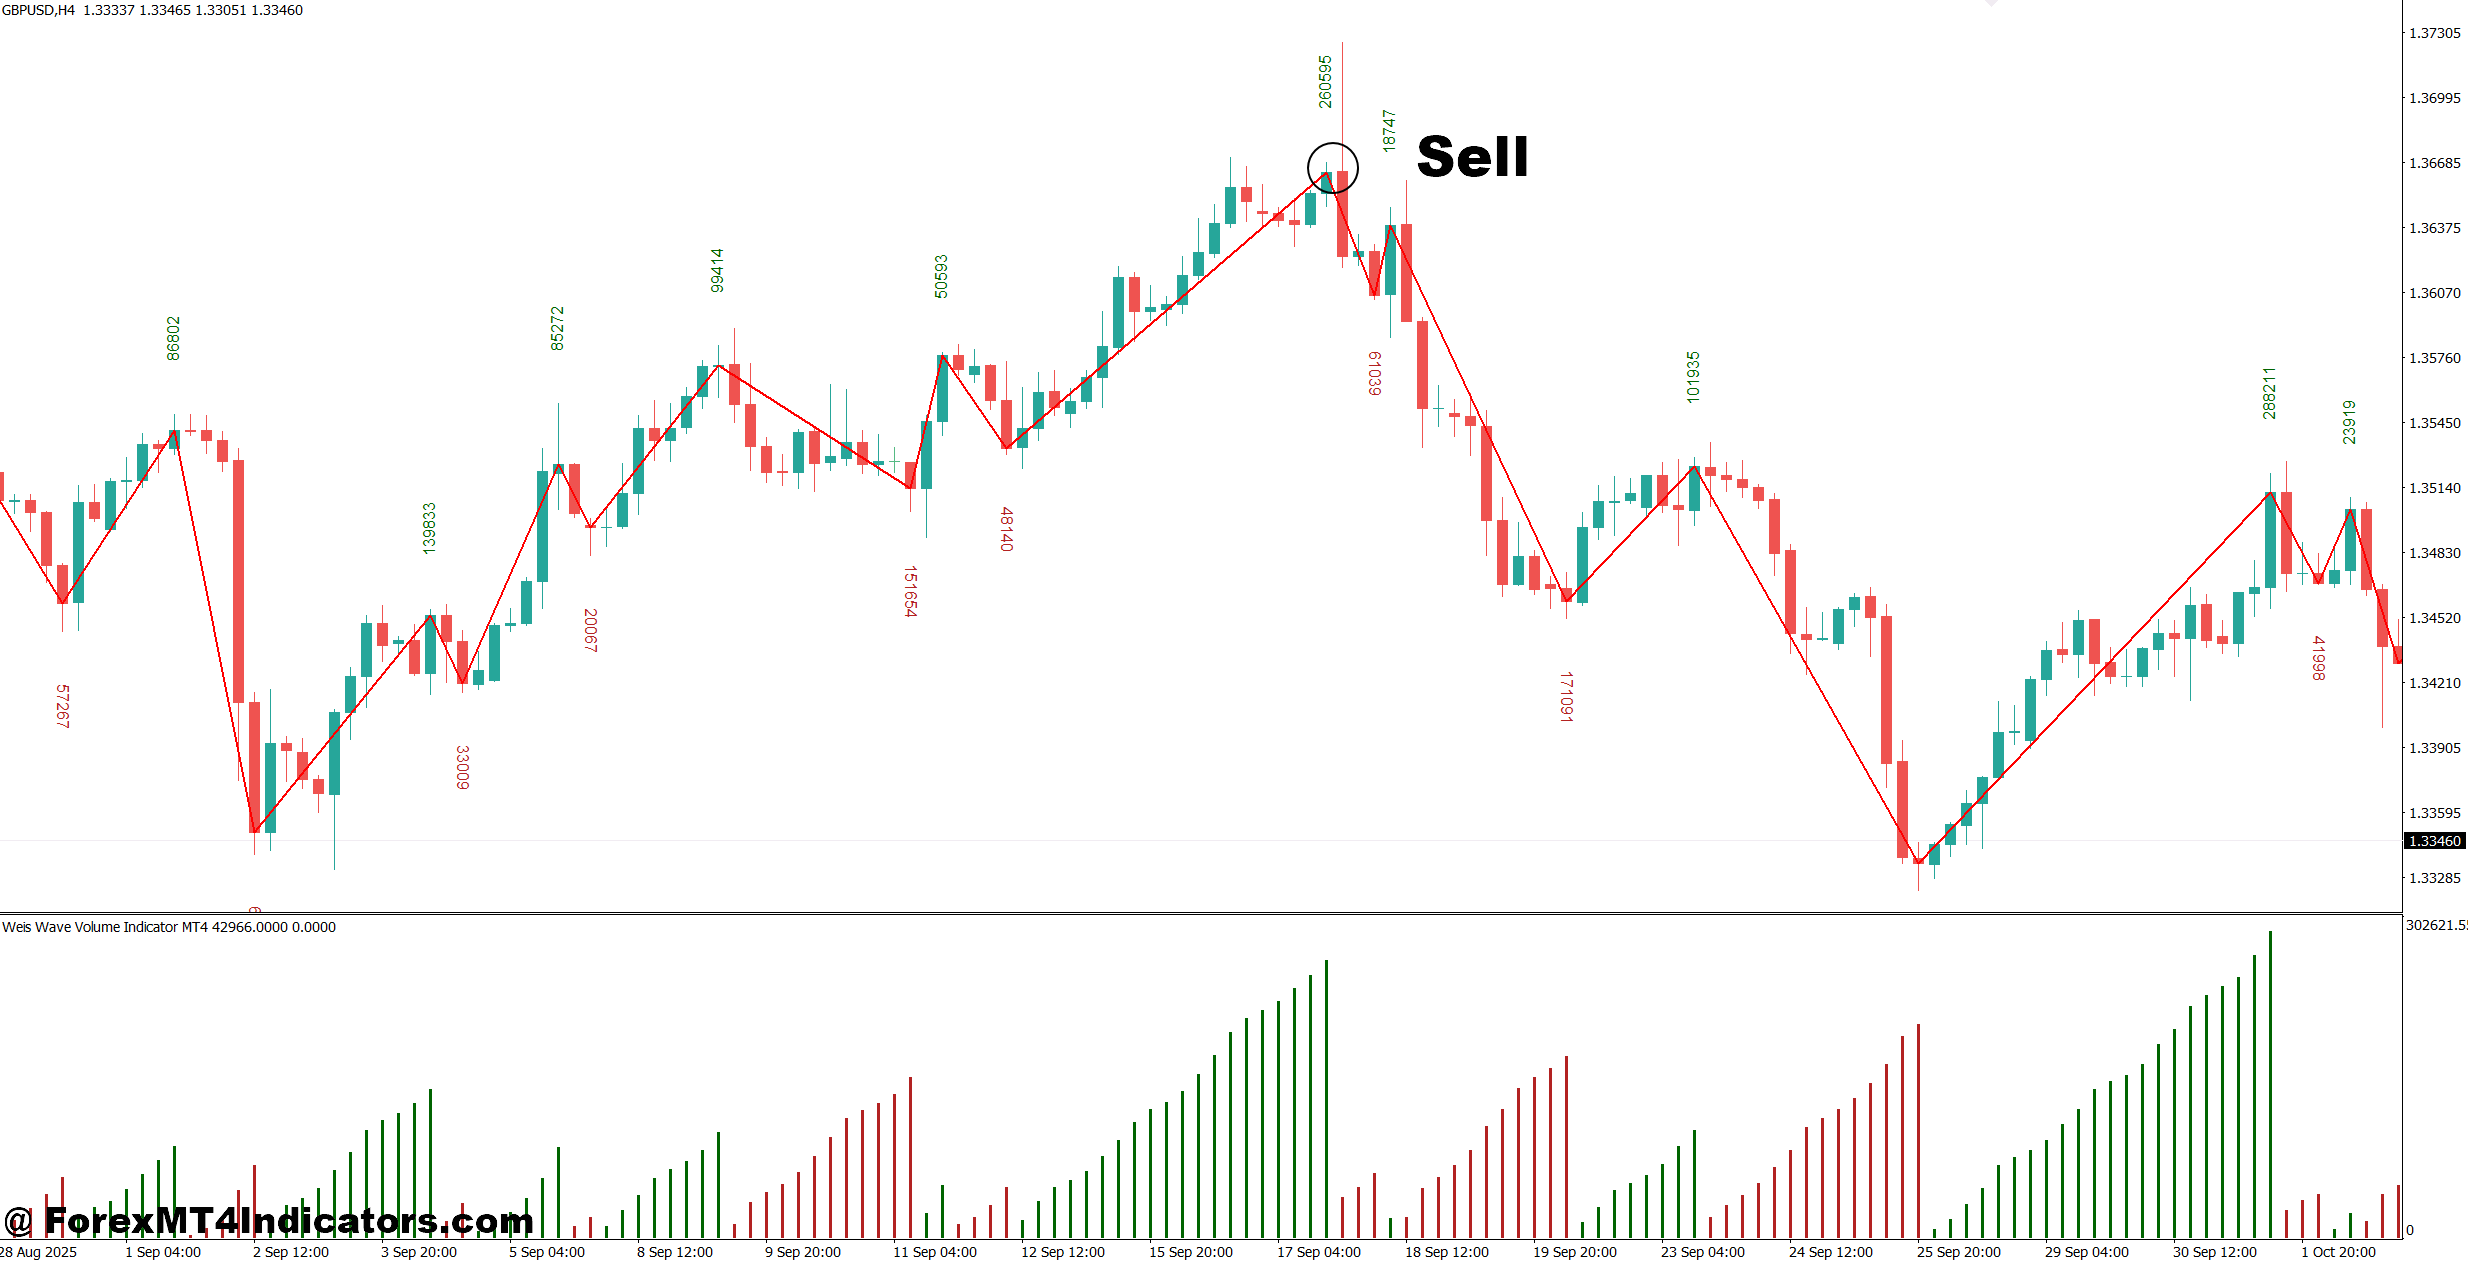
- Confirm increasing selling volume – Sell when a bearish wave records 15-20% more volume than the previous selling wave on GBP/USD 1-hour.
- Sell below support – Enter after price closes 10-15 pips below support with strong bearish volume.
- Trade with the trend – Take sell setups only when price remains below the 50 EMA on the 4-hour chart.
- Sell after a weak rally – Enter when a bullish retracement shows lower volume before sellers return.
- Protect your position – Place the stop loss 20-30 pips above the latest swing high.
- Lock in profits wisely – Target the next support level or maintain a 1:2 risk-to-reward ratio.
- Avoid major news events – Skip sell entries during high-impact releases like NFP or FOMC because volume can become misleading.
- Ignore sideways markets – Don’t sell when wave volume stays flat and price moves within a narrow range on the daily chart.
The Weis Wave Volume Indicator MT4 offers traders a practical way to study buying and selling pressure through volume waves rather than individual candles. Its biggest strengths include clearer trend confirmation, easier volume comparison between price swings, and better insight into momentum changes. It also encourages traders to combine volume with market structure instead of chasing every breakout. At the same time, it has limits because tick volume isn’t perfect and settings require testing for different trading styles. Used with disciplined risk management and solid price action analysis, the Weis Wave Volume Indicator MT4 can become a valuable part of a balanced forex trading plan instead of serving as the only reason to enter a trade.
Level up your trading
Learn to read the chart — not just the indicator
eBook · Instant PDF
Video Course · 12 modules
Recommended MT4/MT5 Brokers
- ✓ *FREE *$50 to start (withdrawable)
- ✓ Deposit bonus up to $5,000
- ✓ Negative balance protection
Trading forex and CFDs carries a significant risk of loss and is not suitable for everyone. Broker links are affiliate links — we may earn a commission at no cost to you.
Free MT4 Indicator Download

Enter Your Email Address below, download link will be sent to you.