
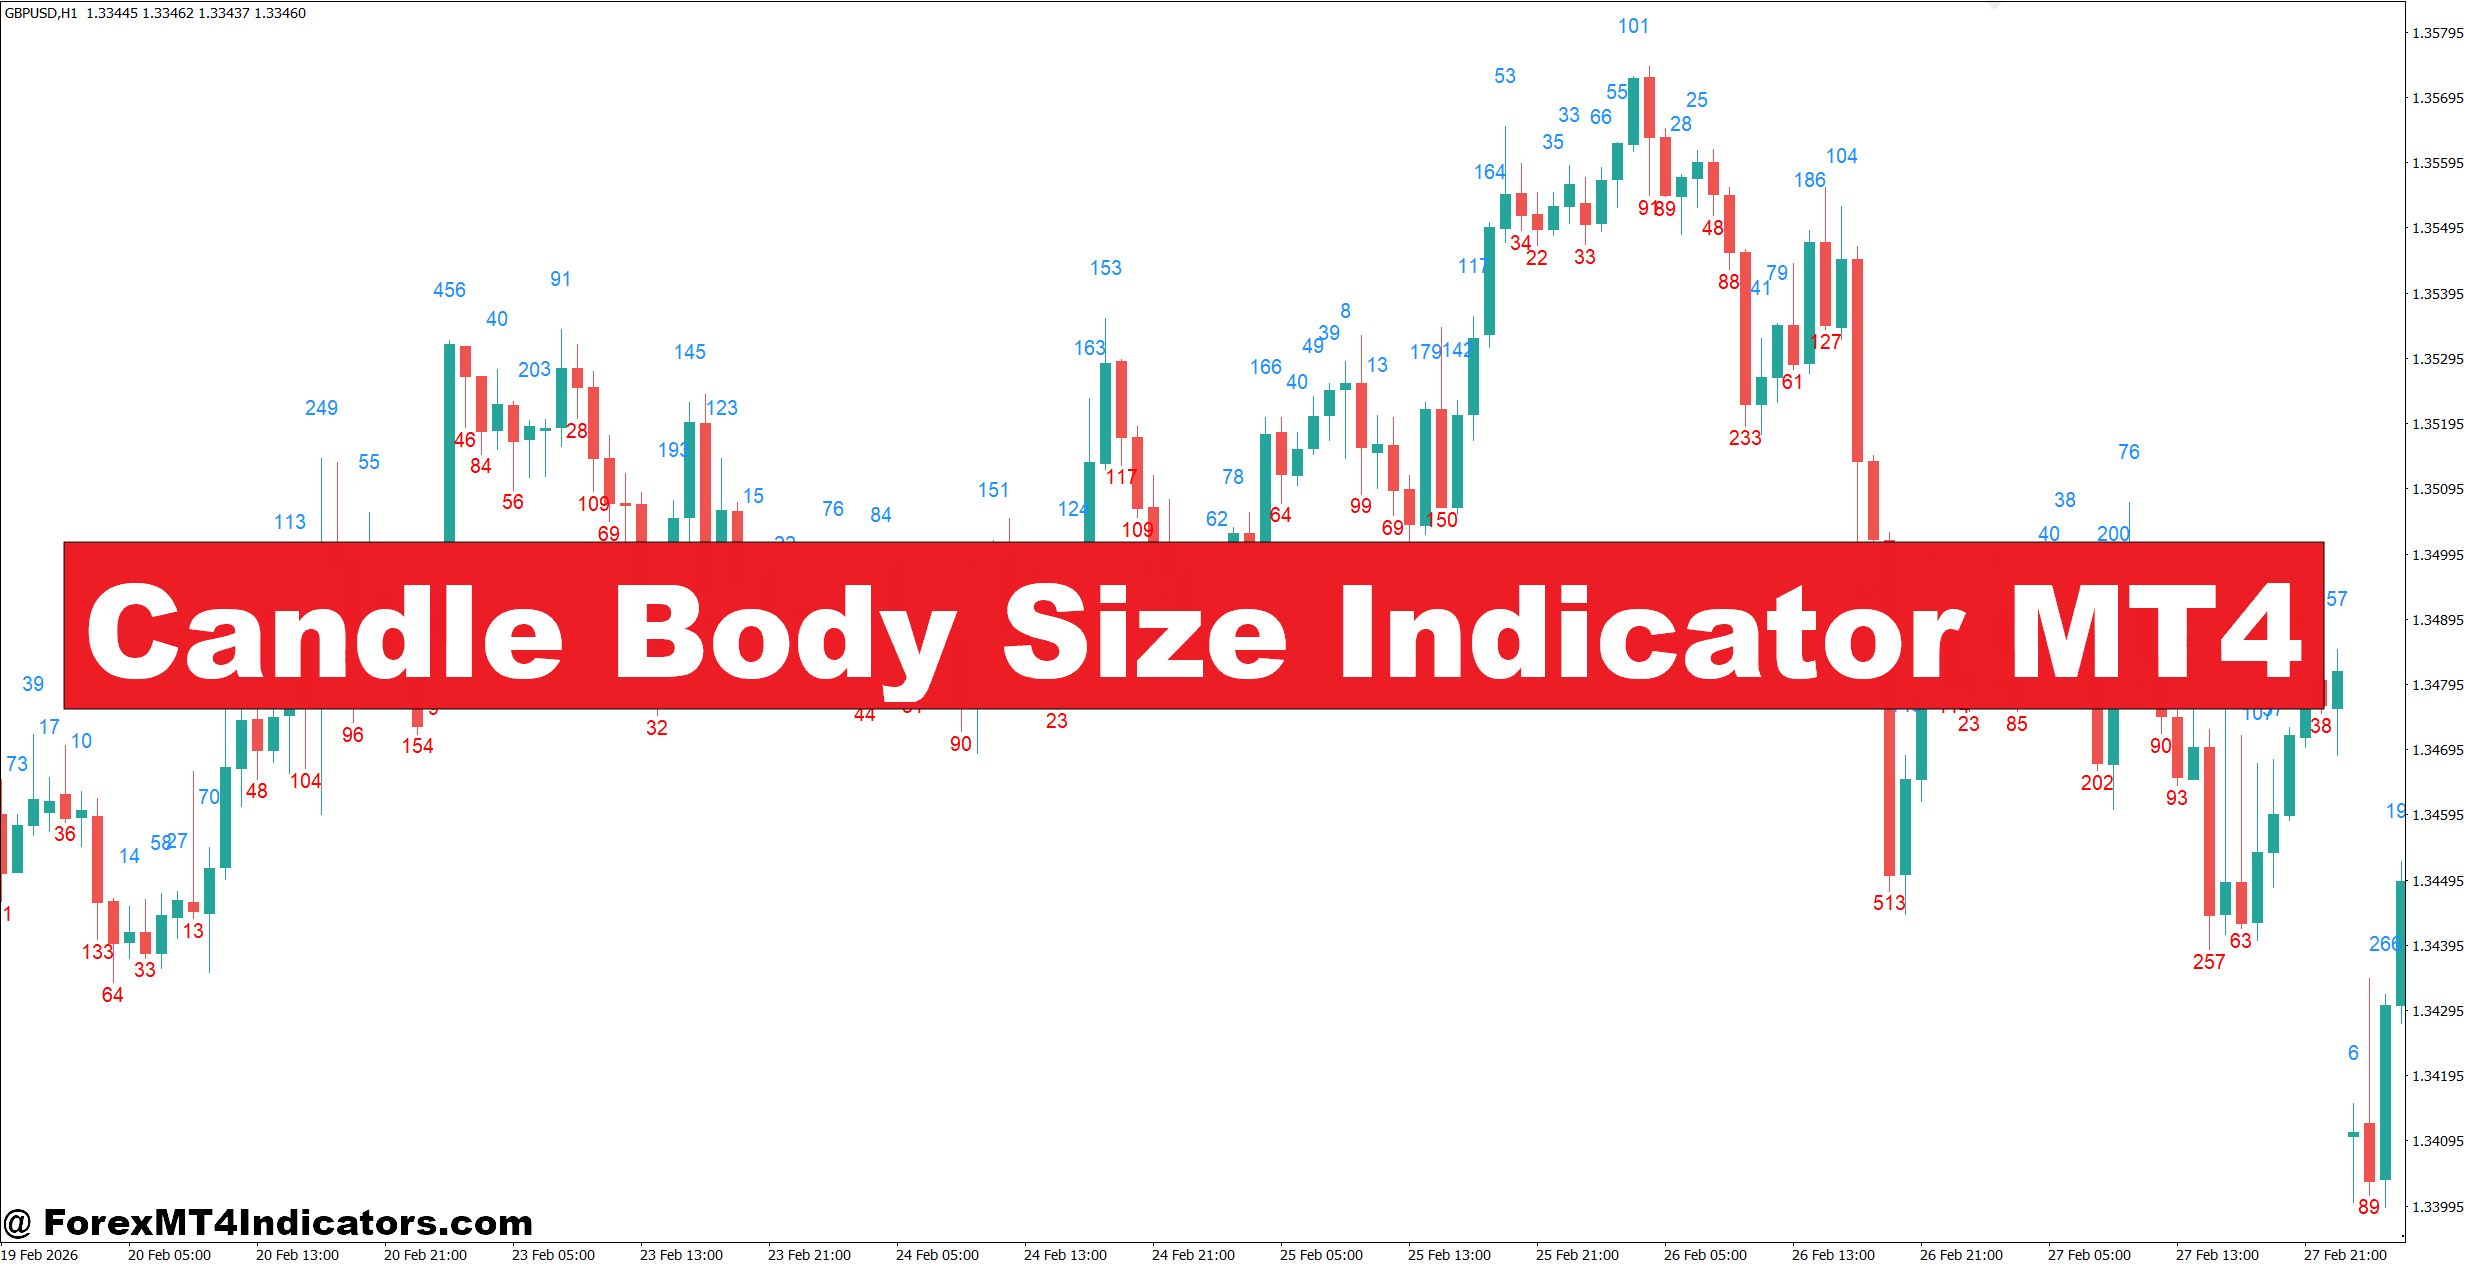
The Candle Body Size Indicator MT4 helps solve that problem by measuring and displaying the size of each candle’s body instead of relying on guesswork. It highlights when buyers or sellers are showing unusual strength, making it easier to spot momentum before entering a trade. During volatile sessions like the London open, this extra information can help traders separate meaningful price moves from ordinary market noise.
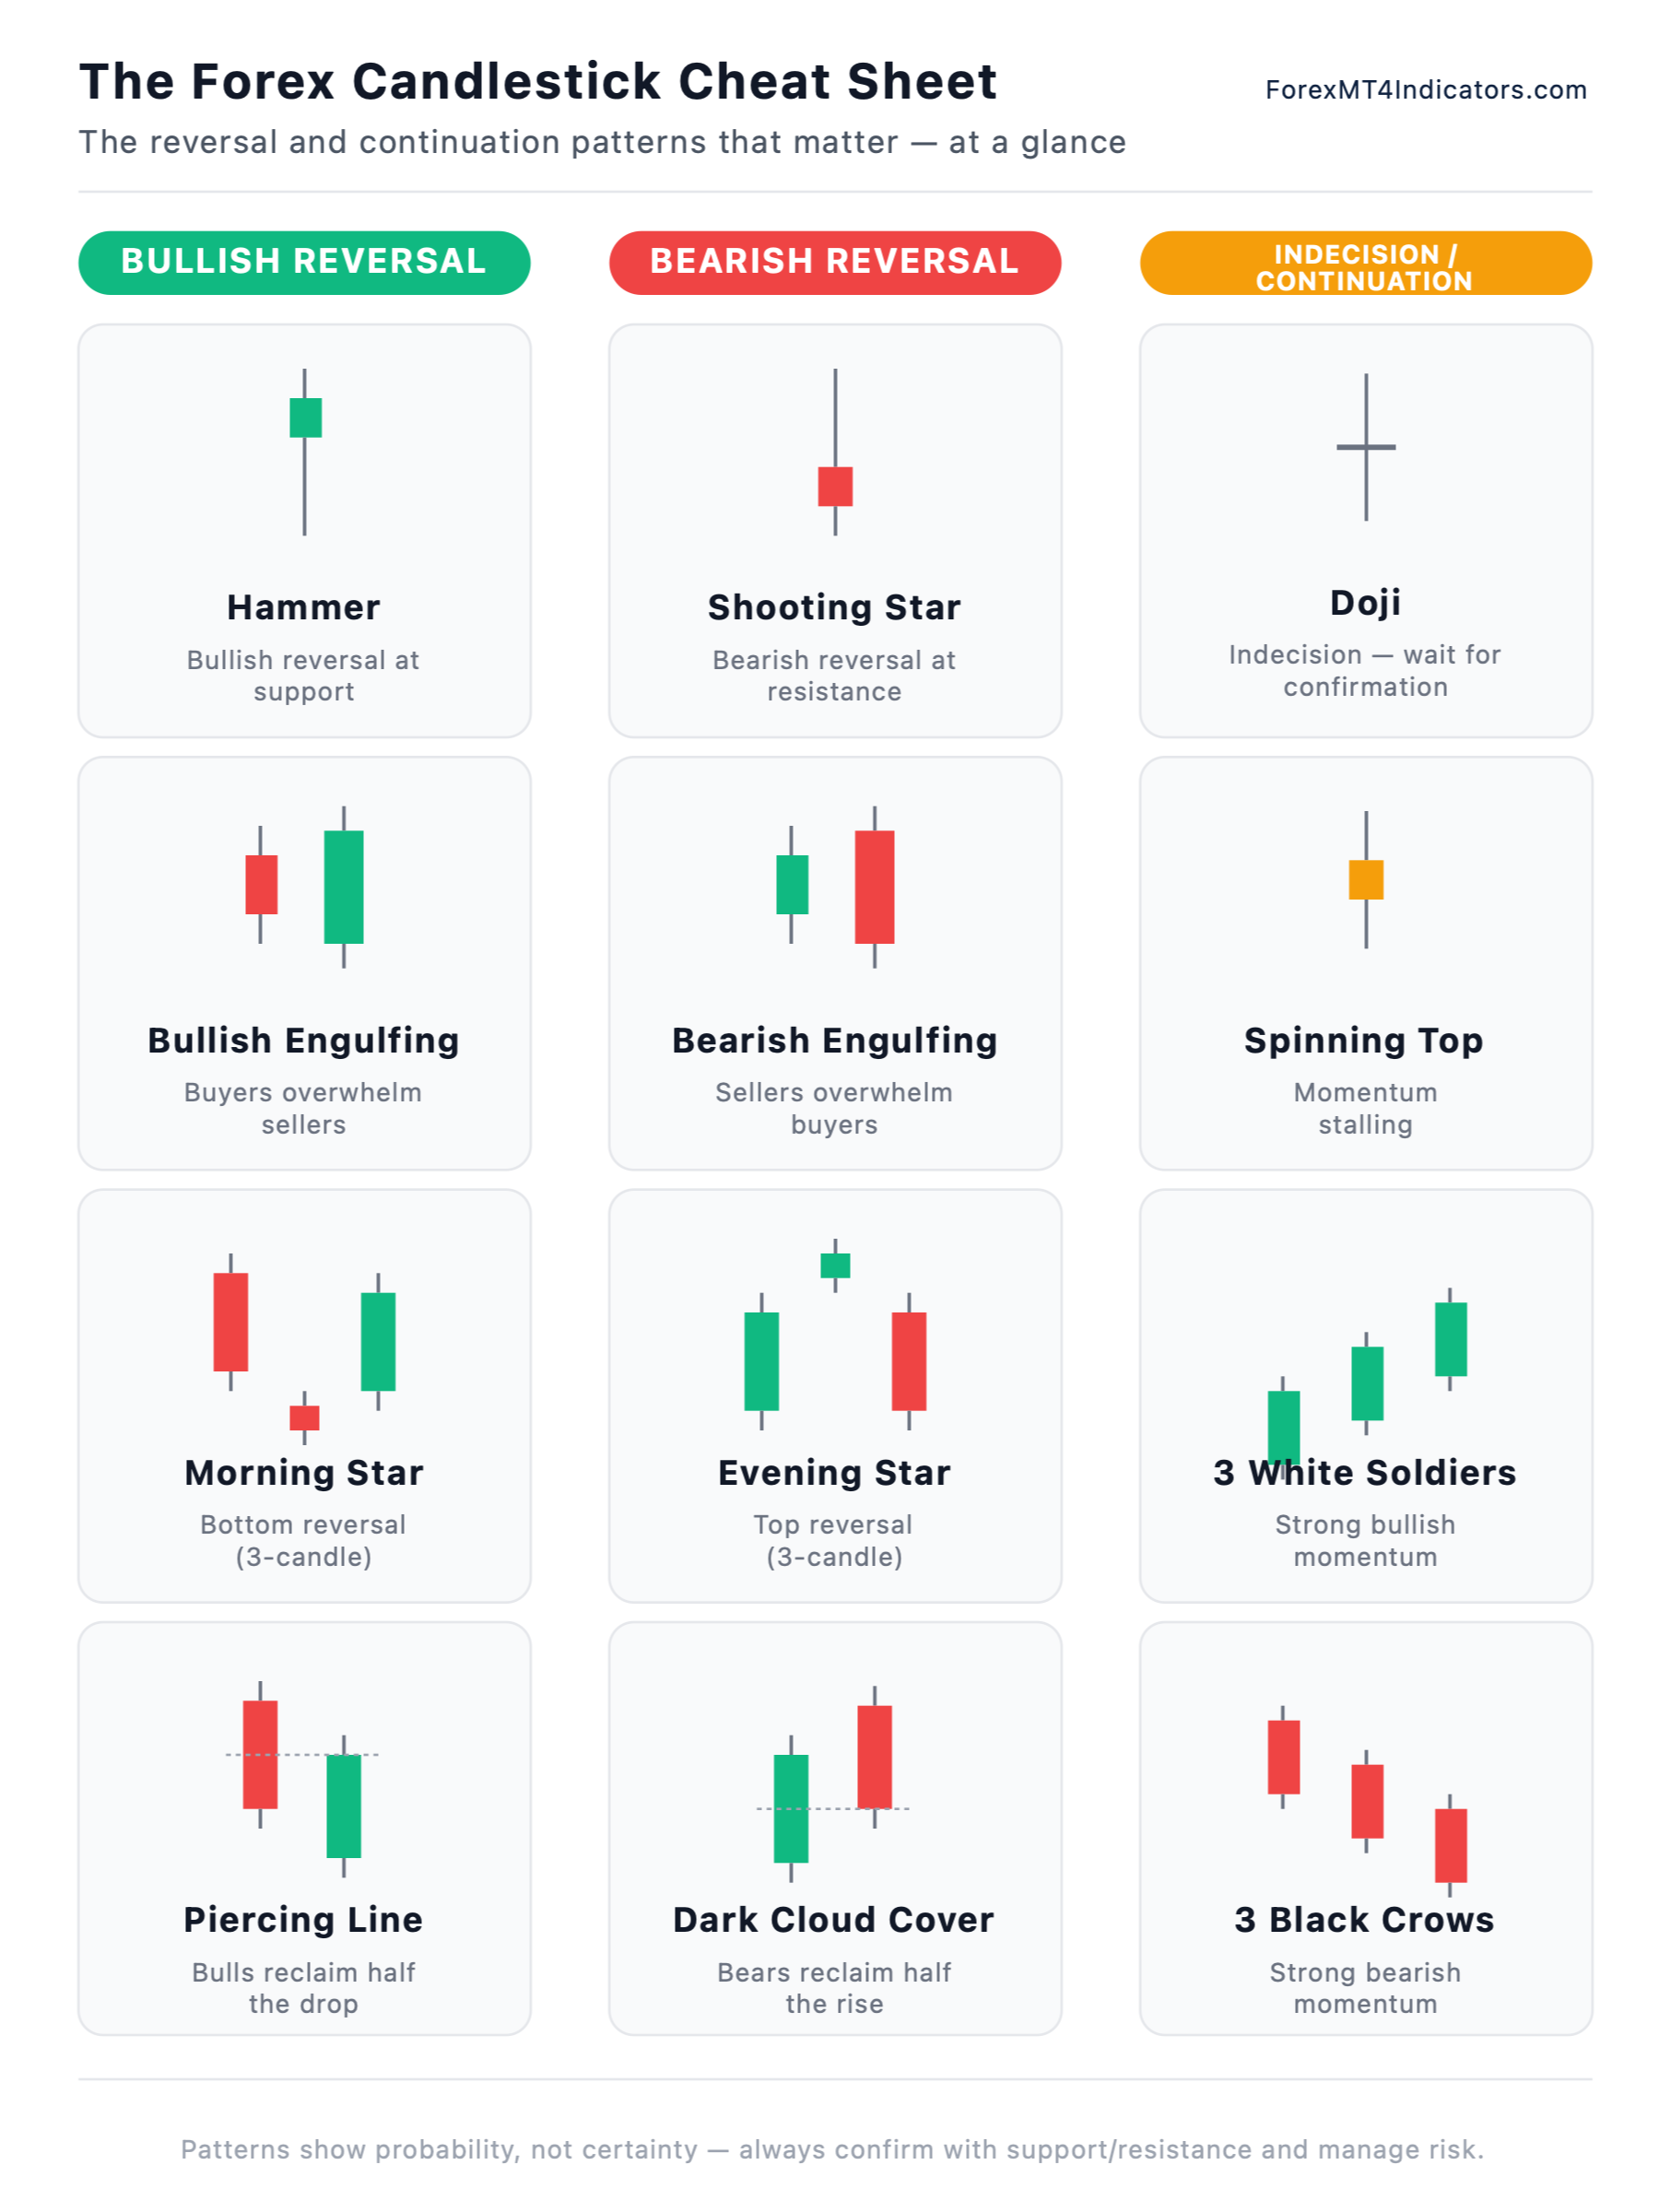

Instead of replacing price action, this indicator adds another layer of confirmation. Here’s how it works, where it performs best, and how traders can use it alongside existing trading strategies.
What Is the Candle Body Size Indicator MT4?
The Candle Body Size Indicator MT4 is a technical analysis tool that measures the distance between a candle’s opening and closing price. It ignores most of the wick length and focuses on the real body, which often reveals how much control buyers or sellers had during that period.
Unlike standard candlestick charts, where traders estimate body size visually, this indicator displays the exact value in points or pips. That makes it easier to compare candles across different market conditions.
For example, a bullish candle with a 35-pip body on GBP/USD carries more weight than several candles with only 8 to 10-pip bodies during a quiet Asian session. The indicator helps identify those differences instantly.
Many traders use it as a confirmation tool alongside support and resistance levels rather than treating it as a standalone entry system.
How the Indicator Works in Real Trading
The indicator calculates:
This simple formula hides valuable market information. Large bodies often suggest aggressive buying or selling pressure, while small bodies usually point to hesitation or low momentum.
Strong Momentum Example
Imagine EUR/USD trading on the 1-hour chart.
- Resistance sits near 1.0920.
- Three candles form with bodies between 6 and 9 pips.
- A fourth candle closes with a 31-pip bullish body.
That sudden increase shows buyers stepped in with much stronger conviction. Instead of buying immediately, experienced traders often wait for a small pullback toward the breakout level before entering.
This approach avoids chasing extended candles.
Spotting Weak Momentum
The indicator also helps avoid trades.
Suppose USD/JPY prints several candles with bodies under 5 pips on the 15-minute chart. Price keeps moving sideways despite touching support.
Those tiny bodies suggest neither side has taken control. Entering during this type of chop often results in whipsaws.
When testing this during low-volume Friday afternoons, waiting for bodies above 12 pips noticeably reduced unnecessary trades.
Best Settings for Different Timeframes
The Candle Body Size Indicator usually works well with its default settings, but traders can adjust its display depending on the market they’re trading.
Timeframe | Suggested Focus |
|---|---|
M5 | Scalping momentum bursts |
M15 | Session breakouts |
H1 | Intraday trend confirmation |
H4 | Swing trading setups |
Daily | Major trend strength |
Suggested Filters
Instead of reacting to every large candle, many traders combine body size with market structure.
For example:
Ignore candles smaller than 10 pips on EUR/USD H1.
Watch for 20-pip or larger bodies after a resistance breakout.
Confirm the move with higher highs before entering.
Different currency pairs require different expectations.
GBP/JPY naturally produces larger candles than EUR/USD. A 25-pip body may be ordinary on GBP/JPY but significant on EUR/USD during normal market conditions.
Combining Candle Body Size With Other Indicators
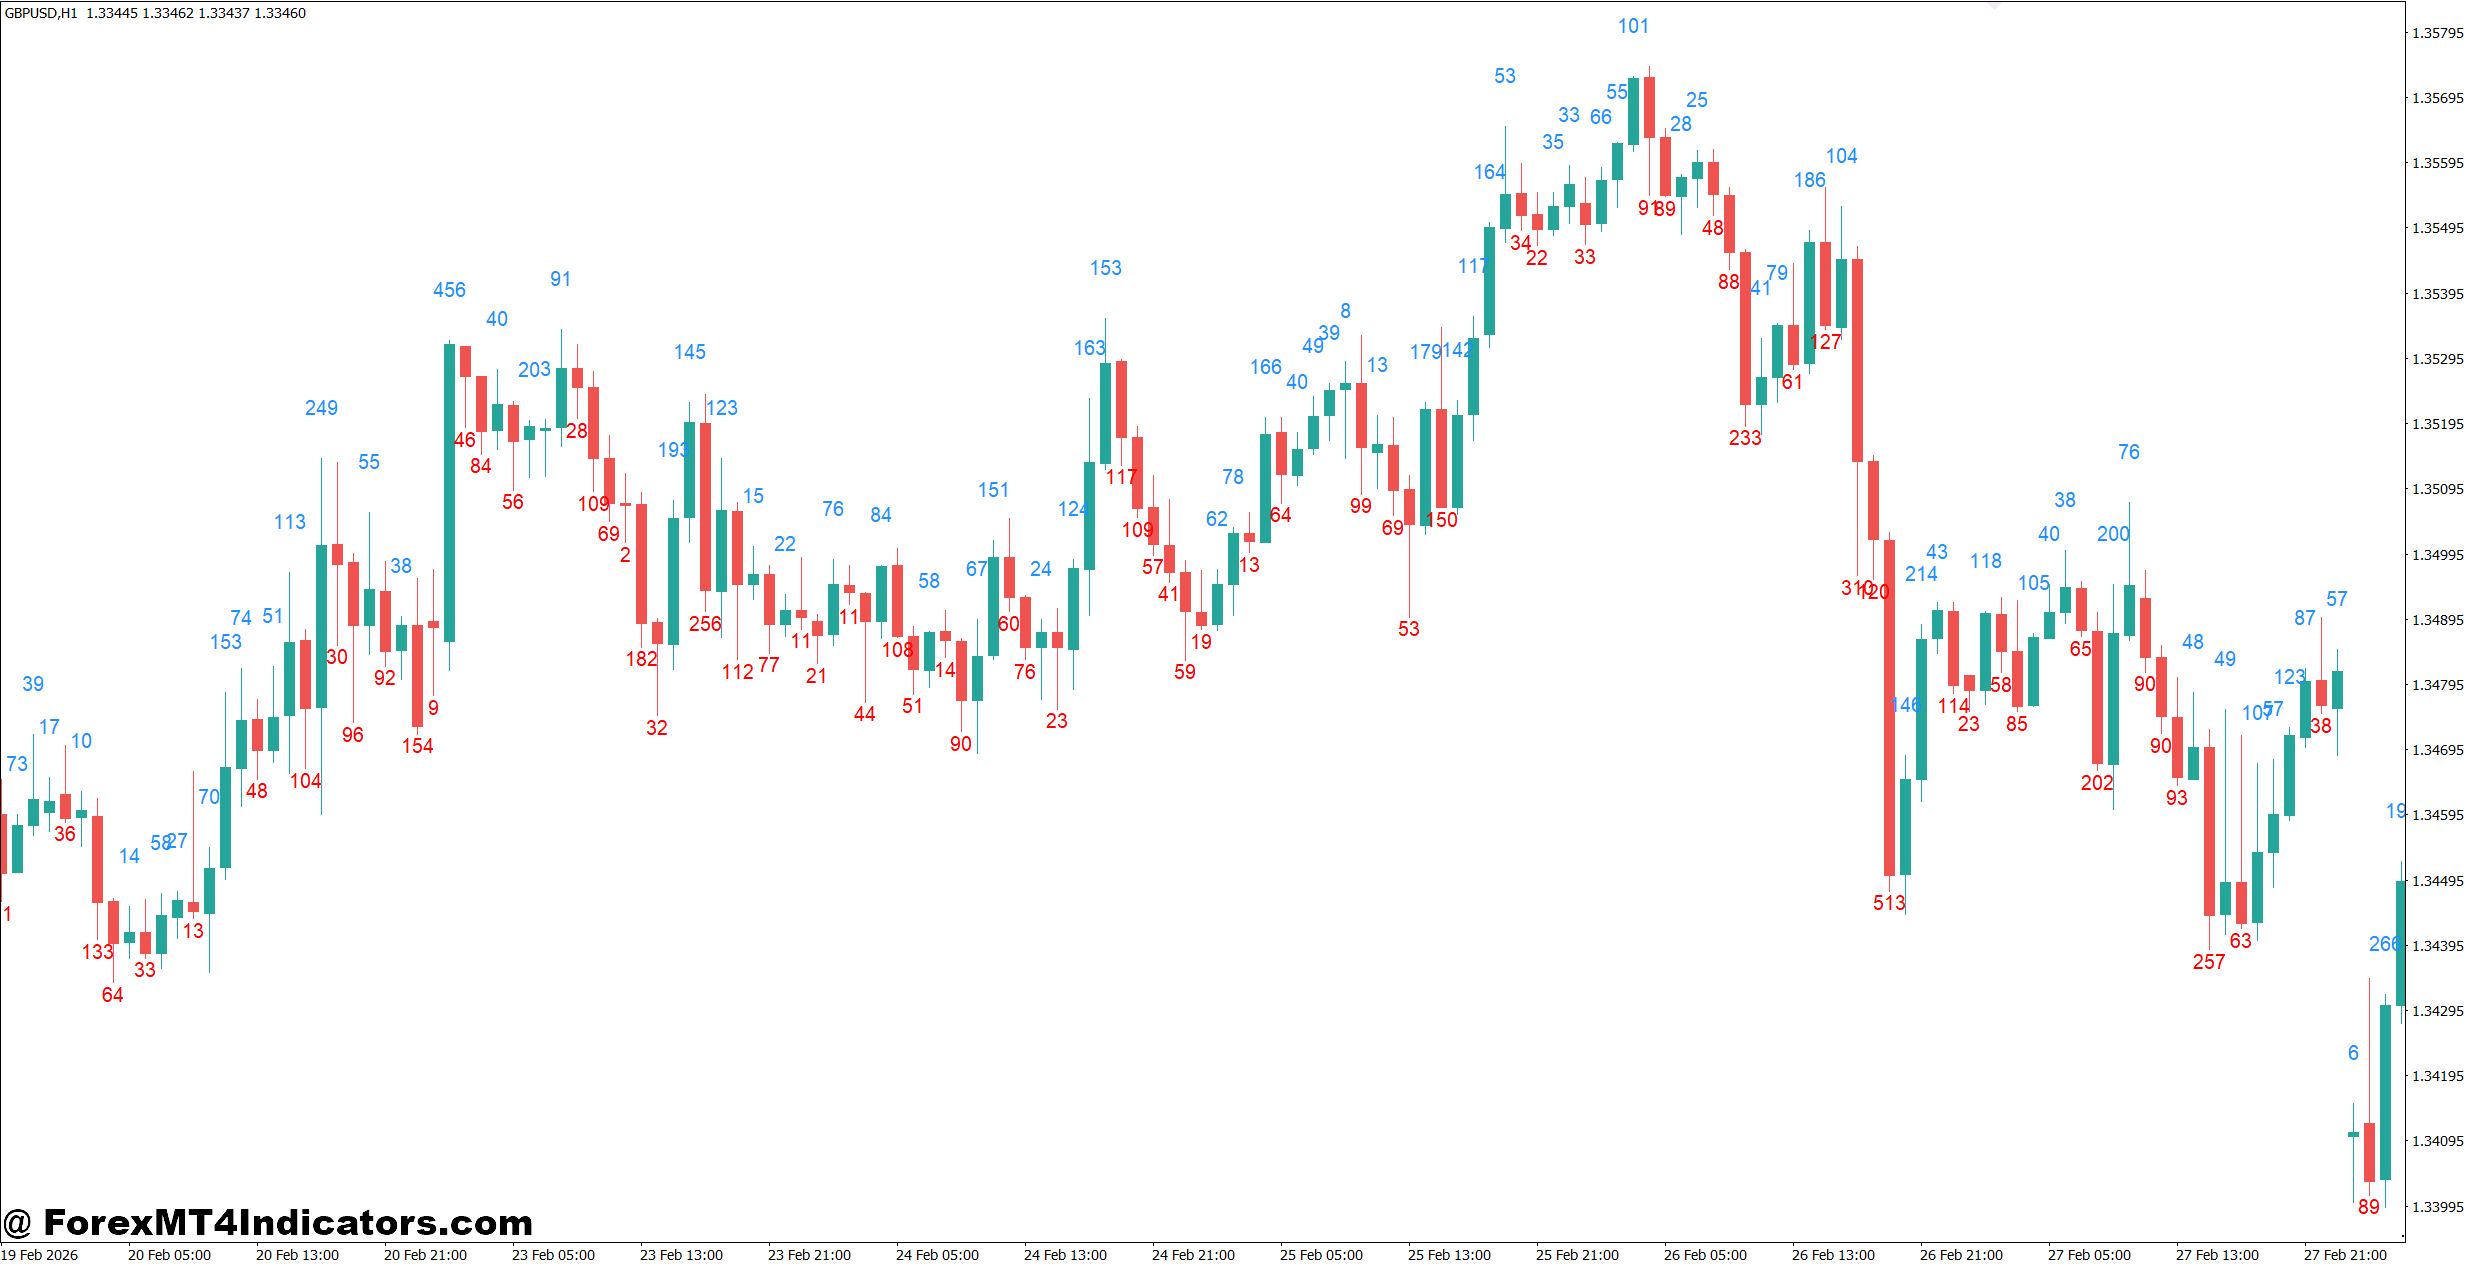
The indicator becomes much more useful when paired with confirmation tools.
Moving Average Confirmation
A trader using the 50-period EMA might wait for:
Price above the EMA.
A bullish candle with an unusually large body.
A pullback toward the moving average.
This creates a more structured entry than buying every breakout candle.
Support and Resistance
Large candle bodies near important levels often deserve attention.
For example:
EUR/USD breaks above resistance.
The breakout candle closes with a 28-pip body.
The next candle holds above the level.
That combination carries more weight than a breakout with a tiny candle body.
RSI Confirmation
The 14-period RSI can help avoid buying exhausted moves.
A large bullish body with RSI near 80 may signal an overextended market. Waiting for a pullback often produces a cleaner setup.
Strengths and Weaknesses Traders Should Know
No indicator works perfectly, and this one has clear strengths and limitations.
Advantages
Makes momentum easier to measure.
Removes visual guesswork.
Helps identify strong breakout candles.
Works across multiple timeframes.
Supports price action strategies instead of replacing them.
Limitations
Doesn’t predict future direction.
Can produce misleading signals during major news events.
Large candles after NFP releases often retrace quickly.
Doesn’t account for volume in forex, since MT4 uses tick volume rather than centralized exchange volume.
That’s why many traders avoid entering immediately after unusually large news candles.
Trading forex carries substantial risk. No indicator guarantees profits, and every setup should include proper stop-loss placement and risk management.
How It Compares With Similar MT4 Indicators
Several MT4 indicators measure market activity, but they focus on different aspects.
Indicator | Primary Purpose |
|---|---|
Candle Body Size | Measures real candle body strength |
ATR | Measures total volatility |
Momentum Indicator | Tracks price acceleration |
MACD | Identifies trend momentum |
Volume Indicator | Shows tick activity |
The biggest difference is precision.
ATR measures the entire trading range, including wicks. The Candle Body Size Indicator isolates the part of the candle that reflects where price actually closed relative to where it opened.
That makes it especially useful for traders who rely heavily on candlestick confirmation.
How to Trade with Candle Body Size Indicator MT4
Buy Entry
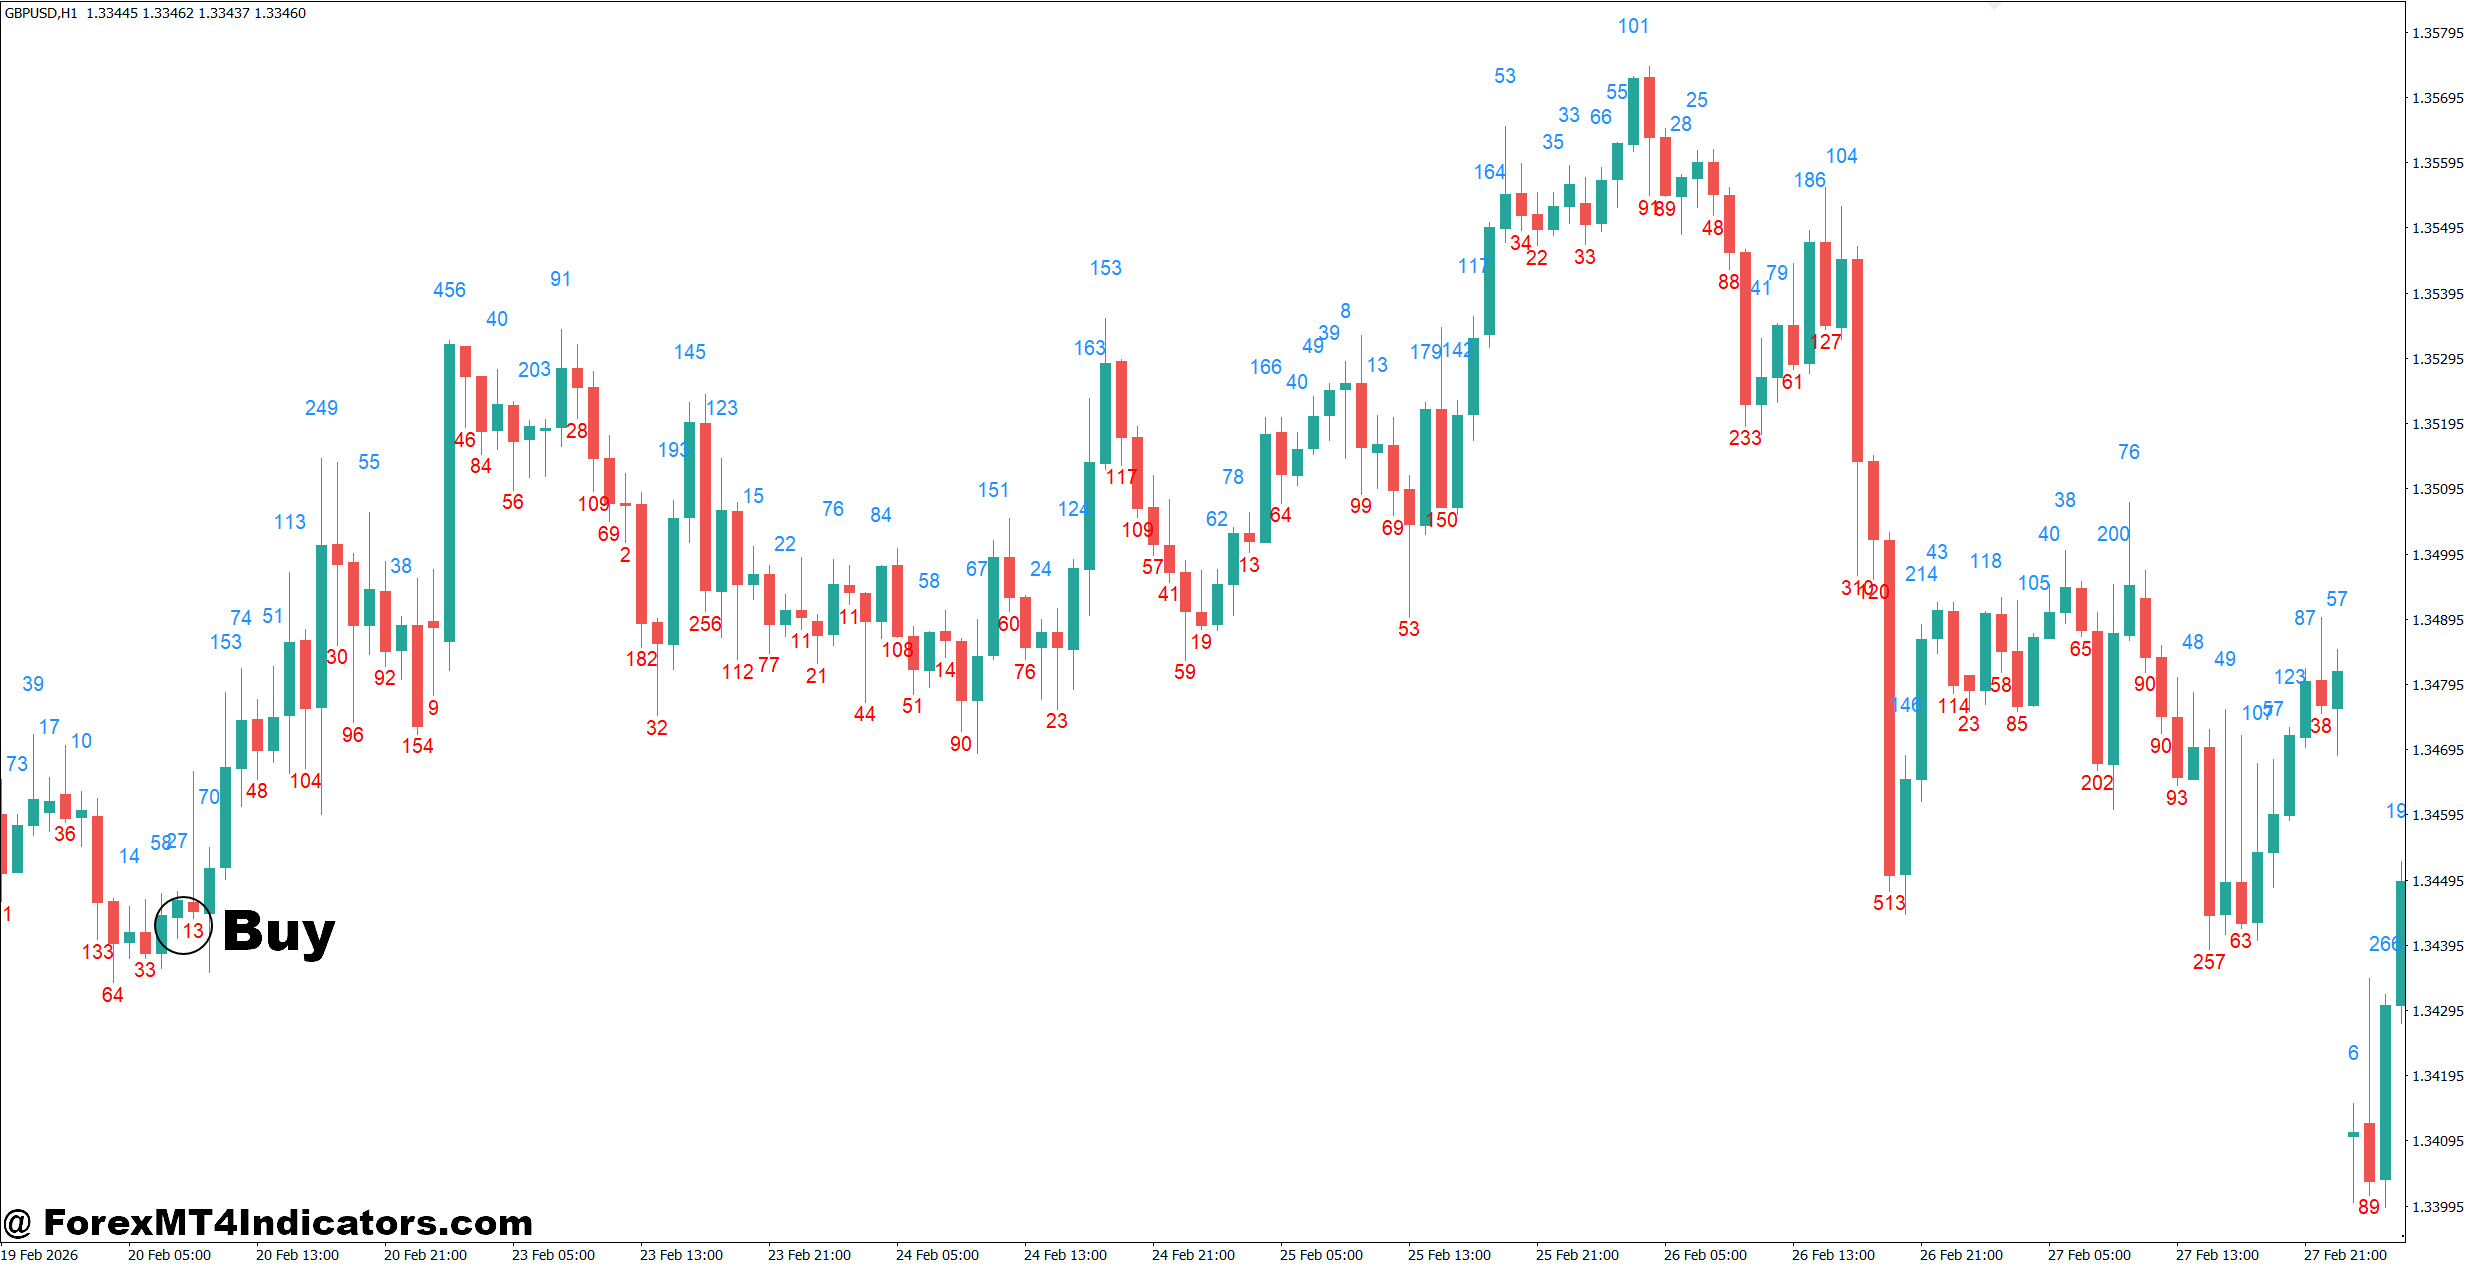
- Wait for a 15+ pip bullish body – On EUR/USD H1, consider a buy when a bullish candle closes with a body of at least 15 pips near support.
- Confirm a resistance breakout – Enter after EUR/USD H1 closes 10–20 pips above resistance with a strong bullish body, rather than buying during the breakout spike.
- Check the 50 EMA trend – Prefer GBP/USD H1 buys when price stays above the 50 EMA and the candle body expands to 20+ pips.
- Use H4 for stronger confirmation – Consider a buy when GBP/USD H4 prints a bullish body at least 25 pips after rejecting a major support zone.
- Wait for a pullback entry – After a 25–30 pip bullish candle, wait for price to retrace 30–50% of that candle before entering.
- Avoid weak candles – Skip buy signals when bodies remain below 5–7 pips for several candles, especially during sideways Asian-session trading.
- Keep risk below 1–2% – Place the stop below the recent swing low and risk no more than 1–2% of trading capital.
- Avoid overextended daily candles – Don’t chase EUR/USD after a daily candle has already moved 80–100 pips without a pullback.
Sell Entry
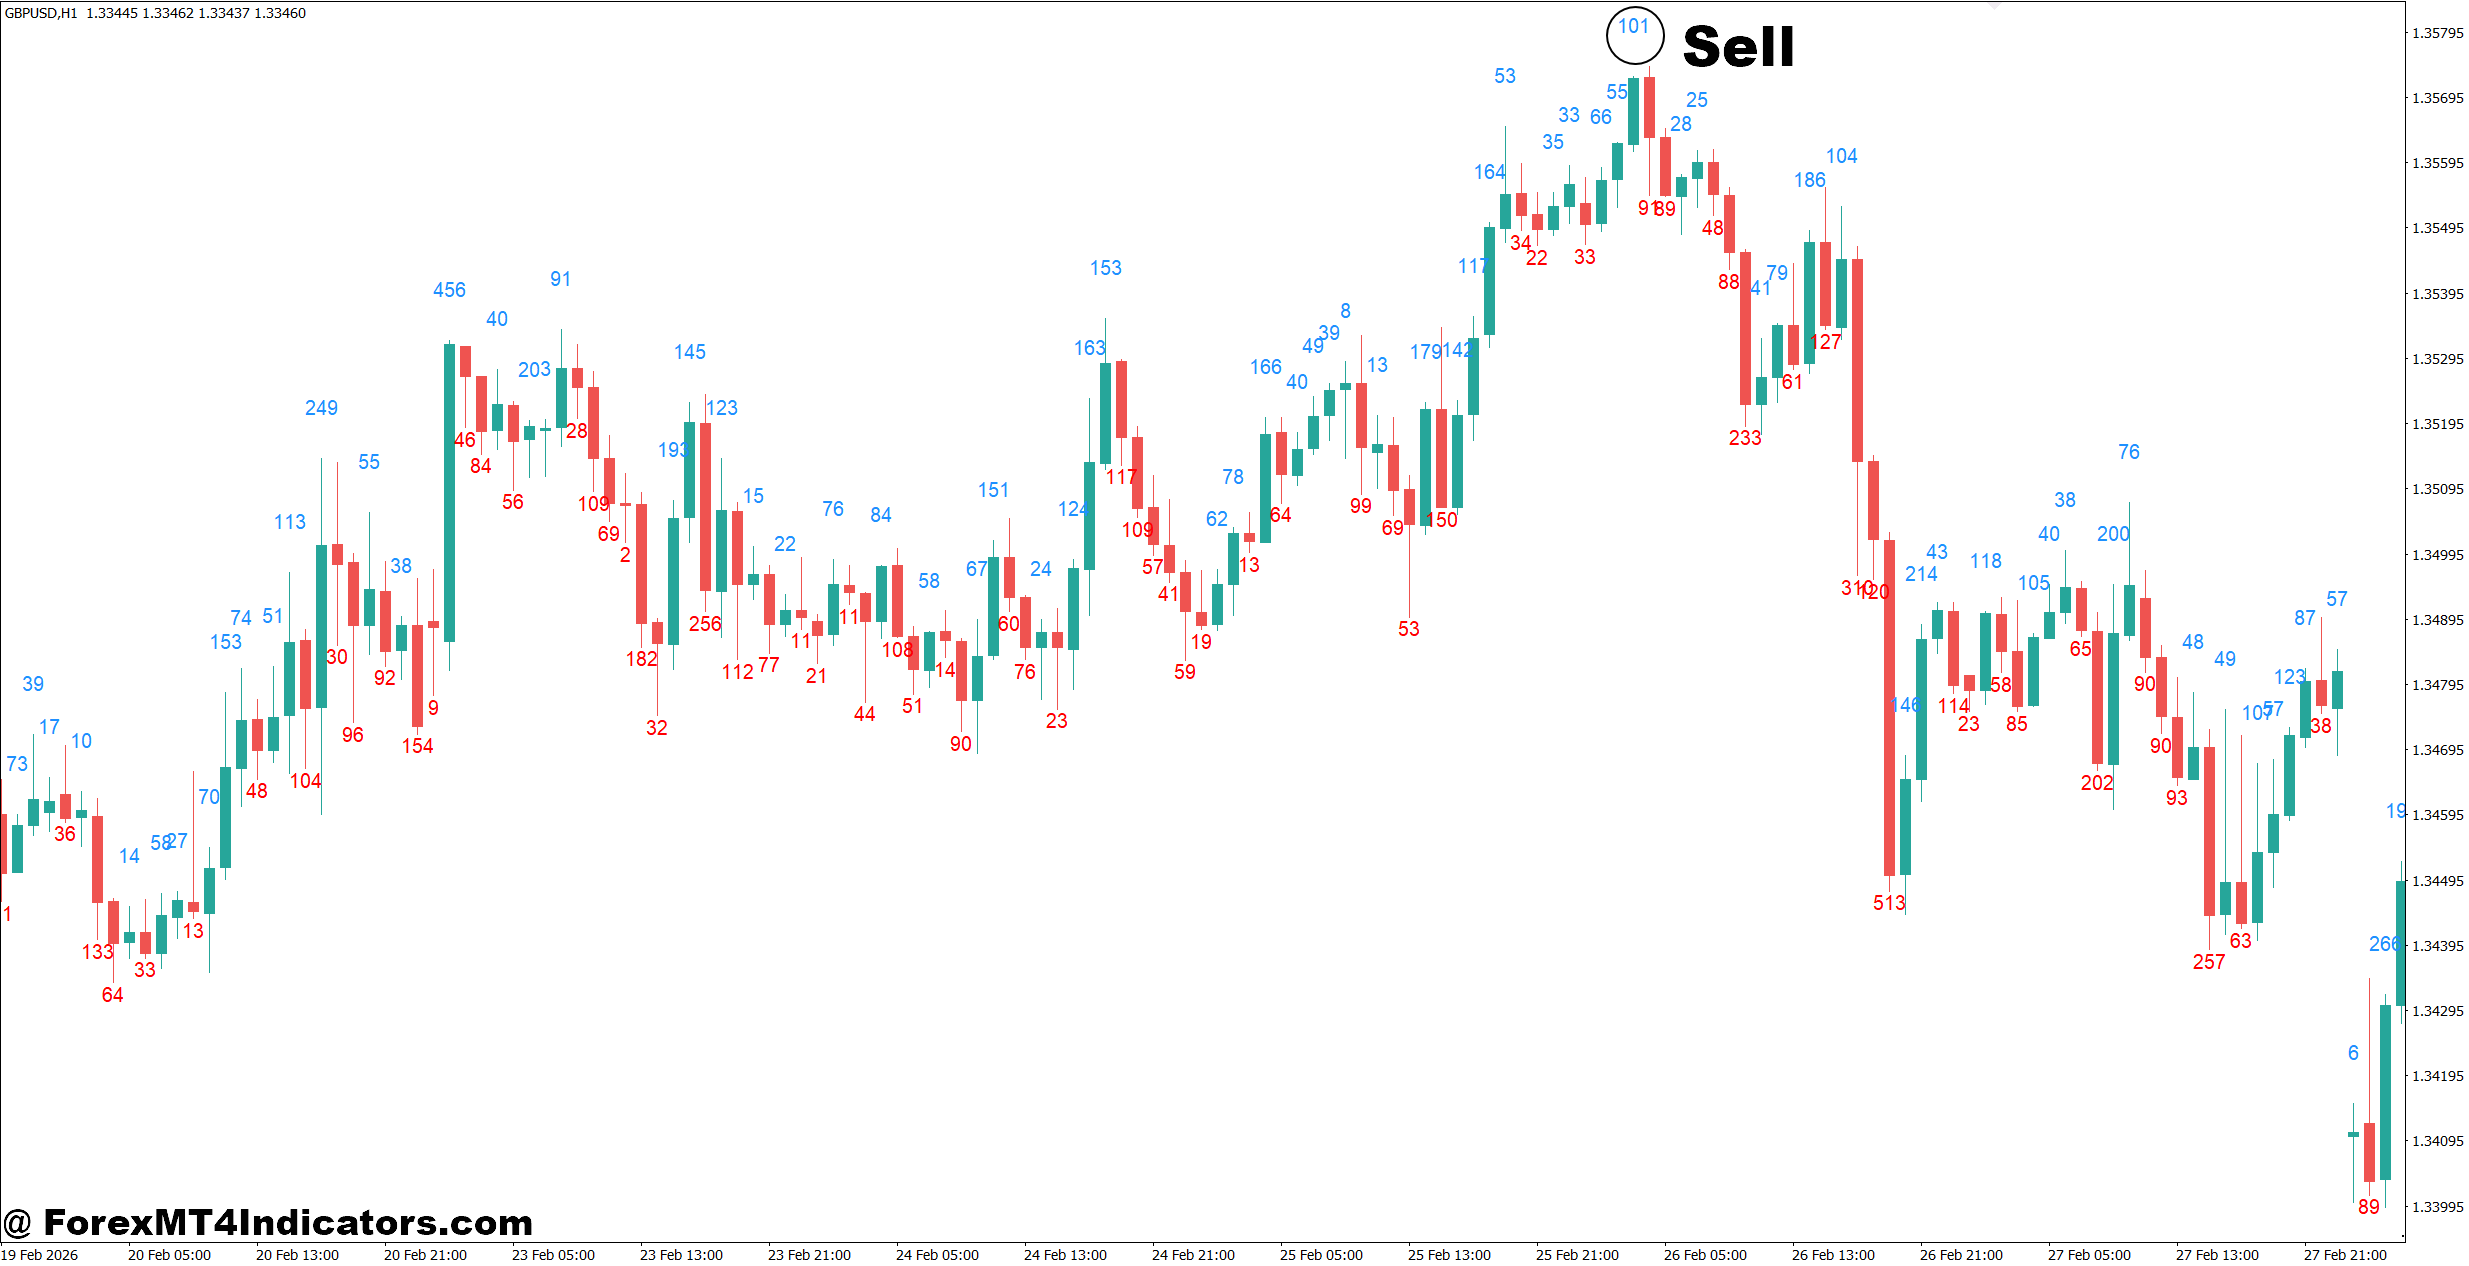
- Wait for a 15+ pip bearish body – On EUR/USD H1, consider a sell when a bearish candle closes with a body of 15 pips or more near resistance.
- Confirm support breakdown – Sell after GBP/USD H1 closes 10–20 pips below support with strong bearish momentum.
- Trade below the 50 EMA – Favor EUR/USD H1 sell setups when price remains below the 50 EMA and bearish bodies expand beyond 15–20 pips.
- Use H4 rejection signals – Consider GBP/USD H4 sells when a 25+ pip bearish candle rejects a major resistance zone.
- Wait for a retracement – After a large bearish candle, wait for a 30–50% pullback before selling instead of entering at the candle’s low.
- Skip tiny bearish candles – Avoid sells when candle bodies stay under 5–7 pips because low momentum can produce quick whipsaws.
- Protect every position – Place the stop above the recent swing high and limit risk to 1–2% per trade.
- Don’t chase daily breakdowns – Avoid selling EUR/USD after an 80–100 pip daily drop without a retracement, as late entries can face sharp reversals.
Final Thoughts
The Candle Body Size Indicator MT4 gives traders a clearer way to judge momentum instead of estimating candle strength by eye. It works best as part of a broader trading plan rather than a standalone signal generator. Traders often find it most effective when they combine it with support and resistance, moving averages, and sensible risk management.
The biggest takeaways are simple: watch for unusually large bodies near key levels, avoid trading tiny candles during sideways markets, adjust expectations for each currency pair, and always protect trades with stop-loss orders. Used with patience and proper confirmation, the Candle Body Size Indicator MT4 can become a practical addition to a price action trader’s toolkit without creating unnecessary complexity.
Level up your trading
Learn to read the chart — not just the indicator
eBook · Instant PDF
Video Course · 12 modules
Recommended MT4/MT5 Brokers
- ✓ *FREE *$50 to start (withdrawable)
- ✓ Deposit bonus up to $5,000
- ✓ Negative balance protection
Trading forex and CFDs carries a significant risk of loss and is not suitable for everyone. Broker links are affiliate links — we may earn a commission at no cost to you.
Free MT4 Indicator Download

Enter Your Email Address below, download link will be sent to you.