

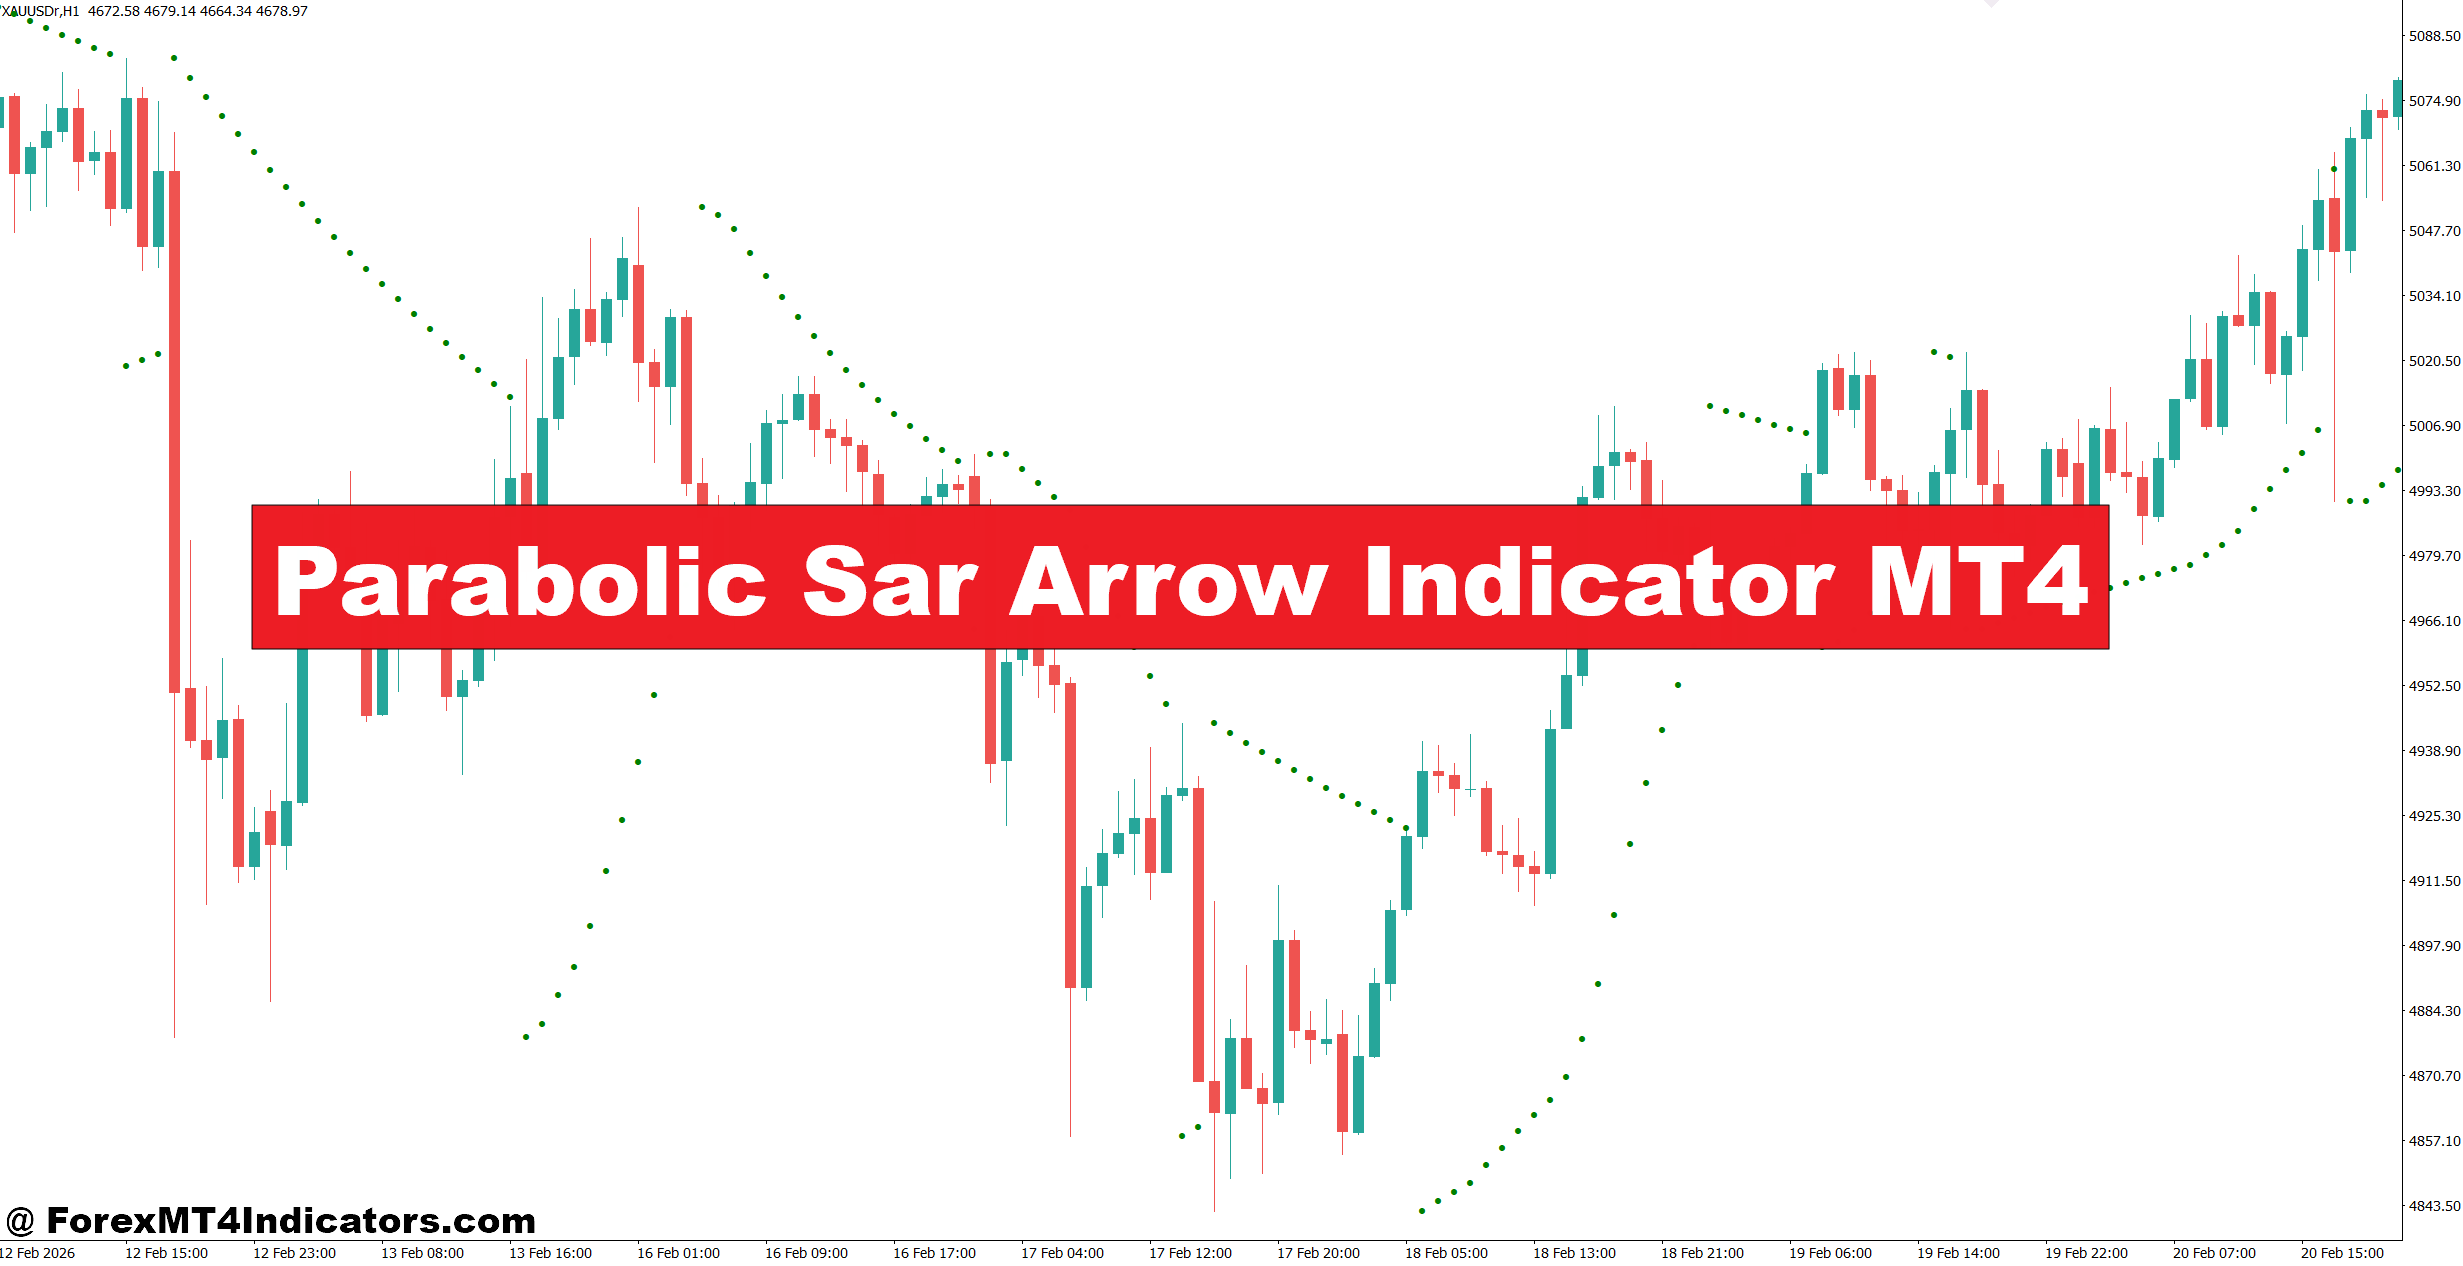
The Parabolic SAR Arrow Indicator MT4 is a trend-following technical indicator built around the original Parabolic Stop and Reverse (SAR) algorithm. Instead of displaying only the familiar SAR dots above or below price, it adds visual arrows whenever the trend changes direction. These arrows make it easier to spot possible entry points without constantly watching every candle.
The indicator works well in trending markets because it attempts to identify when momentum shifts from buyers to sellers or vice versa. Many swing traders use it on the 1-hour, 4-hour, and daily charts where price movements tend to be cleaner than lower timeframes.
Unlike oscillators that measure overbought or oversold conditions, this tool focuses on trend direction. It reacts to price movement and adjusts continuously as new candles form.
How the Indicator Calculates Signals
The indicator follows the same mathematical logic as the traditional Parabolic SAR. It uses two main values:
- Step (Acceleration Factor): Usually set at 0.02.
- Maximum Step: Commonly set at 0.20.
As the trend continues, the acceleration factor gradually increases. This causes the SAR value to move closer to price, allowing the indicator to react faster during strong trends.
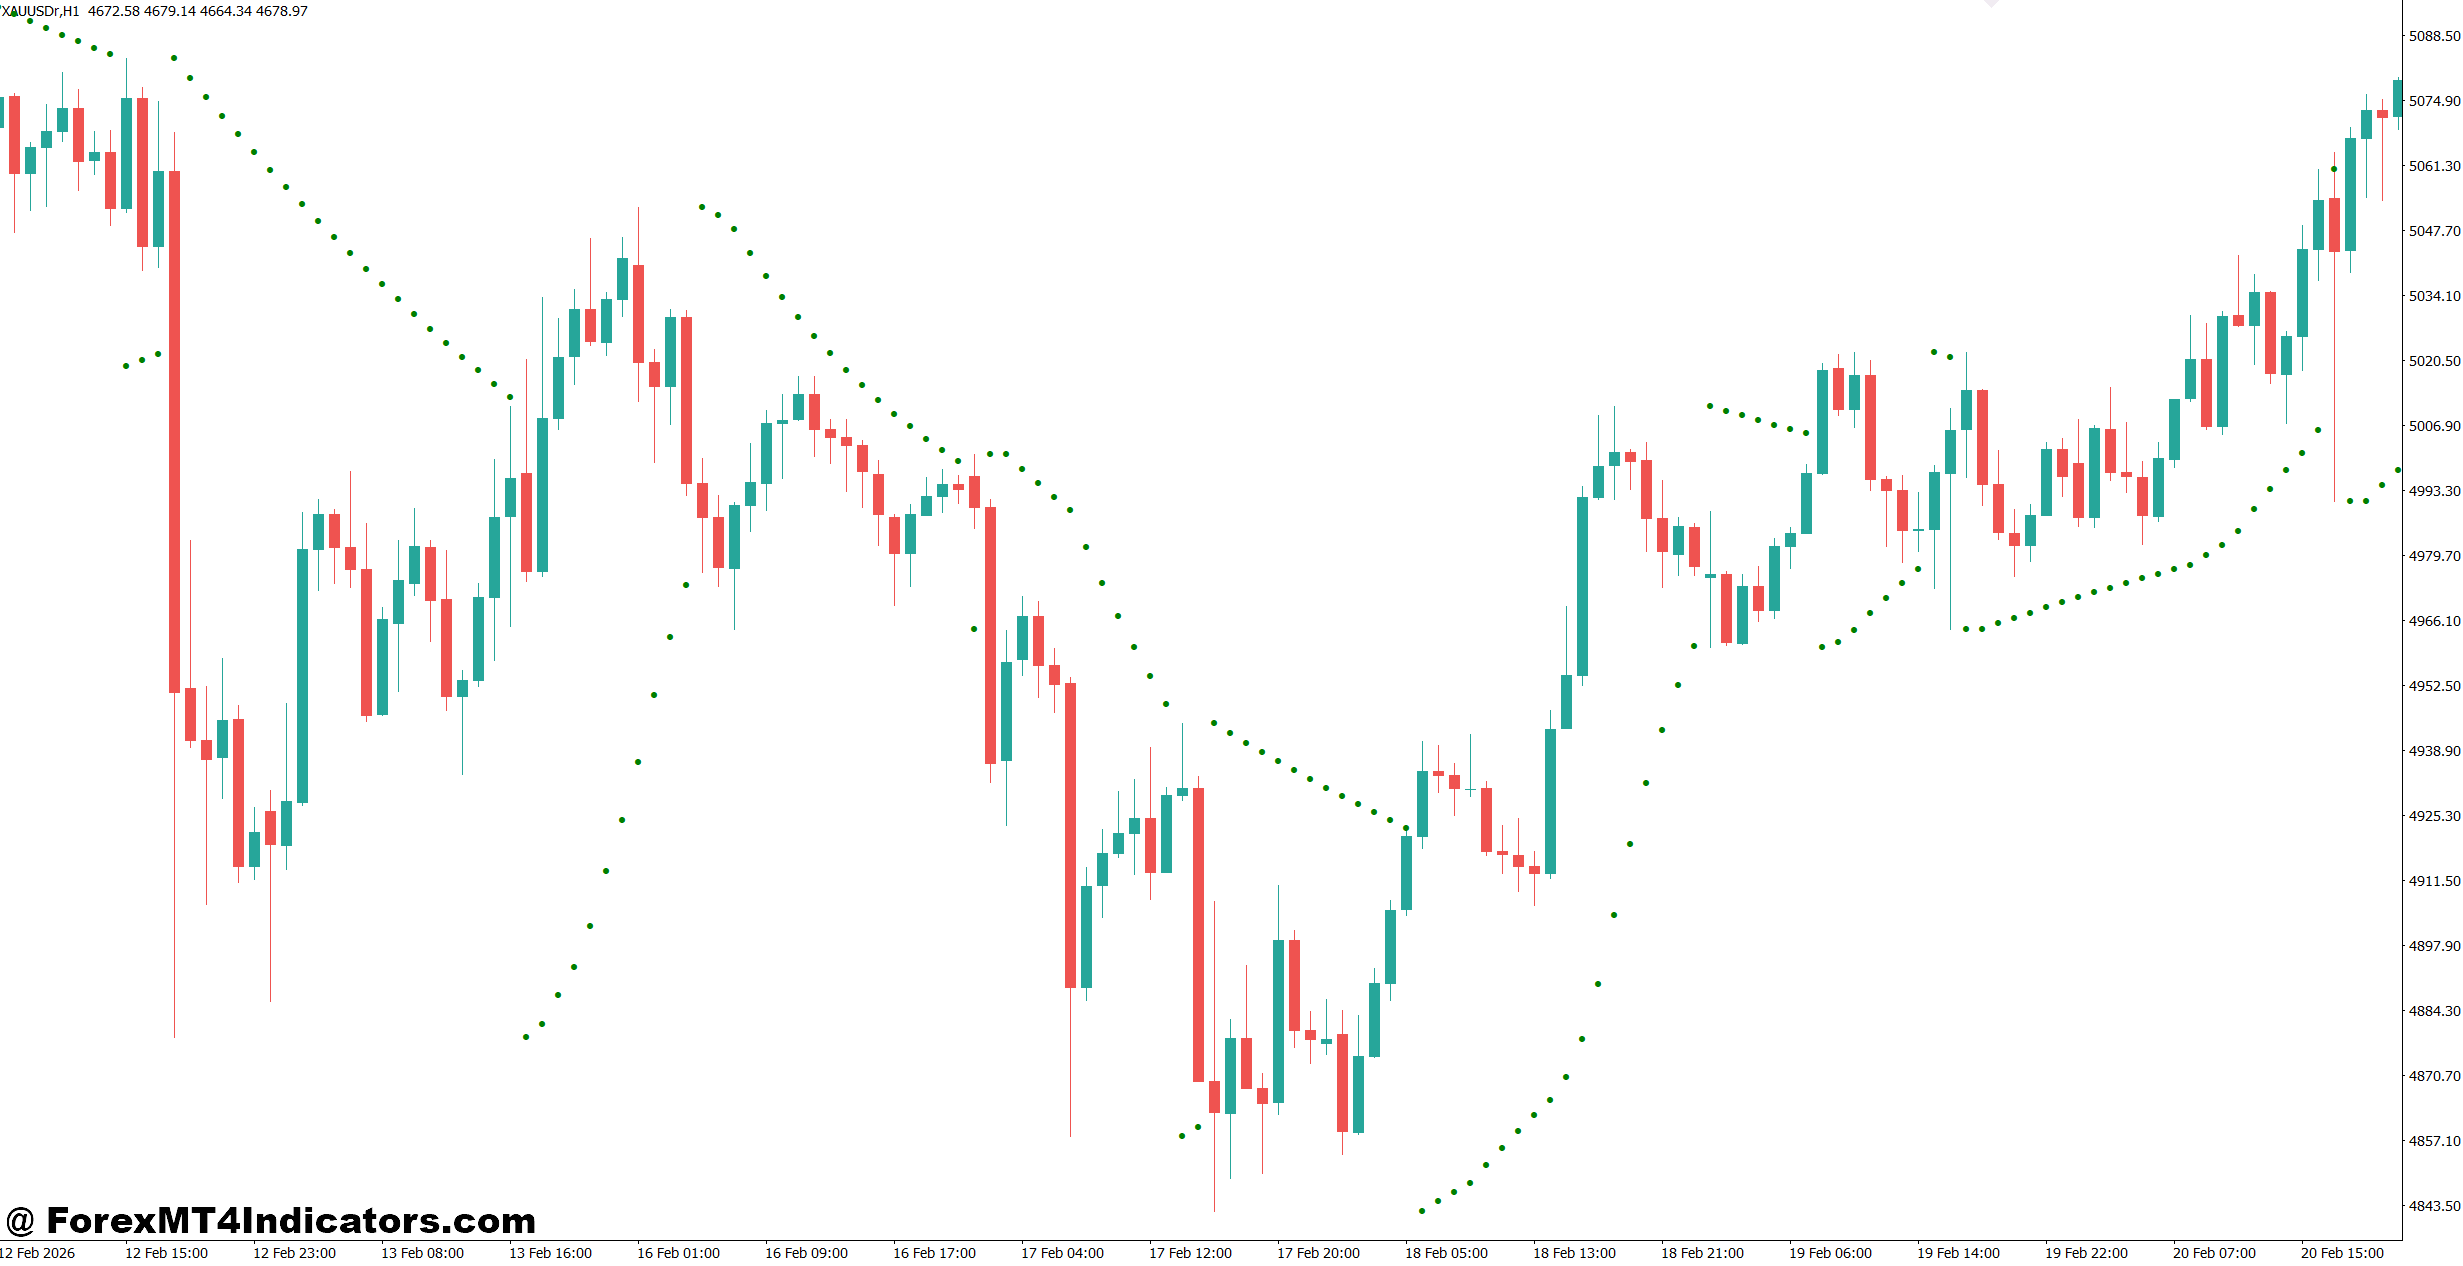
When price crosses the SAR level, the indicator assumes the previous trend has ended. At that point, the dots switch sides, and the MT4 version displays a new buy or sell arrow.
Here’s the thing. Faster settings produce earlier entries, but they also create more false signals during sideways markets. Slower settings filter out some market noise, although traders may enter a trend later.
This is why experienced traders rarely rely on the arrow alone. They often combine it with market structure, support and resistance, or a moving average to improve trade quality.
Using the Parabolic SAR Arrow Indicator in Real Trading
The indicator becomes much more useful when it is part of a complete trading plan.
Buy Example
Suppose EUR/USD is trading on the 1-hour chart after breaking above a resistance level near 1.0850. Shortly after the breakout, the indicator prints a buy arrow while SAR dots move below price.
A trader could wait for the candle to close before entering around 1.0862.
The stop-loss may be placed below the recent swing low at 1.0838, creating roughly a 24-pip risk. If the next resistance sits near 1.0915, the trade offers more than 50 pips of potential reward, giving a favorable risk-to-reward ratio.
Waiting for candle confirmation helps reduce entries caused by temporary price spikes.
Sell Example
GBP/USD on the 4-hour chart begins making lower highs after rejecting resistance around 1.2740. A bearish candle closes beneath the previous support, and the indicator prints a sell arrow.
Rather than entering immediately during the candle, many traders wait until the bar closes. They may enter near 1.2685 with a stop above the latest swing high around 1.2725.
As long as the SAR dots remain above price, the trend stays bearish.
One practical observation from testing is that the indicator performs much better during the London and New York sessions than during quiet Asian market ranges, where whipsaws appear more often.
Trading forex carries substantial risk. No indicator guarantees profits.
Best Settings and Customization
There isn’t one perfect setting for every market. Traders often adjust the parameters based on volatility and trading style.
Conservative Trend Trading
- Step: 0.02
- Maximum: 0.20
- Timeframe: H4 or Daily
This setup produces fewer signals and works well for position traders following larger trends.
Active Swing Trading
- Step: 0.03
- Maximum: 0.20
- Timeframe: H1
The slightly higher acceleration responds faster to changing momentum while still avoiding excessive market noise.
Short-Term Trading
Many scalpers experiment with settings such as 0.04 and 0.20 on the M15 chart. But lower timeframes naturally create more false arrows because price fluctuates rapidly.
When testing this on volatile NFP days, many traders notice the indicator reacts quickly after large candles. Even then, waiting for volatility to settle before entering often produces better results than chasing the first arrow.
Strengths, Weaknesses, and Comparison with Similar Indicators
Every trading tool has situations where it performs well and conditions where it struggles.
One major strength of the Parabolic SAR Arrow Indicator MT4 is its simplicity. Traders don’t spend time interpreting complex calculations because buy and sell arrows appear directly on the chart. It also works well as a trailing stop since the SAR levels move closer to price during strong trends.
The biggest weakness appears during sideways markets. Price may cross above and below the SAR repeatedly, creating several losing trades in a short period. That type of chop is common before major news releases or during low-volume sessions.
Compared with Moving Average Crossovers, the Parabolic SAR Arrow Indicator MT4 generally reacts faster to trend changes. The trade-off is a higher chance of fake signals.
Compared with the Supertrend Indicator, Parabolic SAR usually produces earlier entries, while Supertrend often filters more market noise but enters later.
Some traders also combine the indicator with the 14-period RSI. For example, they only take buy arrows when RSI remains above 50 and ignore signals that go against the broader market trend. This extra filter can remove many low-quality setups without making the strategy overly complicated.
No indicator should replace proper risk management. Position sizing, stop-loss placement, and patience remain just as important as finding the right entry.
How to Trade with Parabolic Sar Arrow Indicator MT4
Buy Entry
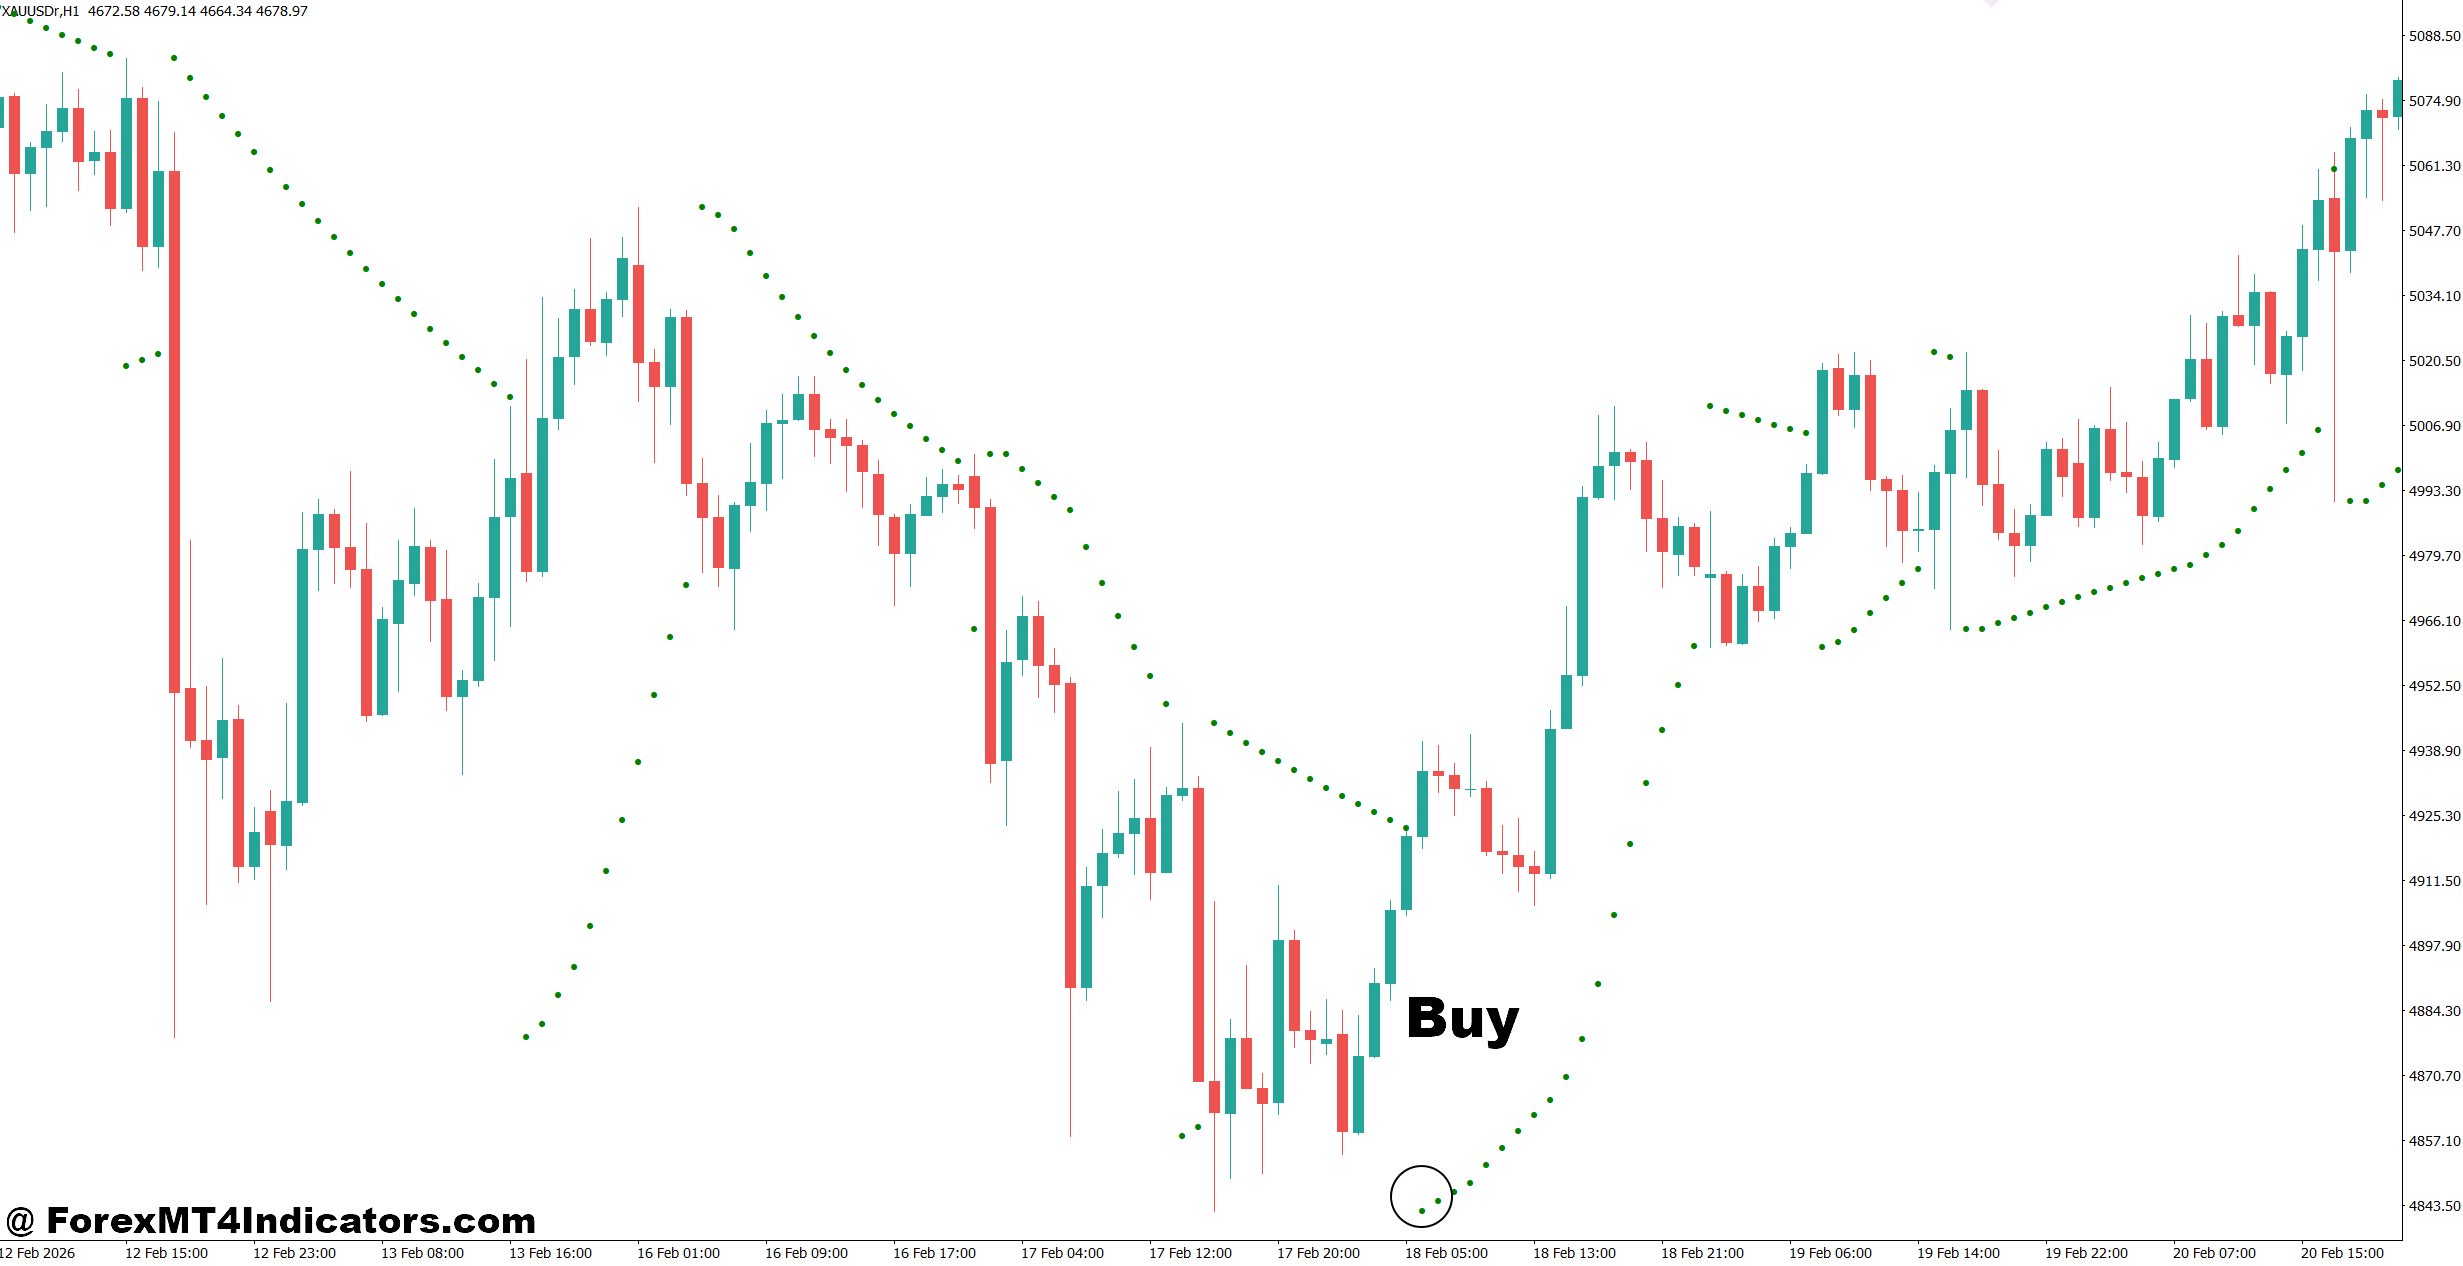
- Wait for a fresh buy arrow – Enter after a bullish arrow appears and the candle closes above it on the 1-hour EUR/USD chart.
- Confirm the trend – Buy only when price stays above the 50 EMA and SAR dots remain below price.
- Trade key breakouts – Take buy signals after a resistance breakout with at least 20-30 pips of upside potential.
- Use a protective stop-loss – Place the stop 15-25 pips below the recent swing low on the 1-hour chart.
- Target a healthy reward – Aim for a minimum 1:2 risk-to-reward ratio, such as risking 25 pips to gain 50 pips.
- Trade higher timeframes – Prefer 4-hour and daily buy signals since they usually produce fewer false entries.
- Skip weak market conditions – Avoid buy arrows during sideways markets or before high-impact news releases.
- Manage open trades – Move the stop-loss to breakeven after gaining 25-30 pips to protect profits.
Sell Entry
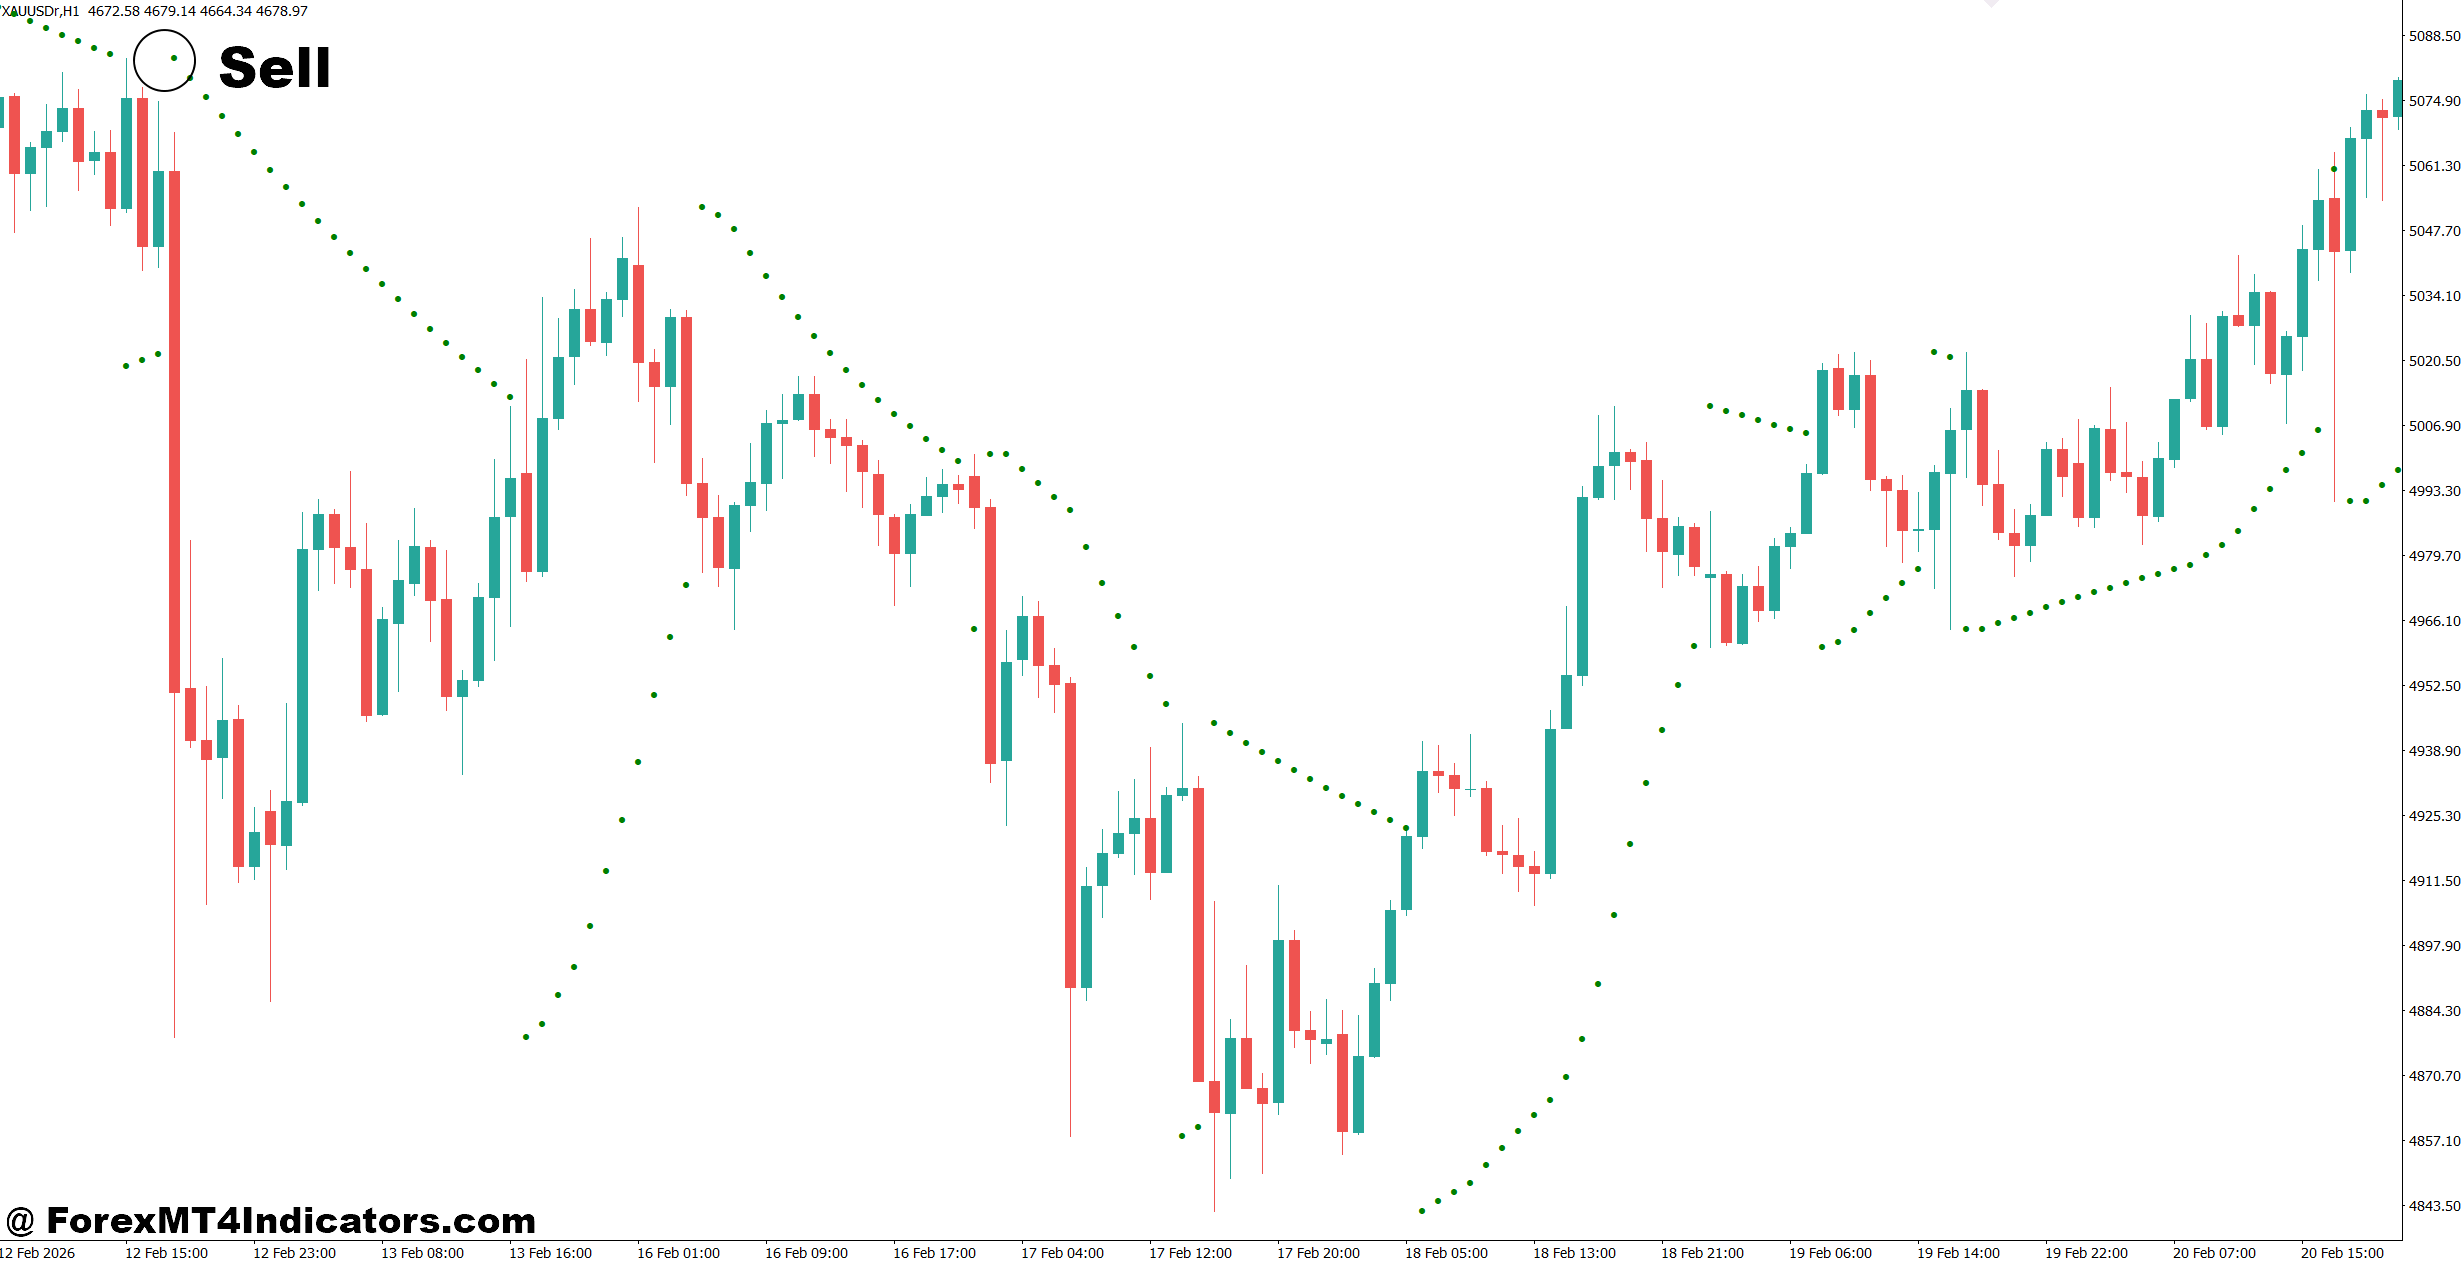
- Wait for a fresh sell arrow – Enter after a bearish arrow appears and the candle closes below it on the 1-hour GBP/USD chart.
- Confirm bearish momentum – Sell only when price remains below the 50 EMA and SAR dots stay above price.
- Sell after support breaks – Take sell trades when support fails with at least 20-30 pips of downside room.
- Set a proper stop-loss – Place the stop 15-25 pips above the latest swing high.
- Aim for larger profits – Target at least 40-60 pips or maintain a 1:2 risk-to-reward ratio.
- Focus on stronger trends – Use 4-hour or daily sell signals for more reliable trend continuation.
- Avoid false signals – Don’t sell if price is moving inside a narrow 15-20 pip range.
- Lock in profits – Trail the stop behind new SAR dots once the trade moves 30+ pips in your favor.
The Parabolic SAR Arrow Indicator MT4 gives traders an easy way to spot potential trend reversals without cluttering the chart. Its biggest strengths include clear visual arrows, quick trend recognition, and simple customization for different trading styles. At the same time, traders should remember that it performs best in trending conditions and may struggle during ranging markets. Combining it with price action, support and resistance, or another confirmation tool often improves consistency. Used with disciplined risk management and realistic expectations, the Parabolic SAR Arrow Indicator MT4 can become a valuable part of a structured trading plan instead of serving as the only reason to enter a trade.
Level up your trading
Learn to read the chart — not just the indicator
eBook · Instant PDF
Video Course · 12 modules
Recommended MT4/MT5 Brokers
- ✓ *FREE *$50 to start (withdrawable)
- ✓ Deposit bonus up to $5,000
- ✓ Negative balance protection
Trading forex and CFDs carries a significant risk of loss and is not suitable for everyone. Broker links are affiliate links — we may earn a commission at no cost to you.
Free MT4 Indicator Download

Enter Your Email Address below, download link will be sent to you.