


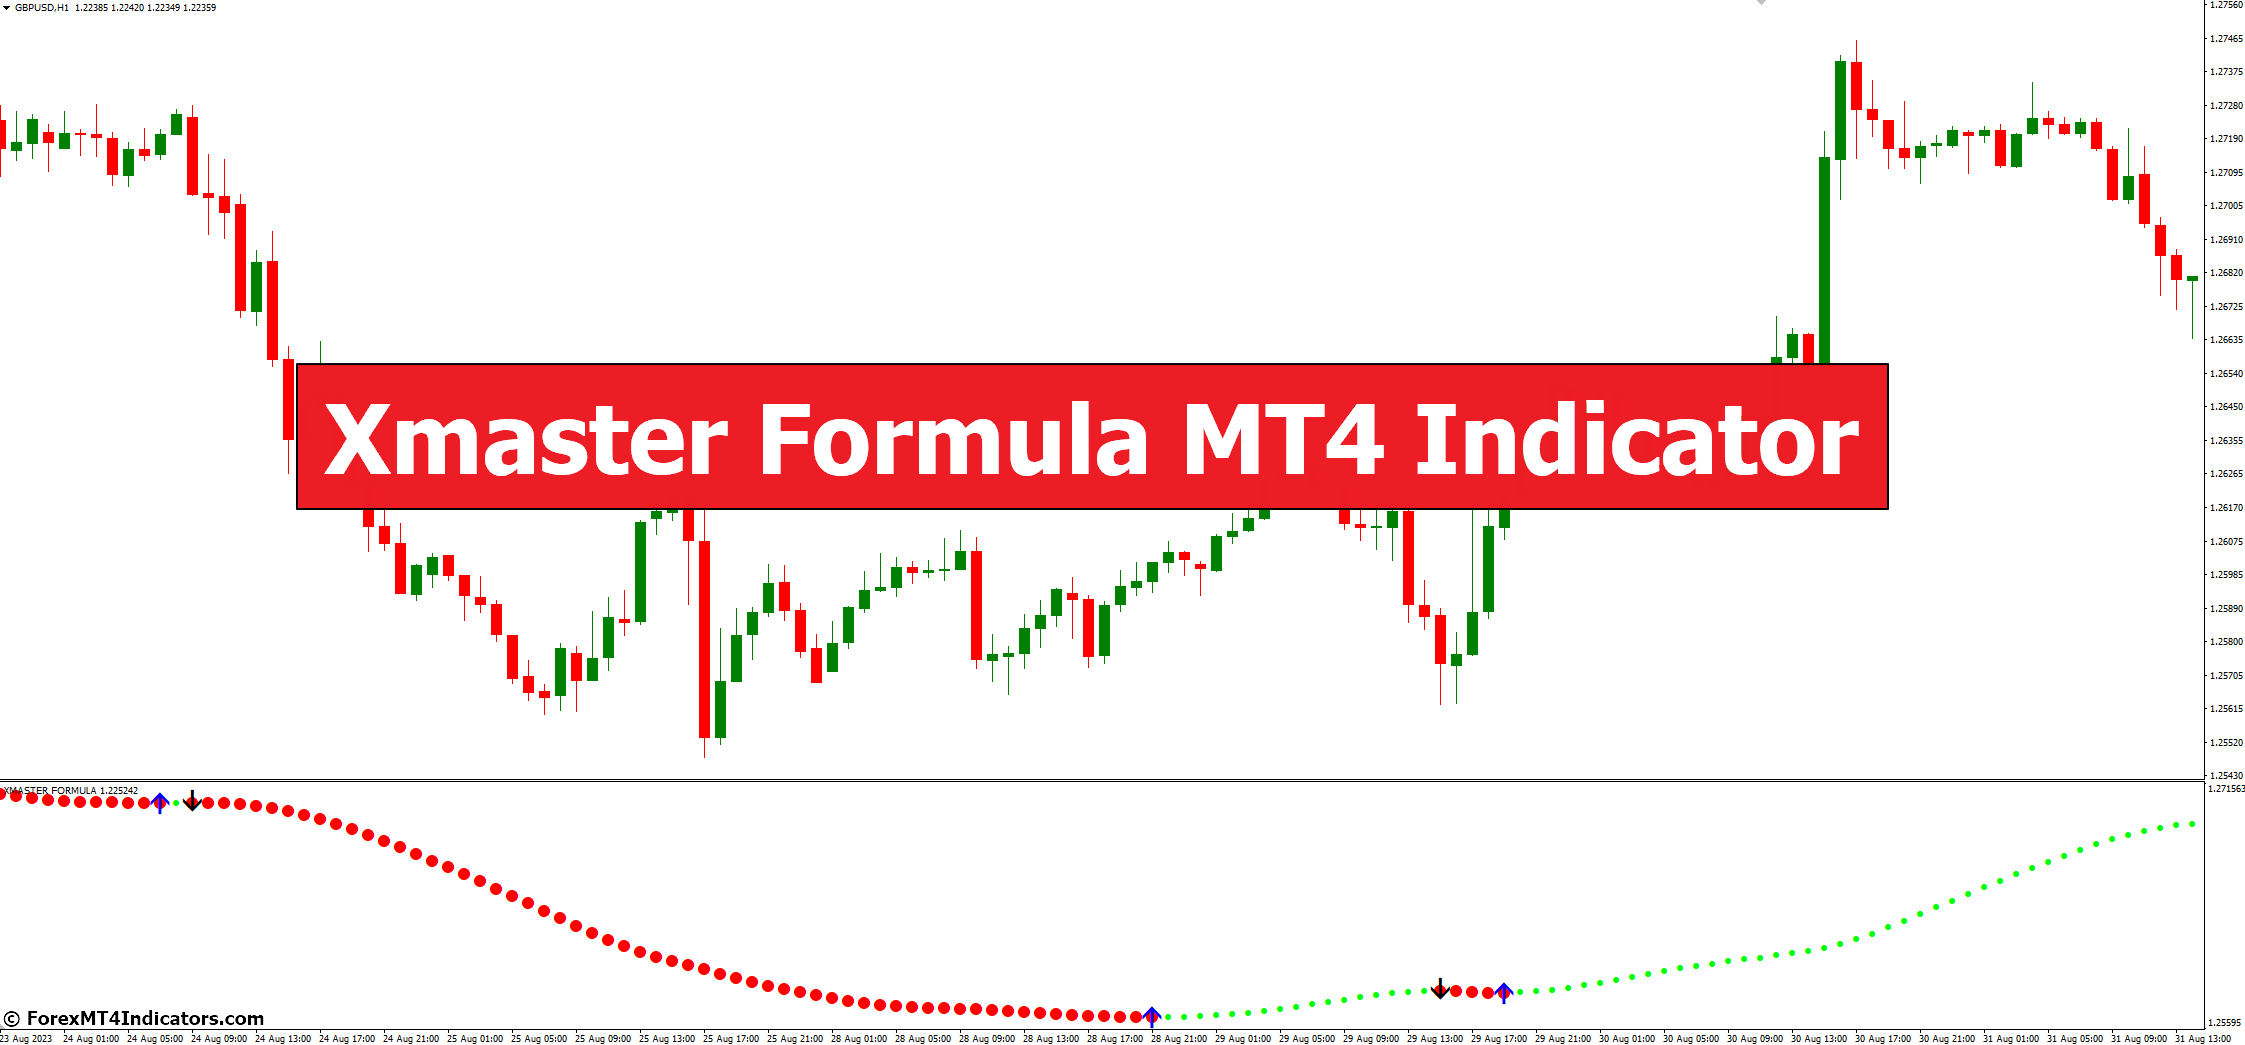
The XMaster Formula Indicator is a custom technical analysis tool built for MetaTrader 4. It reads price action data and outputs signals based on momentum calculations and price positioning relative to recent highs and lows.
At its core, it’s a trend-following and momentum indicator. It doesn’t predict the future — no indicator does. What it does is summarize where price has been and how strongly it’s been moving, then presents that information in a format that’s far easier to act on than raw candlestick charts alone.
Traders who pick this one up tend to fall into two camps. Some apply it as a standalone entry trigger. Others layer it on top of a broader trading plan to confirm what they already suspect the market is doing. Both approaches have their place, and the way you use it will depend on your trading style.
Naming note: you’ll see this tool written as both XMaster Formula and Xmaster Formula — they refer to the same MT4 indicator family, and this page hosts the current build we distribute. If you landed here searching for a year-stamped version (“Xmaster Formula 2023”, “2024”, and so on), use the download below — it is the newest copy on our site. Trading on MetaTrader 5 instead? Get the XMaster Formula Indicator for MT5, or see the complete Perfect Trendline + Xmaster Formula trading strategy.
How the Formula Works Under the Hood
Most indicator write-ups gloss over the math. That’s frustrating if you actually want to understand the tool you’re trusting with real money. So let’s break it down.
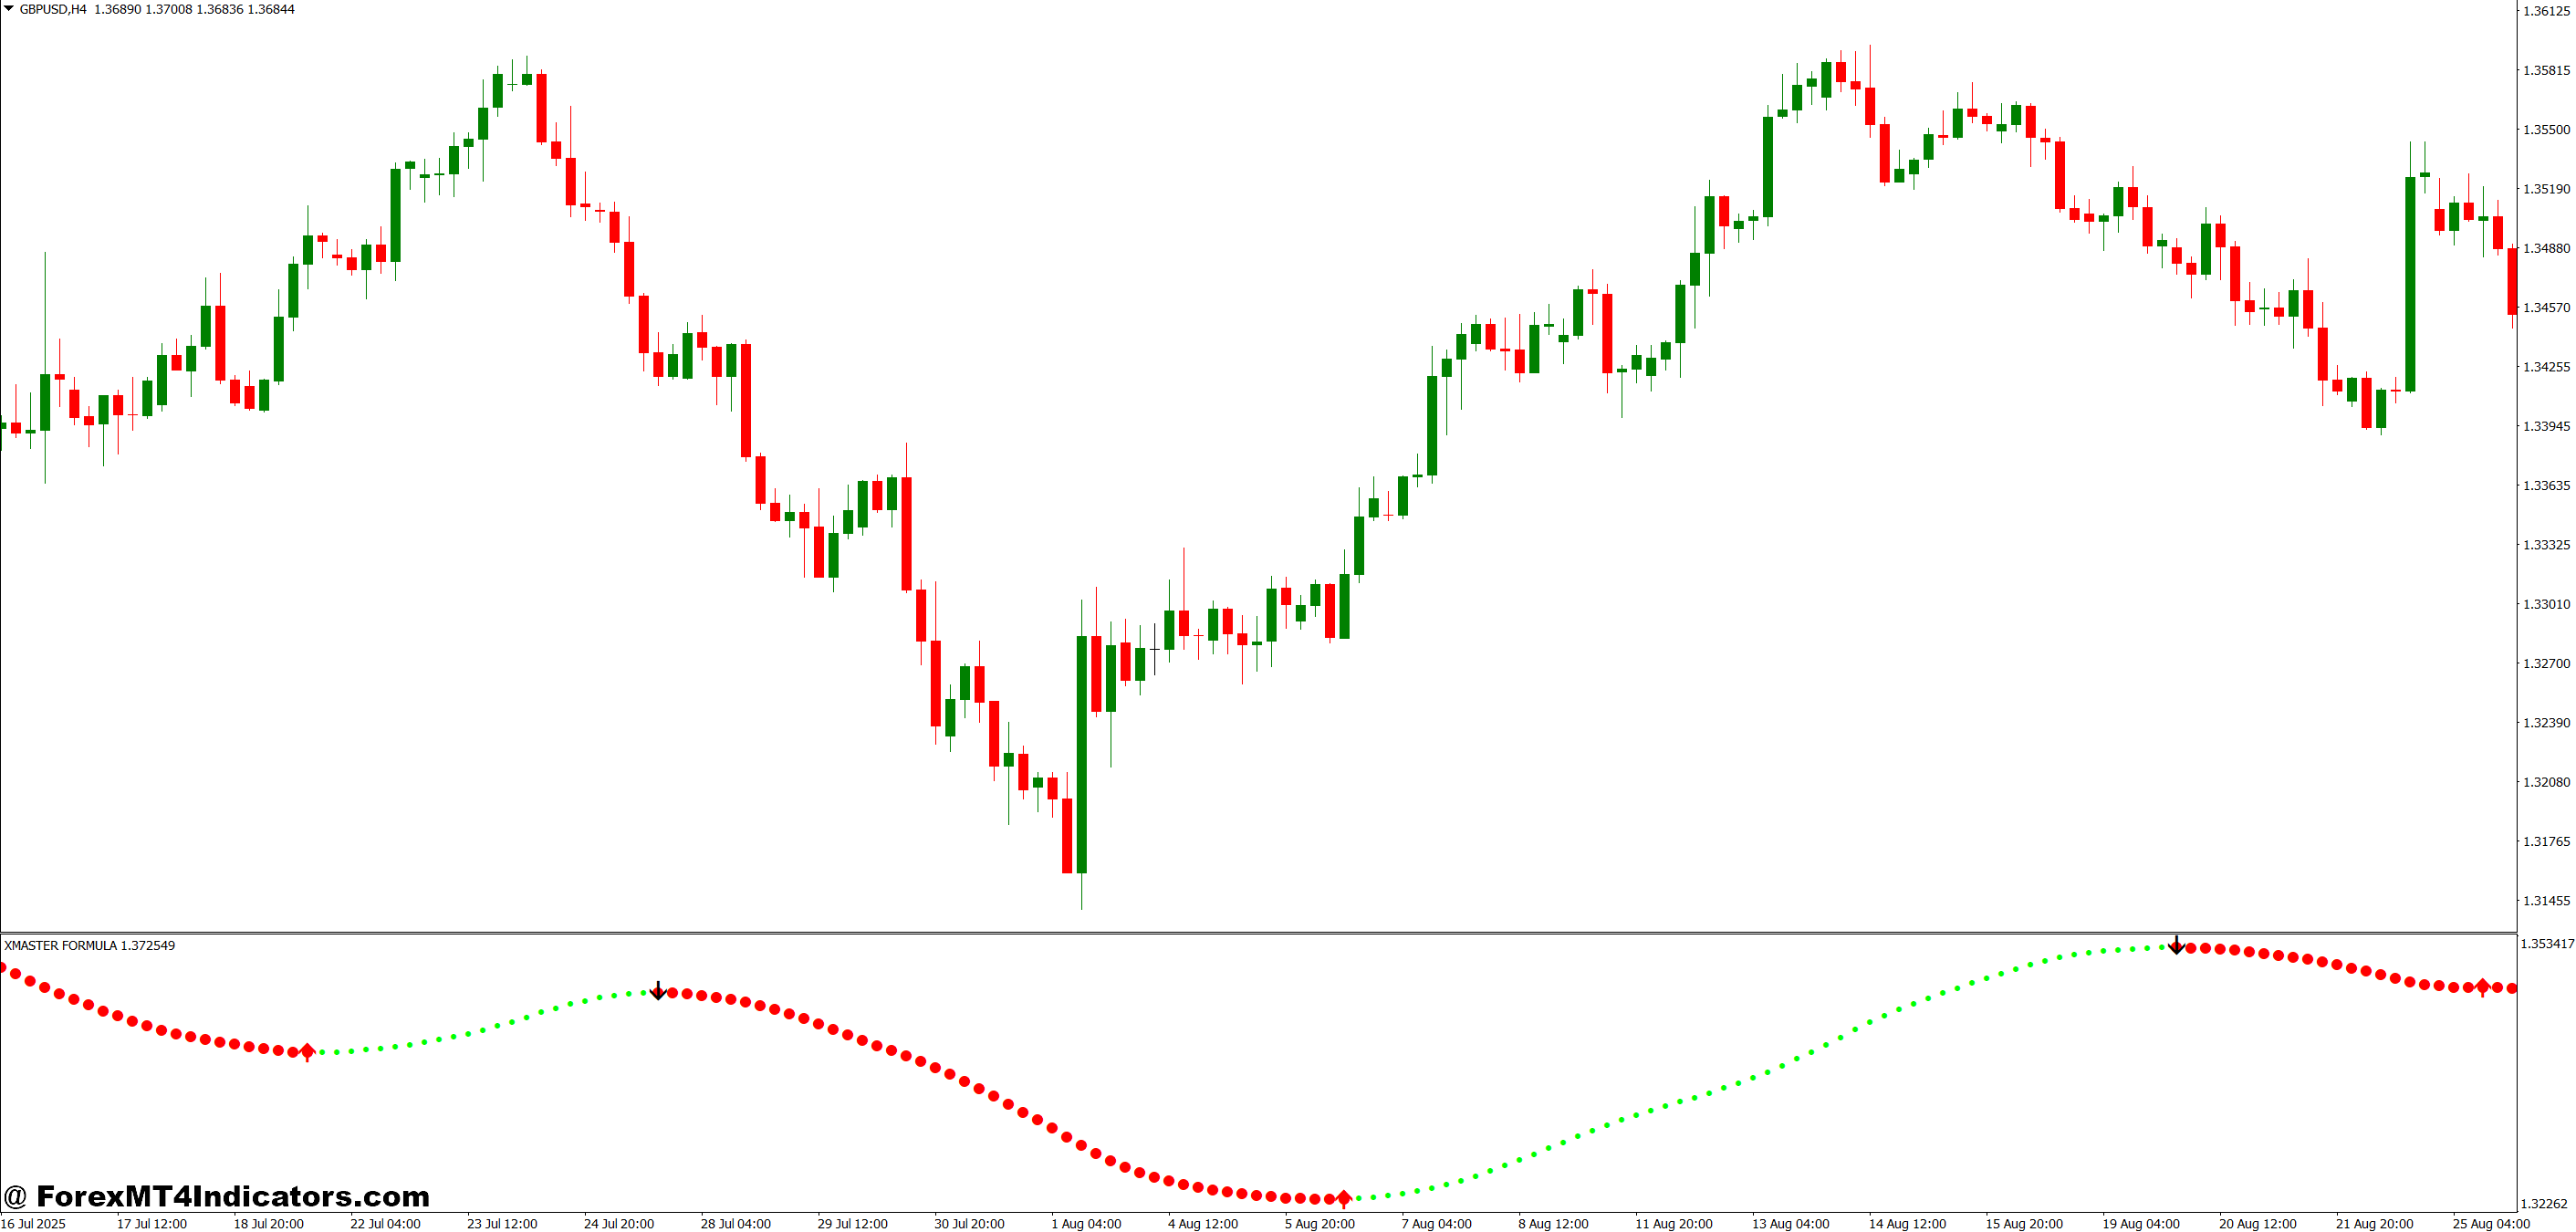
The XMaster Formula uses a weighted calculation that factors in recent price closes over a set lookback period. It compares the current price position against the average range of that period to determine momentum strength. When price moves sharply above or below this calculated band, the indicator flags it on your chart.
Think of it like this: if EUR/USD closes at 1.0850 after trading in a 1.0820–1.0845 band for the previous 14 bars, the indicator registers that as a significant momentum shift. Visually, you’ll see a color change or a dot appear — the exact output depends on the version you download.
And this is where it gets genuinely useful. The indicator doesn’t just show direction. It assigns weight to the move based on prior range activity. A breakout following a tight 30-pip consolidation carries more significance than the same price movement after a 100-pip swing. Traders often call this concept “reading the compression,” and the XMaster Formula does a solid job of quantifying it automatically.
XMaster Formula Indicator MT4 Settings
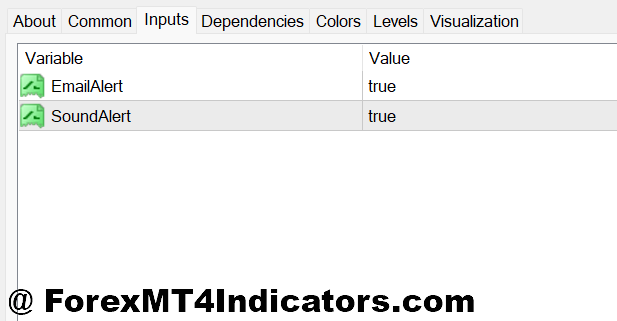
Installation is straightforward. Drop the .mq4 file into your MetaTrader 4 indicators folder, restart the platform, and drag it onto whichever chart you’re watching. Standard process.
The default settings work reasonably well on the 1-hour and 4-hour timeframes for major pairs like EUR/USD, GBP/USD, and USD/JPY. But most seasoned traders adjust things fairly quickly once they start watching how it behaves.
The period length is the main parameter to play with. The default usually sits around 14. On the 1-hour chart, this works fine for capturing intraday swings. But if you’re trading the 30-minute chart during high-volatility events — think NFP releases or ECB rate decisions — dropping it down to 8 or 10 tightens the response considerably. Price moves fast during those windows, and a 14-period setting will lag behind by the time you actually need to act.
On the daily chart, bumping the period up to 20 or even 24 smooths out the noise from overnight gaps and gives you a better read on medium-term trends. GBP/USD on the daily with a 20-period setting, for example, caught the early stages of the move from 1.2400 down toward 1.2100 in late 2024. Not a perfect entry, but early enough to be worth acting on.
Signal sensitivity is another tweak worth making. Lower sensitivity means fewer signals, but the ones you get tend to be more reliable. Crank it higher, and you’ll catch more moves — but you’ll also get whipsawed during choppy, sideways action that goes nowhere. For most pairs, a mid-range setting strikes the best balance.
How Traders Actually Use It in Real Trades
A common setup involves checking the XMaster Formula on the 4-hour chart to gauge the overall trend, then dropping to the 1-hour for timing your entry. On USD/JPY, when the 4-hour indicator shifted bullish in early November 2024, traders who waited for a matching 1-hour confirmation caught entries near 153.50 before the pair pushed up toward 156. That’s a meaningful move, and the multi-timeframe setup helped filter out the noise.
But here’s the thing — it doesn’t always work that cleanly. During the choppy consolidation phase in AUD/USD from mid-September through October 2024, the indicator produced several false signals on the 1-hour chart. Price would trigger a buy, rally 20–30 pips, and then reverse straight back into the range. Traders who ignored those fake-outs and waited for the 4-hour to back up their view avoided most of that damage.
This is normal behavior for any momentum-based indicator during range-bound conditions. The tool performs best when there’s a clear directional bias. Flat, choppy markets will always produce some bad reads. Knowing this going in saves a lot of frustration — and real money.
Pros, Cons, and How It Stacks Up Against Other Tools
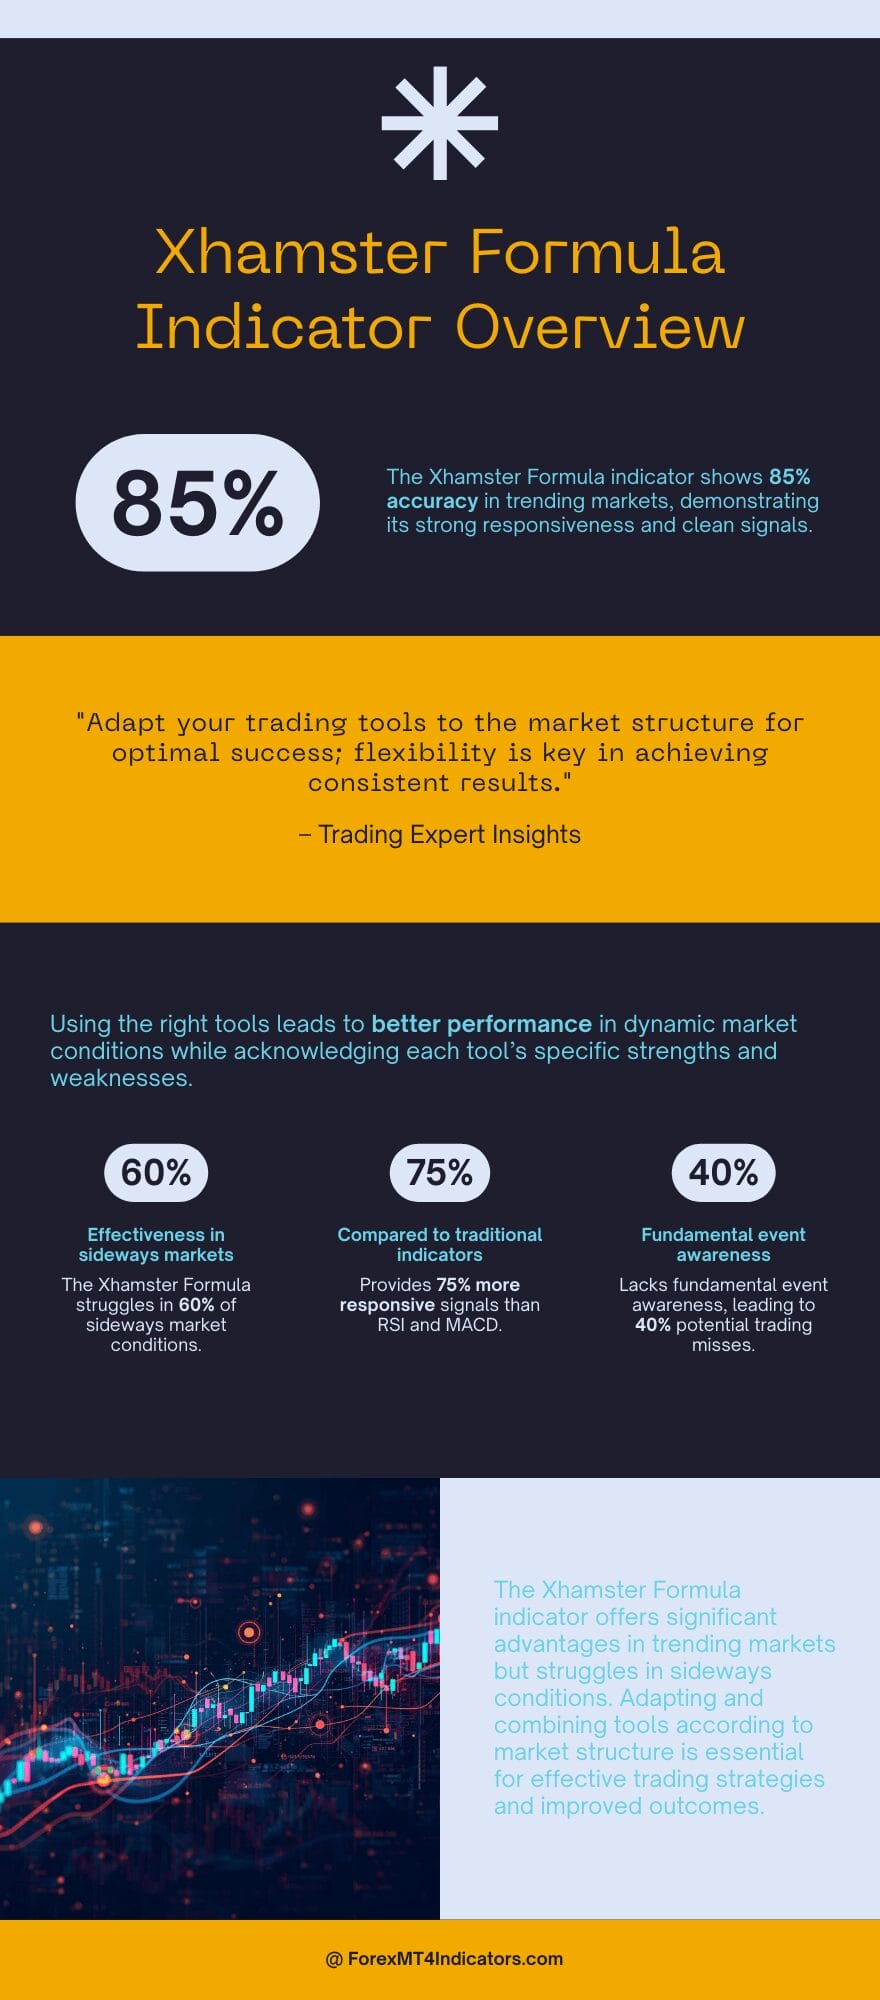
The XMaster Formula is responsive without being erratic, and that’s saying something for a custom indicator. It gives clean visual signals, and the underlying calculation logic produces meaningful reads during trending markets. Compared to a basic RSI or MACD setup, it integrates price range data more effectively, which makes a difference during breakout situations where other indicators are still catching up.
That said, it does have clear weaknesses. Like most momentum tools, it struggles in sideways markets. It also won’t account for fundamental events — a surprise central bank decision can blow right through any technical signal. And since it’s a single-purpose tool, leaning on it alone is a recipe for trouble.
How does it compare to something like the Awesome Oscillator or a well-tuned Stochastic? In trending conditions, the XMaster Formula tends to produce cleaner entry points for many traders. But during range-bound or choppy markets, a Stochastic combined with solid support and resistance levels will often outperform it. Neither tool is better across the board. The smart move is knowing which one fits the current market structure — and switching between them accordingly.
Case Study
To illustrate the practical application of the Xmaster Formula indicator, let’s consider a real-life scenario. Suppose you are trading the EUR/USD currency pair and notice a strong bullish signal generated by the Xmaster Formula indicator. Simultaneously, you observe a breakout above a significant resistance level on the price chart. This convergence of signals presents a compelling trading opportunity. Based on the indicator’s insights, you decide to enter a long position, anticipating further upward price movement. Throughout the trade, you monitor the indicator’s signals to trail your stop-loss order and secure profits as the market unfolds.

Remember that this is an illustrative example, not a typical result — the same setup can and does fail, which is why the stop-loss placement matters more than the entry.
How to Trade with XMaster Formula Indicator MT4
Buy Entry
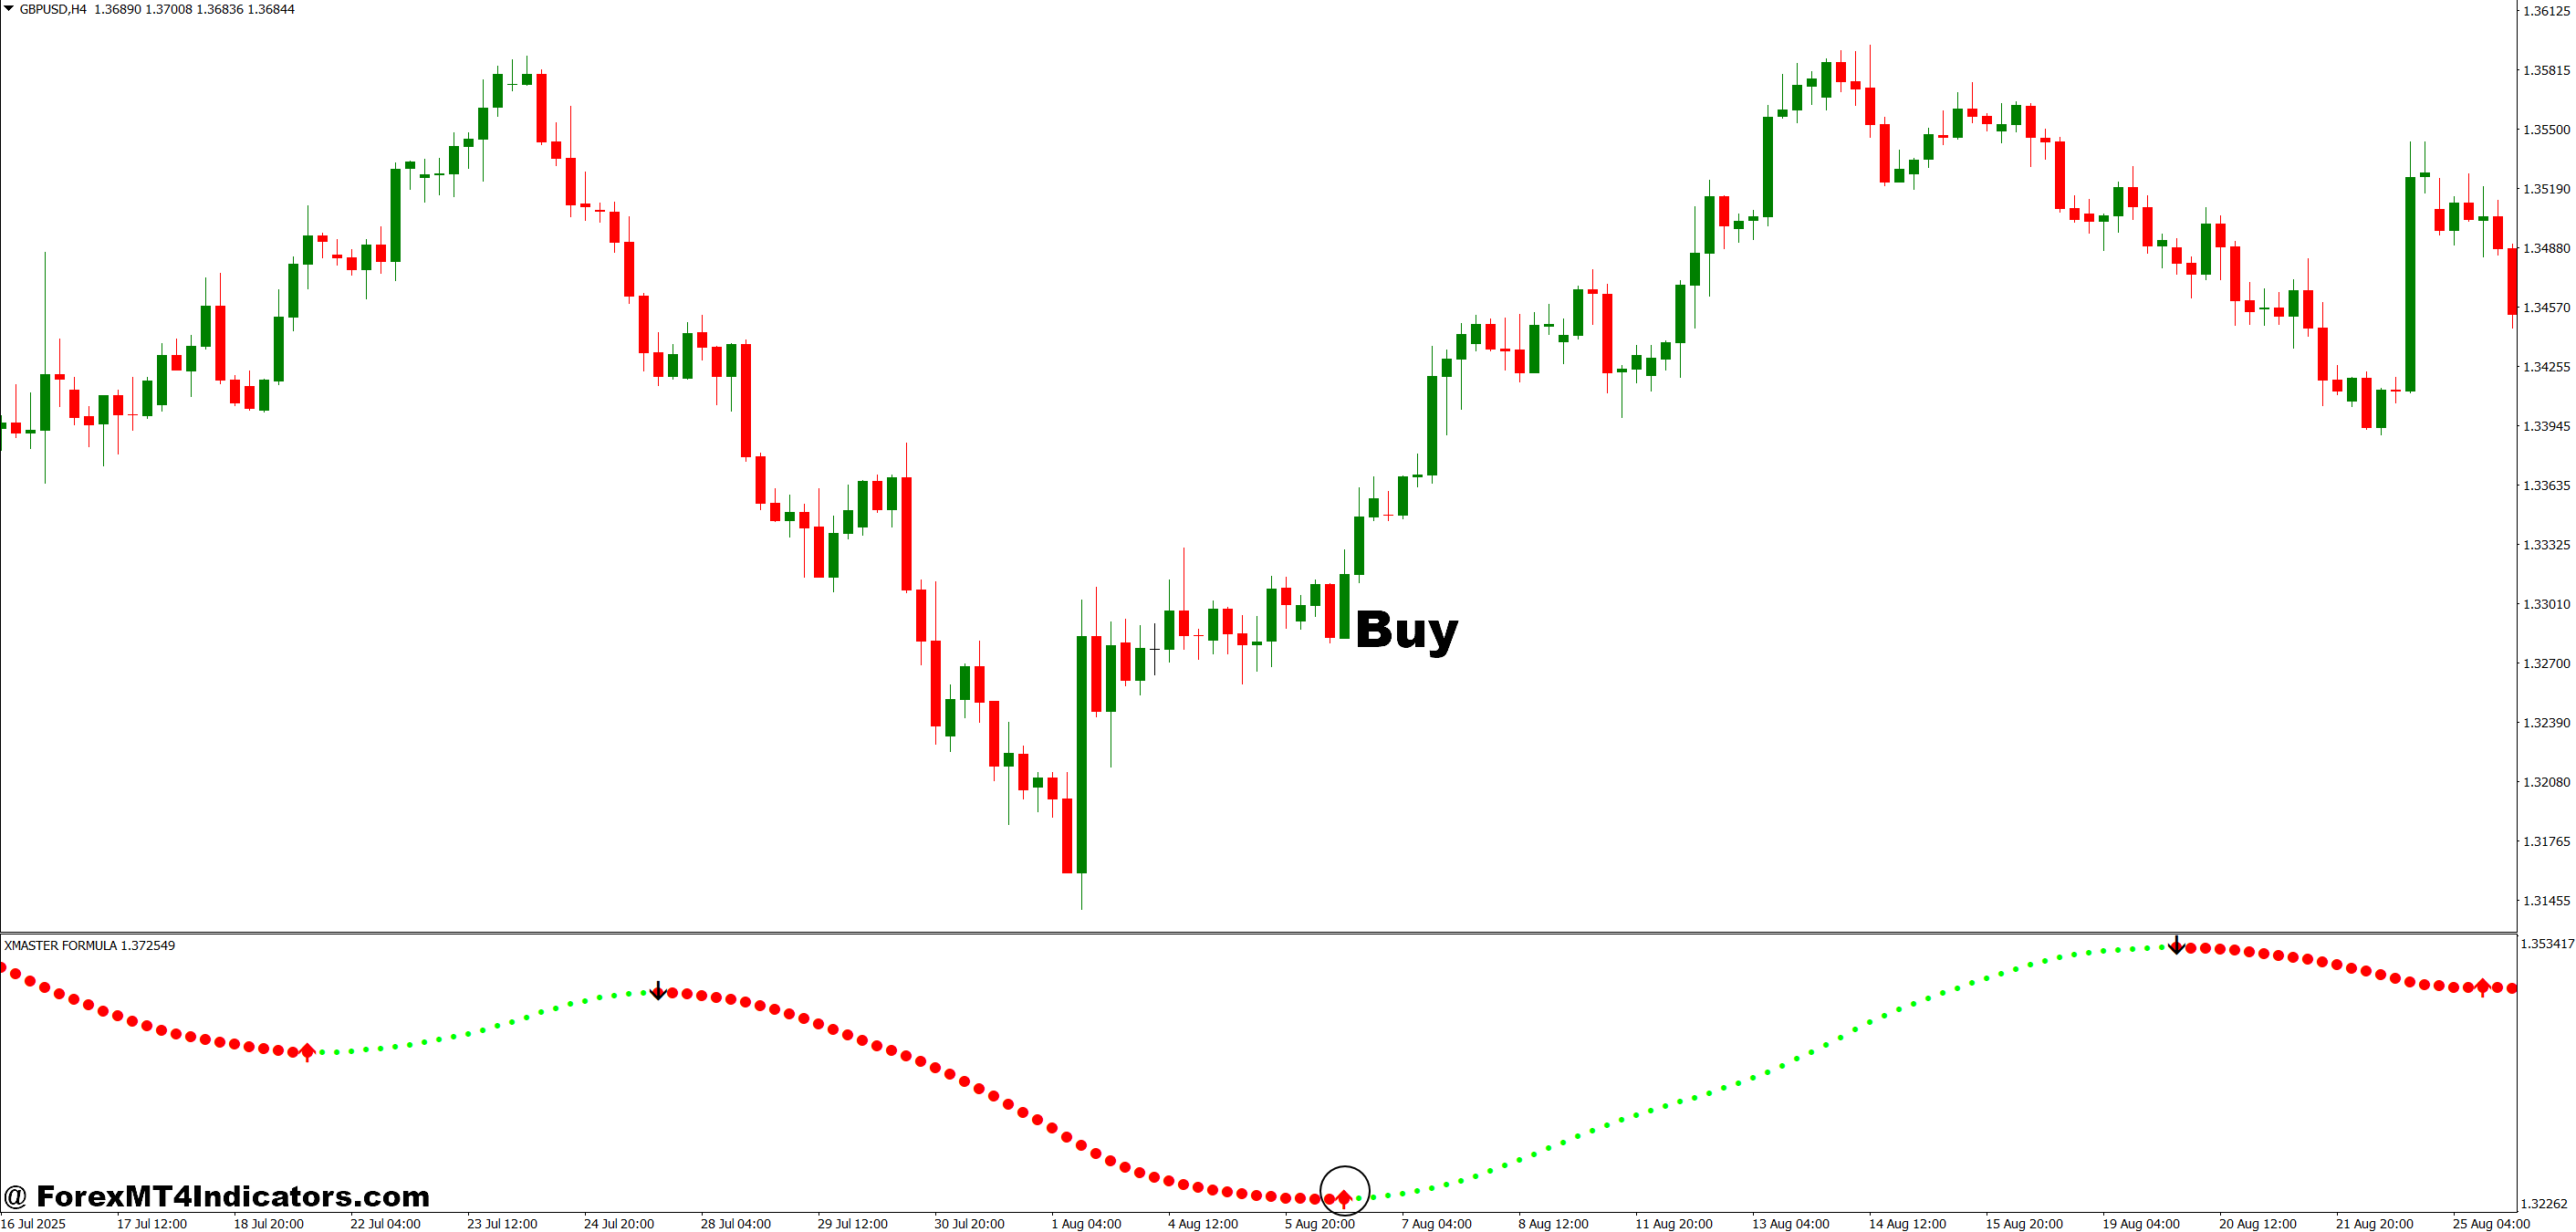
- Wait for the 4-hour confirmation first – Don’t enter on the 1-hour alone. The 4-hour chart must show a bullish shift before you even look at a 1-hour buy signal on EUR/USD or GBP/USD.
- Enter when price breaks above the upper band – Price must close above the indicator’s upper range, not just touch it. A wick touching doesn’t count — you need a full candle close above it.
- Set your stop-loss 15–20 pips below the entry candle low – Tight stops get hit by normal market noise. Keep your SL under the consolidation low to give the trade breathing room.
- Target the next 40–60 pip resistance level – On the 1-hour chart, map out the nearest resistance beforehand. Don’t chase — let price come to your levels.
- Only buy after a 30-minute or tighter consolidation zone – A breakout from a compressed range carries more weight. If price has been chopping in a wide 80+ pip range, skip it.
- Check that RSI is above 50 before pulling the trigger – The XMaster signal alone isn’t enough. RSI above 50 confirms momentum is actually building, not faking out.
- Avoid buying on EUR/USD right before NFP or ECB announcements – News spikes create fake breakouts. Stay out 30 minutes before and after major releases.
- Scale in with a second small lot if price pulls back 10–15 pips after entry – Don’t add to losers. Only add if the 4-hour signal is still holding bullish and price retraces cleanly.
Sell Entry
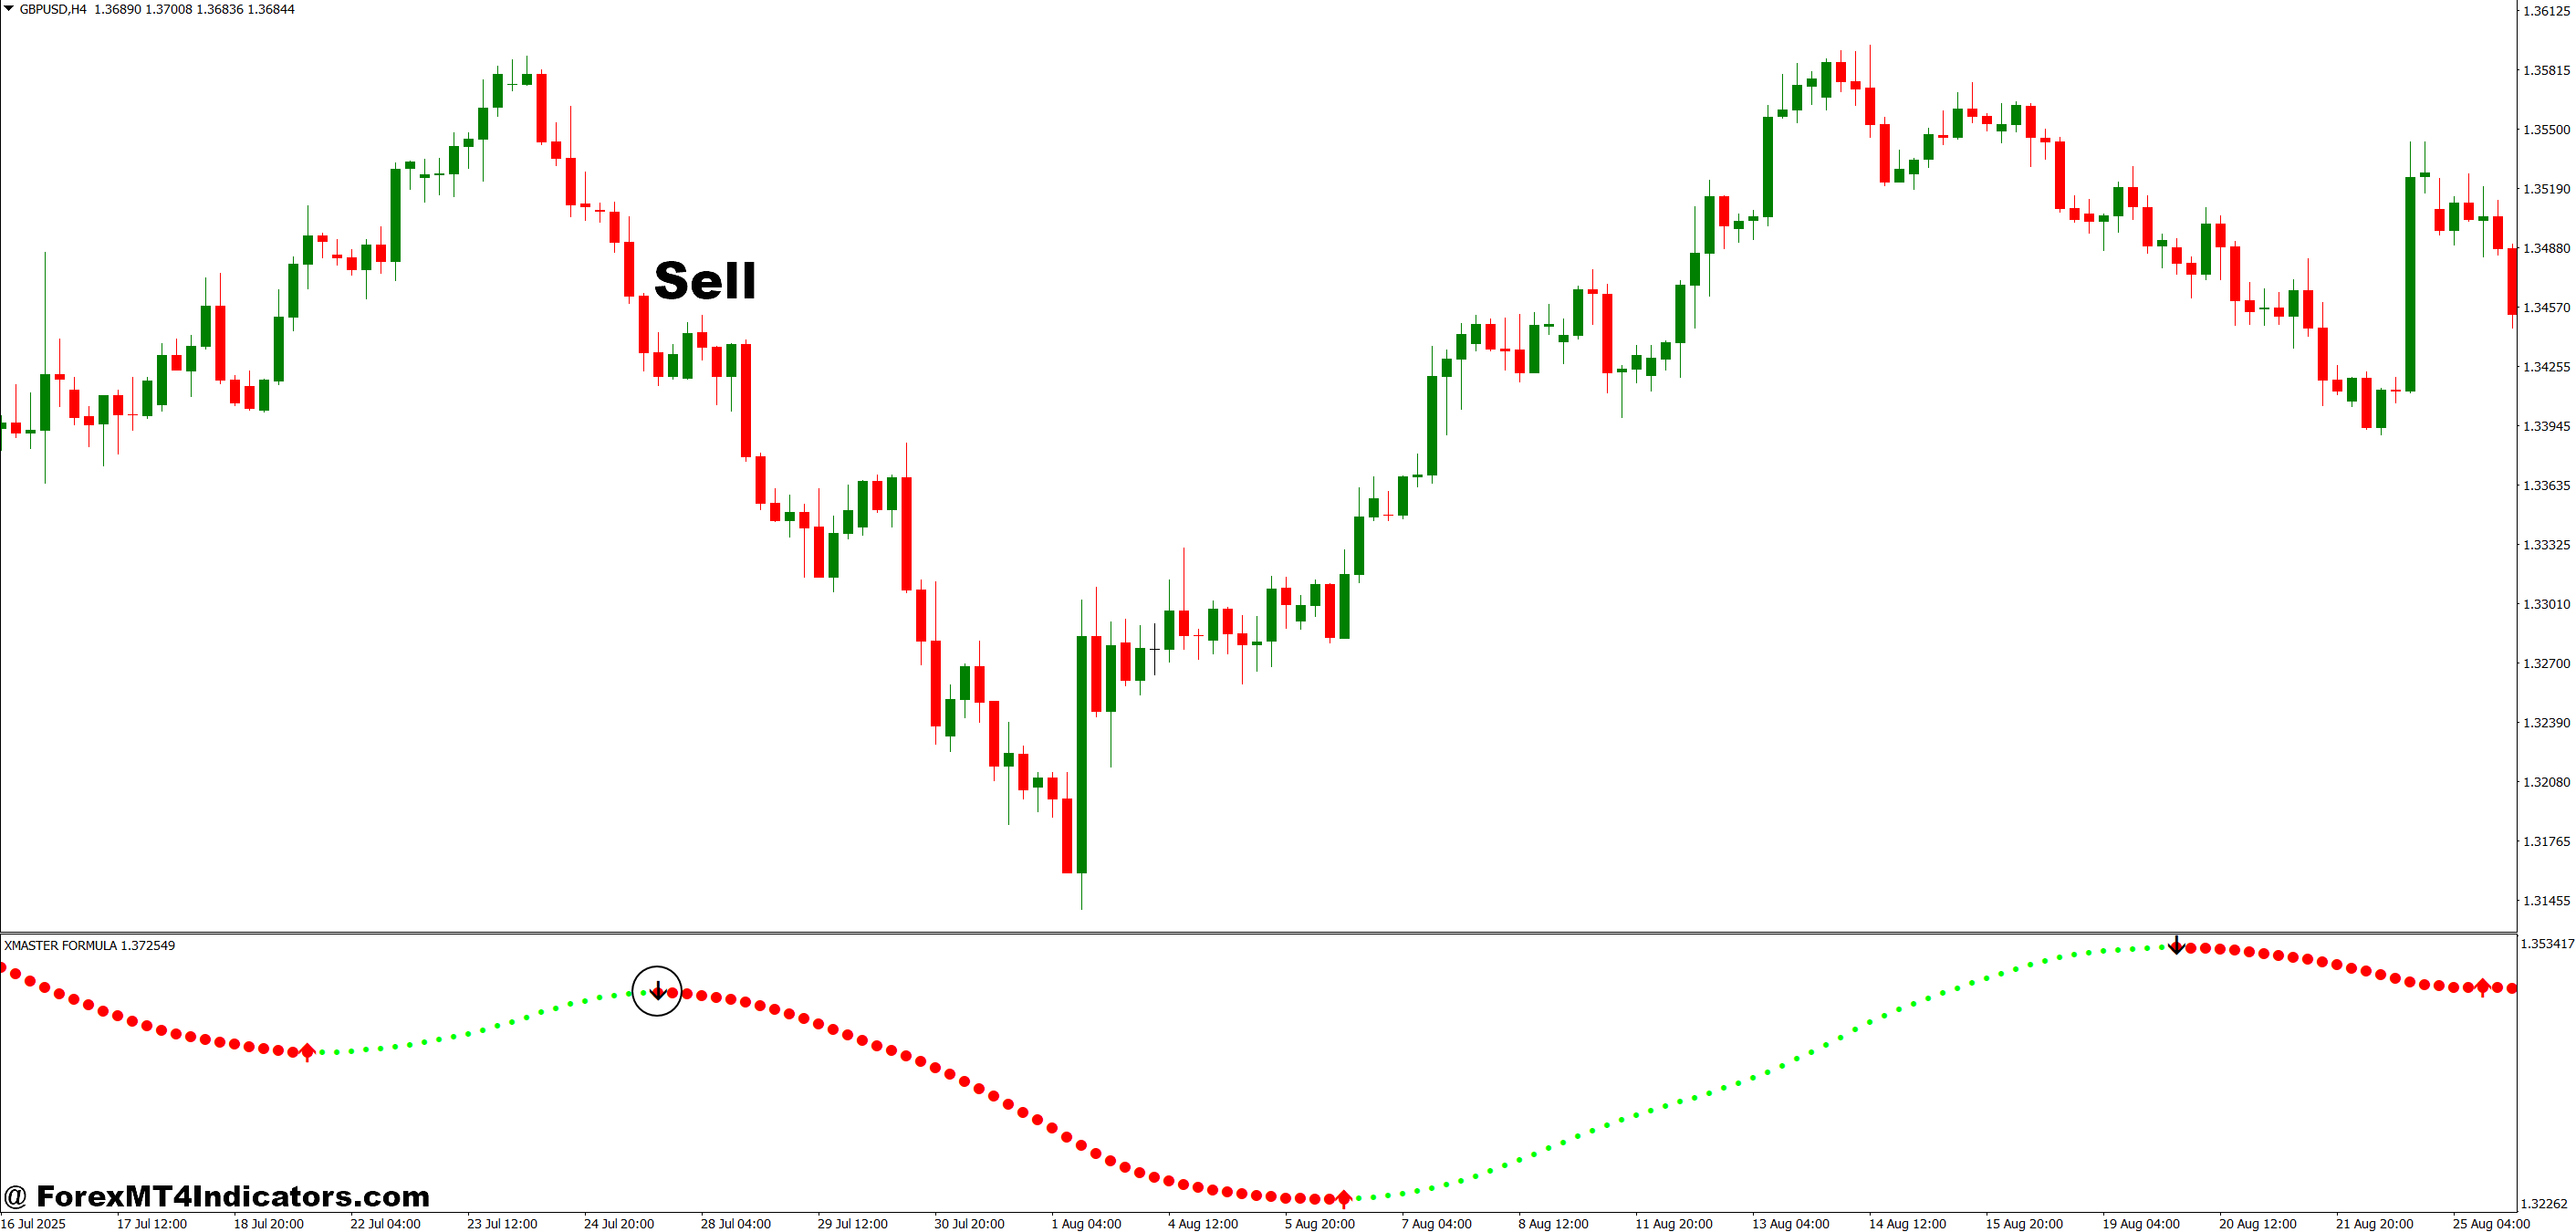
- Confirm the 4-hour chart is showing a bearish shift first – Same rule as buying — top-down analysis matters. If the 4-hour is still bullish, don’t sell on the 1-hour no matter what.
- Enter when price closes below the lower band – A full candle must close under the indicator’s lower range. Don’t short on a wick — wait for confirmation on the close.
- Place your stop-loss 15–20 pips above the entry candle high – Protect the trade without squeezing it. The stop needs to sit above the recent high, not right on top of it.
- Target 40–60 pips below your entry – On GBP/USD or USD/JPY, identify the next support level before entering. Lock in profits at that zone — don’t hold hoping for more.
- Only sell after price fails to hold a consolidation high – If price tested a level twice and got rejected both times, that’s your signal. One failed attempt isn’t enough.
- Confirm RSI is below 50 before entering the short – RSI under 50 tells you sellers are actually in control. A sell signal with RSI sitting at 60 is a setup for a whipsaw.
- Skip sell signals during low-liquidity sessions – Asian session hours on EUR/USD or GBP/USD see thin volume. Spreads widen, and stops get slippage. Wait for London or New York overlap.
- Cut the trade early if price moves back above the lower band within 2 candles – Don’t hold a loser out of stubbornness. A quick reversal back into the band means the signal was a fake-out — get out flat and wait for the next setup.
FAQs
1. Can the Xmaster Formula indicator be used on multiple currency pairs?
Yes, the Xmaster Formula indicator is designed to be used on multiple currency pairs within the MetaTrader 4 platform. Its versatility allows traders to apply it to various forex pairs and analyze different market dynamics.
2. Does the Xmaster Formula Forex indicator repaint or recalculate signals?
No, the Xmaster Formula indicator does not repaint or recalculate signals once they have formed. The signals remain fixed once the candle closes — what you backtest is what you would have seen live.
3. What timeframes are most suitable for using the Xmaster Formula Forex indicator?
The Xmaster Formula indicator can be applied to different timeframes, including short-term and long-term charts. The choice of timeframe depends on your trading style and preferences.
4. Can the Xmaster Formula Forex indicator be used in conjunction with other indicators?
Absolutely! The Xmaster Formula indicator can be combined with other technical indicators, such as moving averages, oscillators, or trend lines, to enhance your analysis and confirm trading signals.
5. Are there any recommended settings for the Xmaster Formula Forex indicator?
The default settings of the Xmaster Formula indicator are a good starting point. However, it is recommended to conduct your own testing and optimization based on your trading style, currency pairs, and timeframes to find the settings that work best for you.
Final Thoughts
The XMaster Formula Indicator MT4 is a useful addition to a trader’s toolkit, but only when used correctly. It’s not a one-click solution, and it won’t save you from a bad trading plan. It works best as part of a structured approach that includes timeframe confirmation, proper risk management, and a clear understanding of what the market is doing right now.
The key points are worth keeping in mind: adjust your period settings to match the timeframe you’re trading, don’t act on signals during choppy consolidation, and always look for confirmation from a higher timeframe before committing capital. If you’re going to test the XMaster Formula, start on a demo account. Run it across different market conditions for at least two to three weeks before putting real money behind its signals. That’s how you build actual confidence in any new trading tool — not by reading about it, but by watching it work firsthand.
Level up your trading Learn to read the chart — not just the indicator eBook · Instant PDF Video Course · 12 modules Trading forex and CFDs carries a significant risk of loss and is not suitable for everyone. Broker links are affiliate links — we may earn a commission at no cost to you.Recommended MT4/MT5 Brokers
Free MT4 Indicator Download

Enter Your Email Address below, download link will be sent to you.
