

The Forex Signal 30 Extreme Indicator MT4 is designed to help with this problem by highlighting potential turning points and directional signals directly on the MetaTrader 4 chart.
The real issue is what happens after a missed entry. A trader may chase the move, enter near resistance, or take the next signal without checking market structure. One bad decision can turn into several trades, especially after a whipsaw. Drawdown then increases while confidence drops.
The indicator can give traders a more structured way to spot possible buy and sell opportunities. It works best when its signals are checked against price action, support and resistance, and the broader trend. The following sections explain how traders can use it without treating every arrow as an automatic trade.
What Is the Forex Signal 30 Extreme Indicator MT4?
The Forex Signal 30 Extreme Indicator MT4 is a custom technical indicator for MetaTrader 4 that identifies potential bullish and bearish trading areas. Depending on the version, it may display signals, arrows, or other visual markers when its internal conditions suggest that price could reverse or continue in a particular direction.
Unlike a simple moving average, a signal indicator normally combines several price-based conditions. These can include recent highs and lows, momentum, price distance from an internal reference level, and short-term changes in market direction. The exact formula can differ between versions, so traders should check the indicator’s input settings and source documentation rather than assume that every Forex Signal 30 Extreme installation uses the same calculation.
The word “Extreme” is useful from a trading perspective. The concept generally focuses on areas where price has moved strongly enough to become stretched relative to recent conditions. For example, if EUR/USD falls sharply into a well-tested H1 support zone and the indicator produces a bullish signal, the setup becomes more interesting than a bullish signal appearing in the middle of a strong downtrend.
That distinction matters. An indicator signal is only one piece of evidence.
How the Indicator Works in Real Market Conditions
A practical approach starts with the higher timeframe. Suppose EUR/USD is trading on the 1-hour chart and has moved from 1.0860 to 1.0780 over several sessions. Price then reaches an established support area around 1.0770–1.0780. If the indicator prints a buy signal near that zone and the next H1 candle closes bullish, a trader has several pieces of information pointing in the same direction.
The trader could wait for a break above the signal candle’s high instead of entering immediately. If that high sits at 1.0790, an entry around 1.0791 gives the setup a clear trigger. A stop-loss might sit 15–25 pips below the recent swing low, while a first target could be 30–40 pips away.
This approach also helps filter fake-outs. Imagine GBP/USD produces a sell signal at 1.2740, but price is only 8 pips below major H4 support. Selling immediately leaves little room before the next buying area. Waiting for a support break and a retest can produce a much cleaner trade.
When testing the indicator on volatile NFP days, traders should be especially careful. A signal can appear during a rapid 30–50 pip candle and disappear into the noise created by spreads and slippage. Waiting for the candle to close is often safer than reacting to an intrabar signal.
A simple confirmation process
A trader can check four things before taking a signal:
- Is the signal near meaningful support or resistance?
- Does the higher timeframe agree with the direction?
- Has the signal candle actually closed?
- Is there enough space for at least a 1:1.5 or 1:2 risk-to-reward setup?
If three or four answers are positive, the trade deserves closer attention. If the signal appears directly against strong market structure, skipping it can be the better decision.
Settings for Different Pairs and Timeframes
The best settings depend on how frequently a trader wants signals and how much market noise they can tolerate. Lower timeframes usually produce more signals, but they also create more false entries.
For M5 and M15 trading, a trader might focus on major pairs such as EUR/USD and GBP/USD during active London or New York sessions. A 10–15 pip stop may work for some EUR/USD setups during quieter periods, while GBP/USD may require 15–25 pips because its intraday swings can be larger.
On the H1 chart, traders can use wider structural stops. A 20–40 pip stop is common in many EUR/USD setups, although volatility should determine the actual distance. For H4 trading, the indicator can be treated more as a location tool than a rapid entry system.
A useful starting framework is:
| Timeframe | Main Use | Typical Stop Range* |
|---|---|---|
| M5 | Short-term entries | 5–12 pips |
| M15 | Intraday setups | 10–20 pips |
| H1 | Swing/intraday confirmation | 20–40 pips |
| H4 | Larger market moves | 40–80+ pips |
*These are example ranges, not fixed rules. Recent volatility and the pair’s structure should determine the actual stop.
Settings should also be tested separately for each pair. A configuration that behaves well on EUR/USD may generate excessive signals on GBP/JPY. Traders should use historical testing and forward testing on a demo account before applying a new configuration to live funds.
Strengths, Weaknesses, and Comparison With Other Indicators
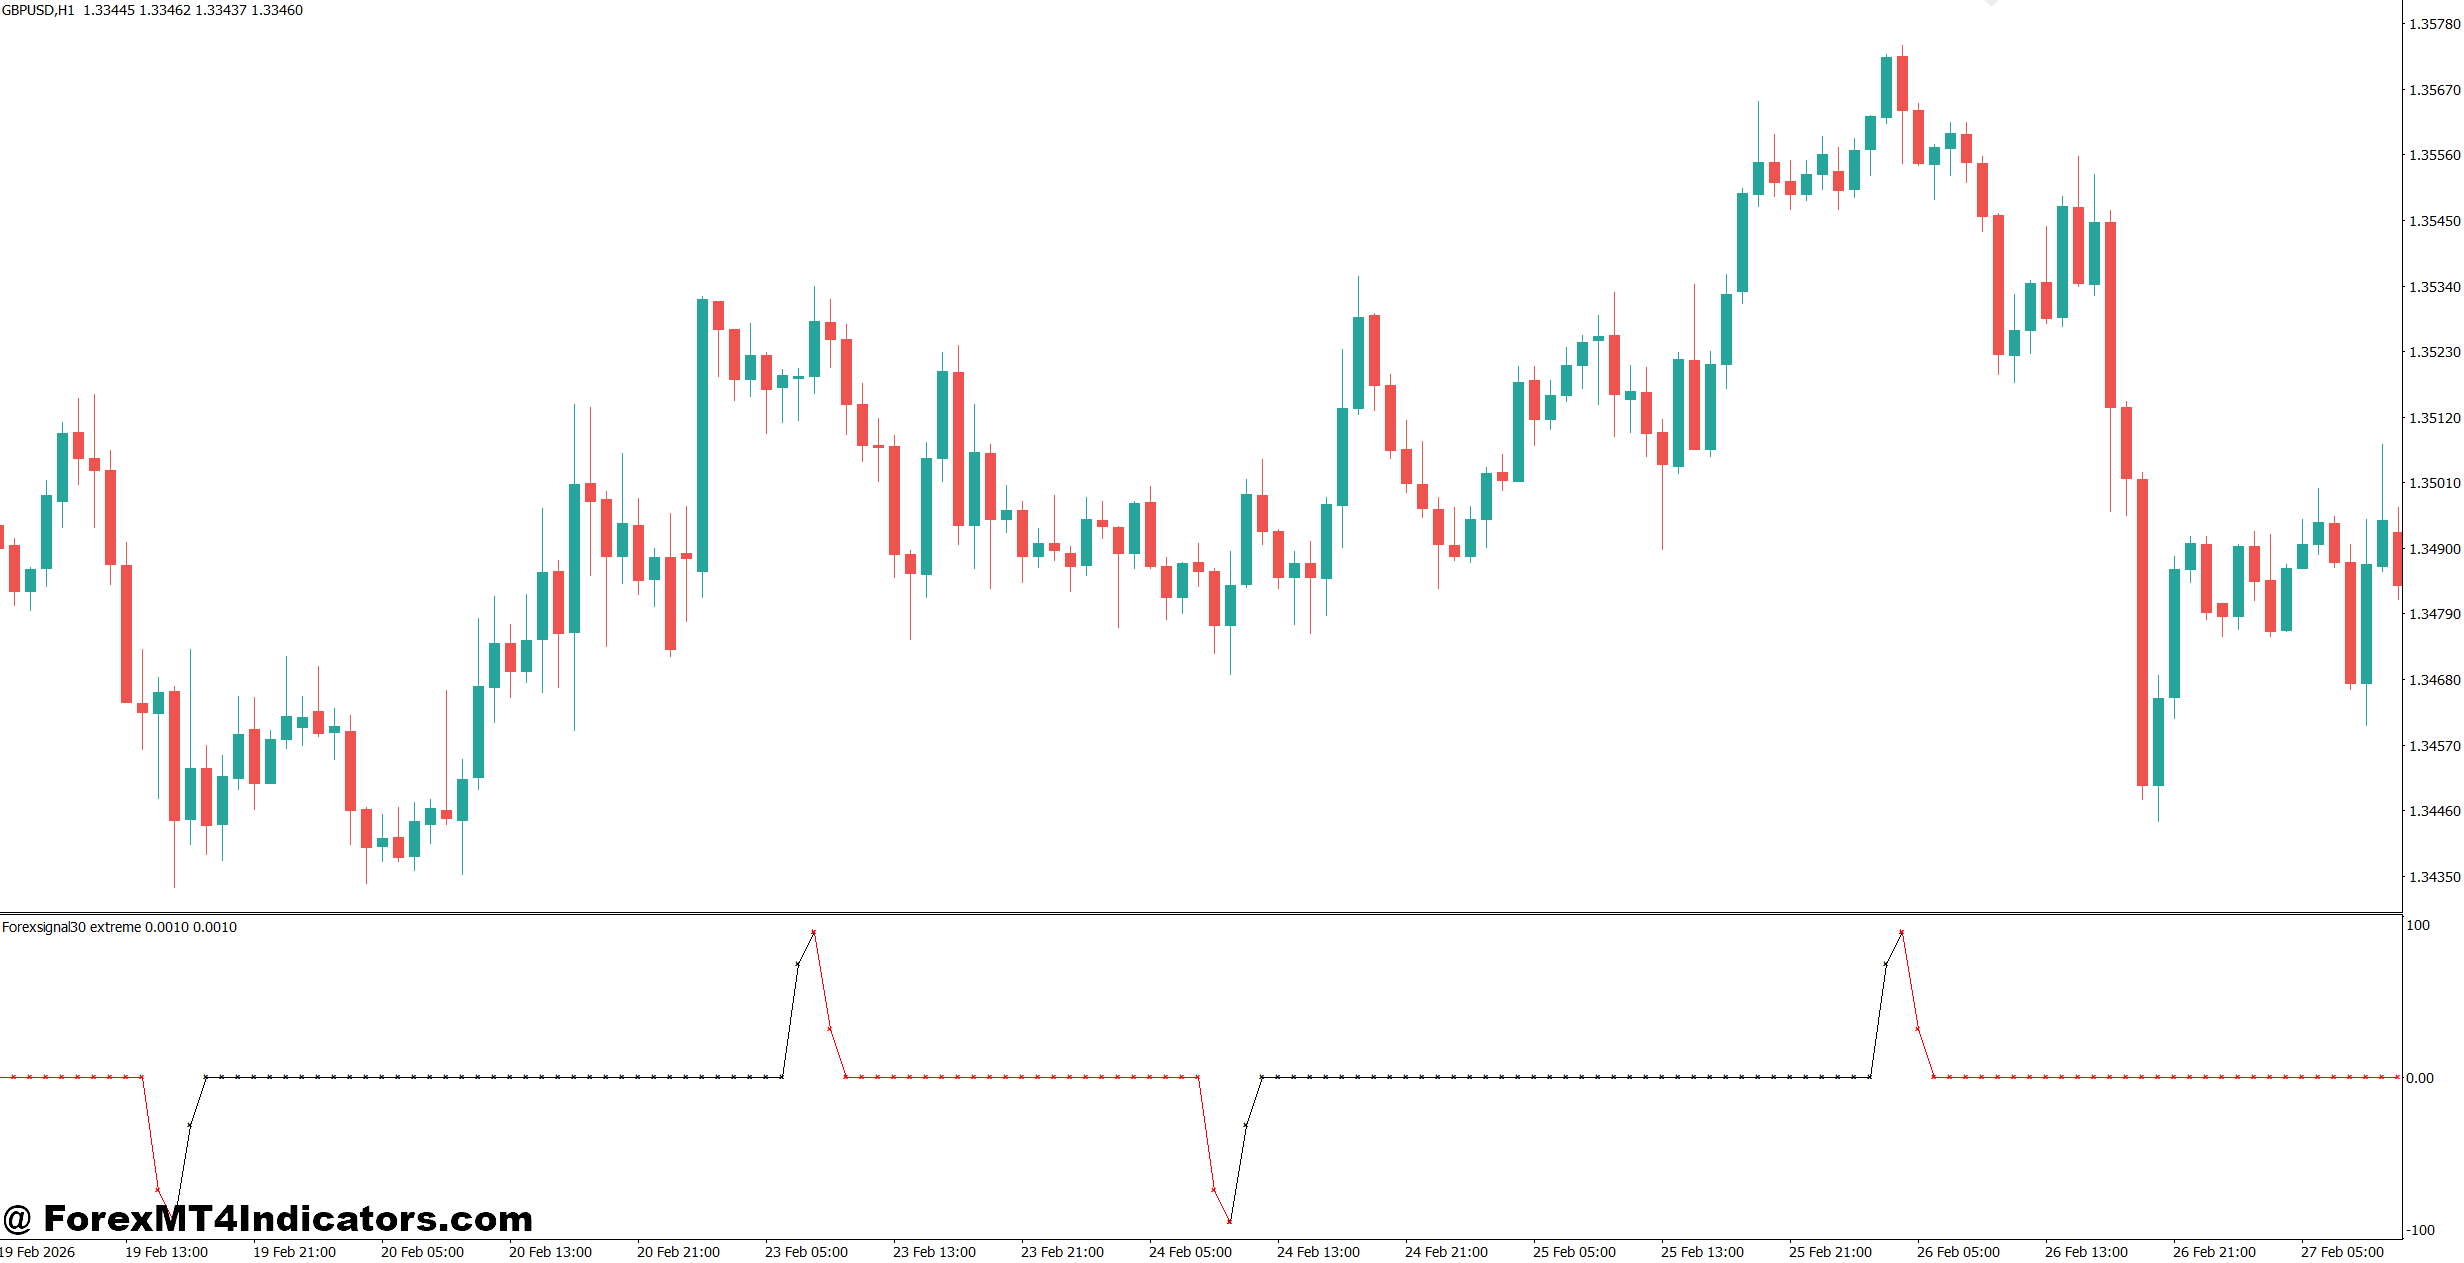
One advantage of a signal-based MT4 indicator is speed. Instead of manually scanning every candle for a possible reversal, the trader receives a visual prompt. This can be helpful when monitoring several currency pairs.
It can also work well alongside support and resistance. For example, a bullish signal at random prices has limited value. The same signal appearing after a liquidity sweep below yesterday’s low and a strong rejection candle is much more useful.
But the indicator has weaknesses. It can produce whipsaws during sideways markets, and some custom indicators may change signals before a candle closes. Traders should therefore avoid assuming that a historical chart full of accurate-looking arrows represents the exact signals that were available in real time.
Compared with the 14-period RSI, the Forex Signal 30 Extreme Indicator is more focused on giving direct trade prompts rather than simply showing momentum conditions. RSI can show an oversold reading below 30, but oversold does not automatically mean price will rise. A strong downtrend can keep RSI oversold for an extended period.
Compared with a 20-period moving average, the signal indicator may react faster to short-term turning points. The moving average, however, provides a cleaner view of trend direction. Combining the two can make sense: a trader could favor buy signals above a rising 20-period moving average and sell signals below a falling one.
A practical EUR/USD example shows the difference. If H1 price remains above a rising 20 EMA, pulls back 25 pips toward support, and then prints a bullish Forex Signal 30 Extreme signal, the setup has trend, location, and signal confirmation. If the same signal appears below a sharply falling EMA, it deserves more skepticism.
Risk Management Matters More Than the Signal
A good signal cannot compensate for poor position sizing. If a trader risks 5% of the account on every indicator signal, even a short losing streak can create serious damage. Many traders keep individual trade risk around 0.5%–1%, particularly while testing a new strategy.
For example, with a $5,000 account and 1% risk, the maximum planned loss is $50. If the EUR/USD setup requires a 25-pip stop, the position size should be calculated so that a full stop-out remains close to that $50 limit.
Traders should also avoid stacking several signals that are effectively the same trade. A buy signal on EUR/USD, GBP/USD, and GBP/JPY may look like three opportunities, but all three can react negatively to the same US dollar move.
Trading forex carries substantial risk. No indicator guarantees profits. Signals should be tested on historical data and a demo account before traders risk real capital. News events, spreads, slippage, execution speed, and market liquidity can all change the outcome of an otherwise attractive setup.
How to Trade with Forex Signal 30 Extreme Indicator MT4
Buy Entry
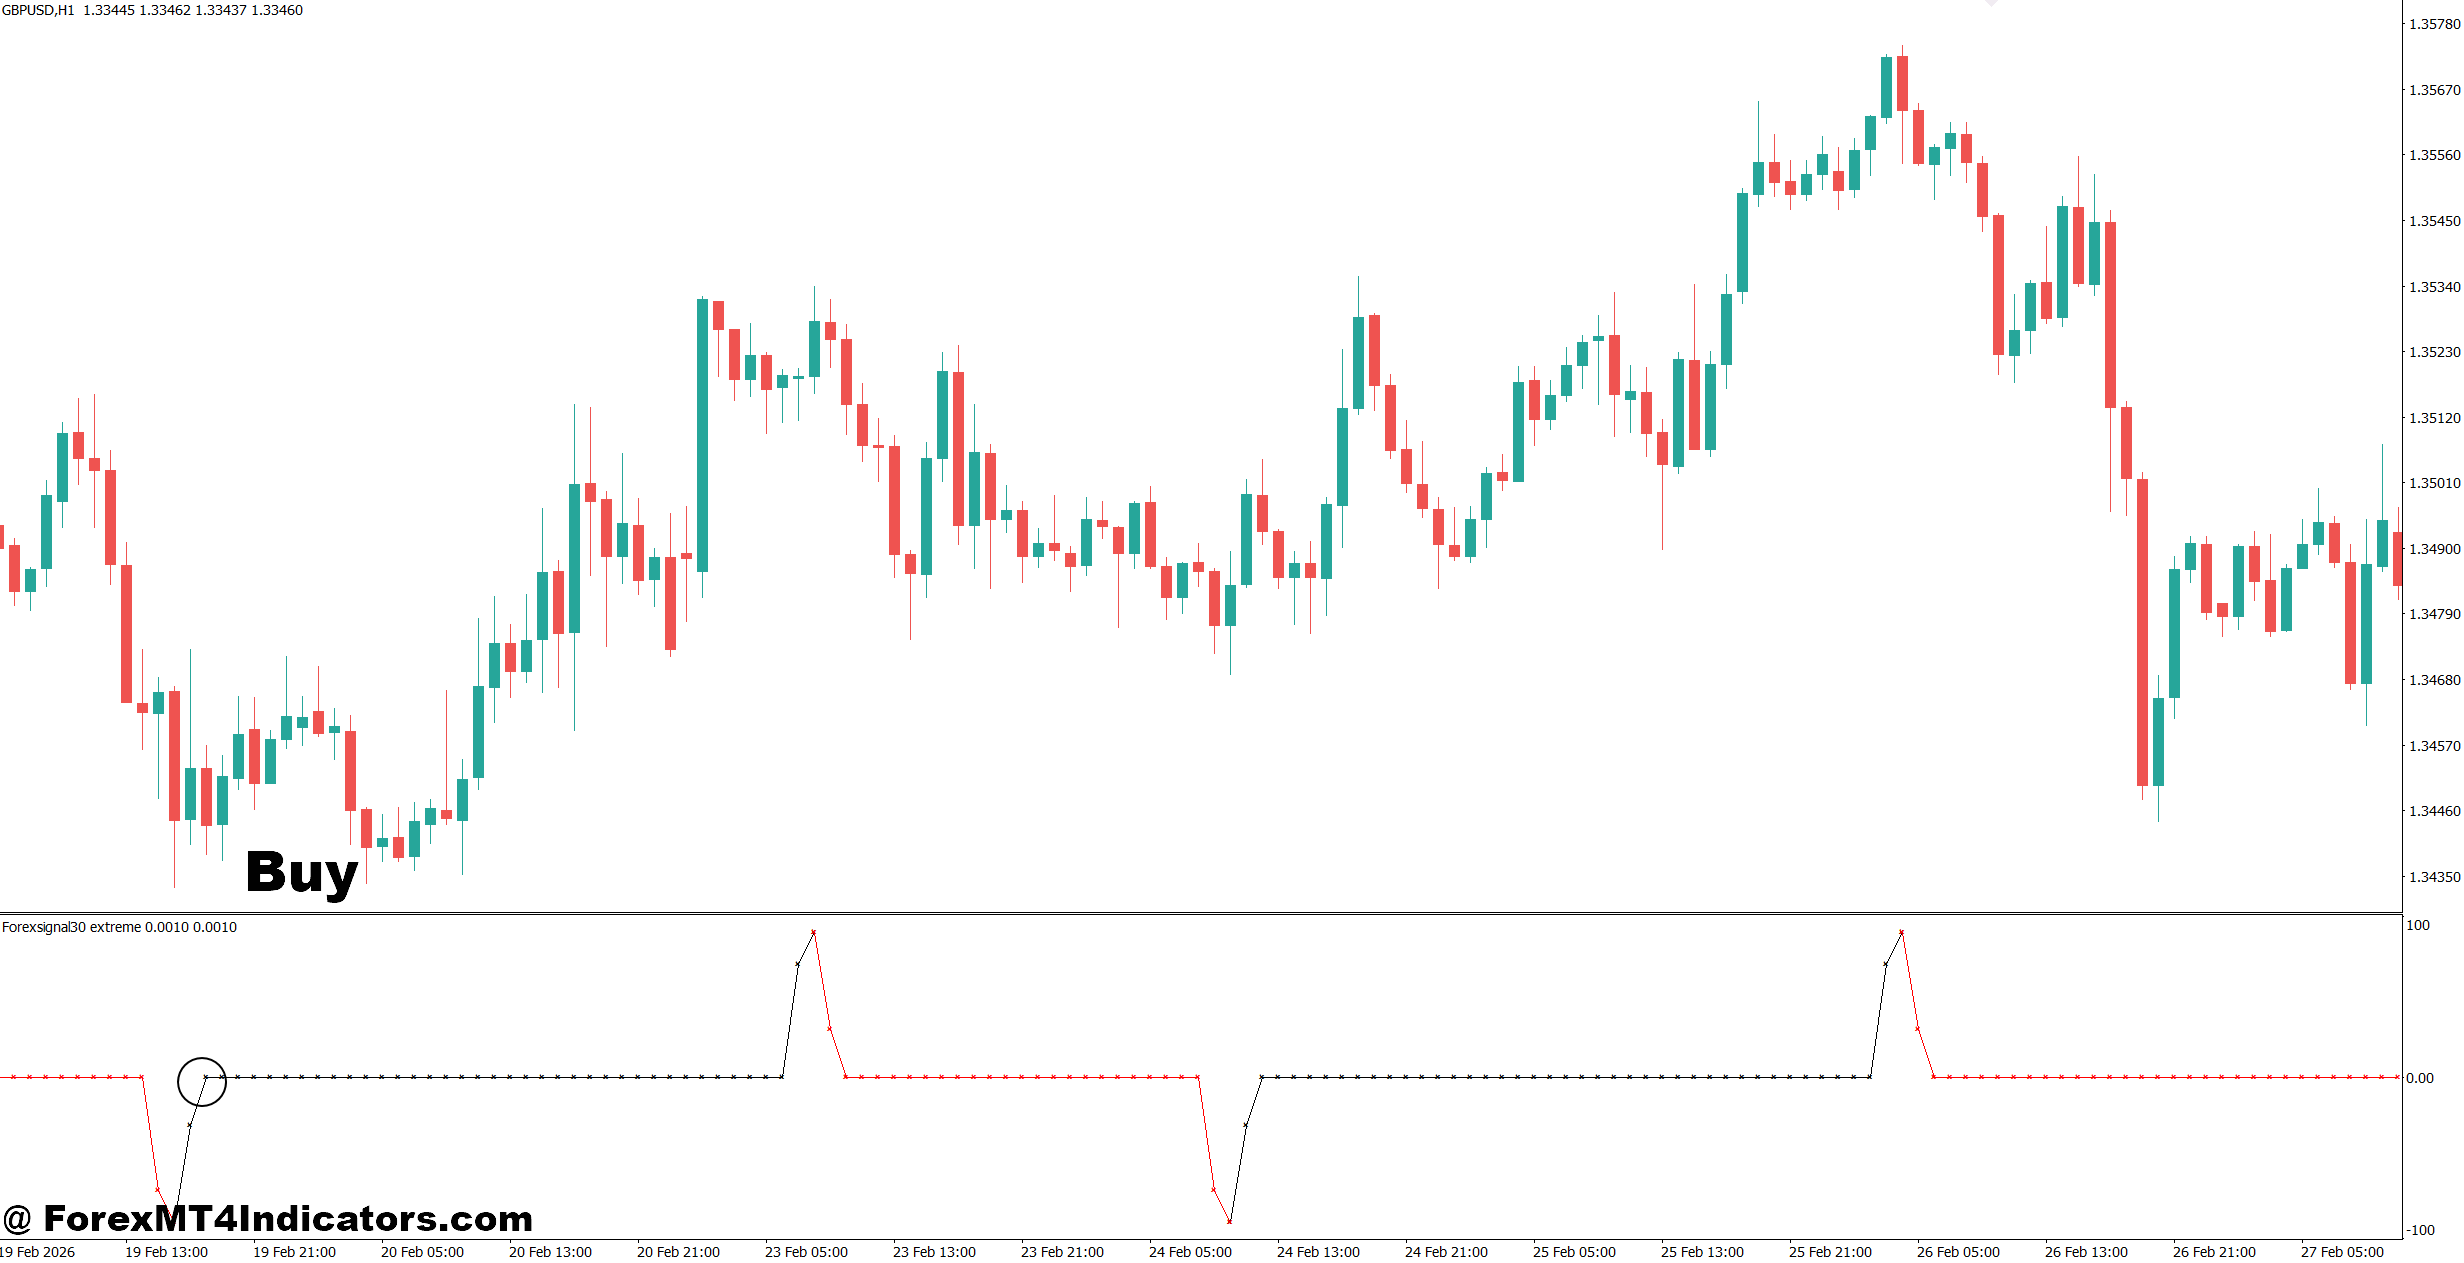
- Wait for a confirmed BUY signal – Enter only after the bullish arrow closes on the M15 or 1-hour chart; avoid acting on an unfinished candle.
- Check H1 support – Prefer BUY signals when EUR/USD rejects a support zone and moves at least 10–15 pips higher.
- Confirm the H4 trend – Take bullish signals when the 4-hour structure shows higher highs and higher lows.
- Use a 15–25 pip stop – Place the stop below the recent swing low instead of using a random fixed distance.
- Target 30–50 pips – Aim for at least a 1:1.5 or 1:2 risk-to-reward ratio on EUR/USD or GBP/USD setups.
- Risk only 0.5–1% – Keep account risk small, especially when testing the indicator on live markets.
- Avoid BUY signals in strong downtrends – Skip a bullish arrow when the daily chart shows aggressive bearish momentum and price remains below major resistance.
- Watch for retests – On GBP/USD H1, consider entering after a bullish signal breaks resistance and successfully retests it within 1–3 candles.
Sell Entry
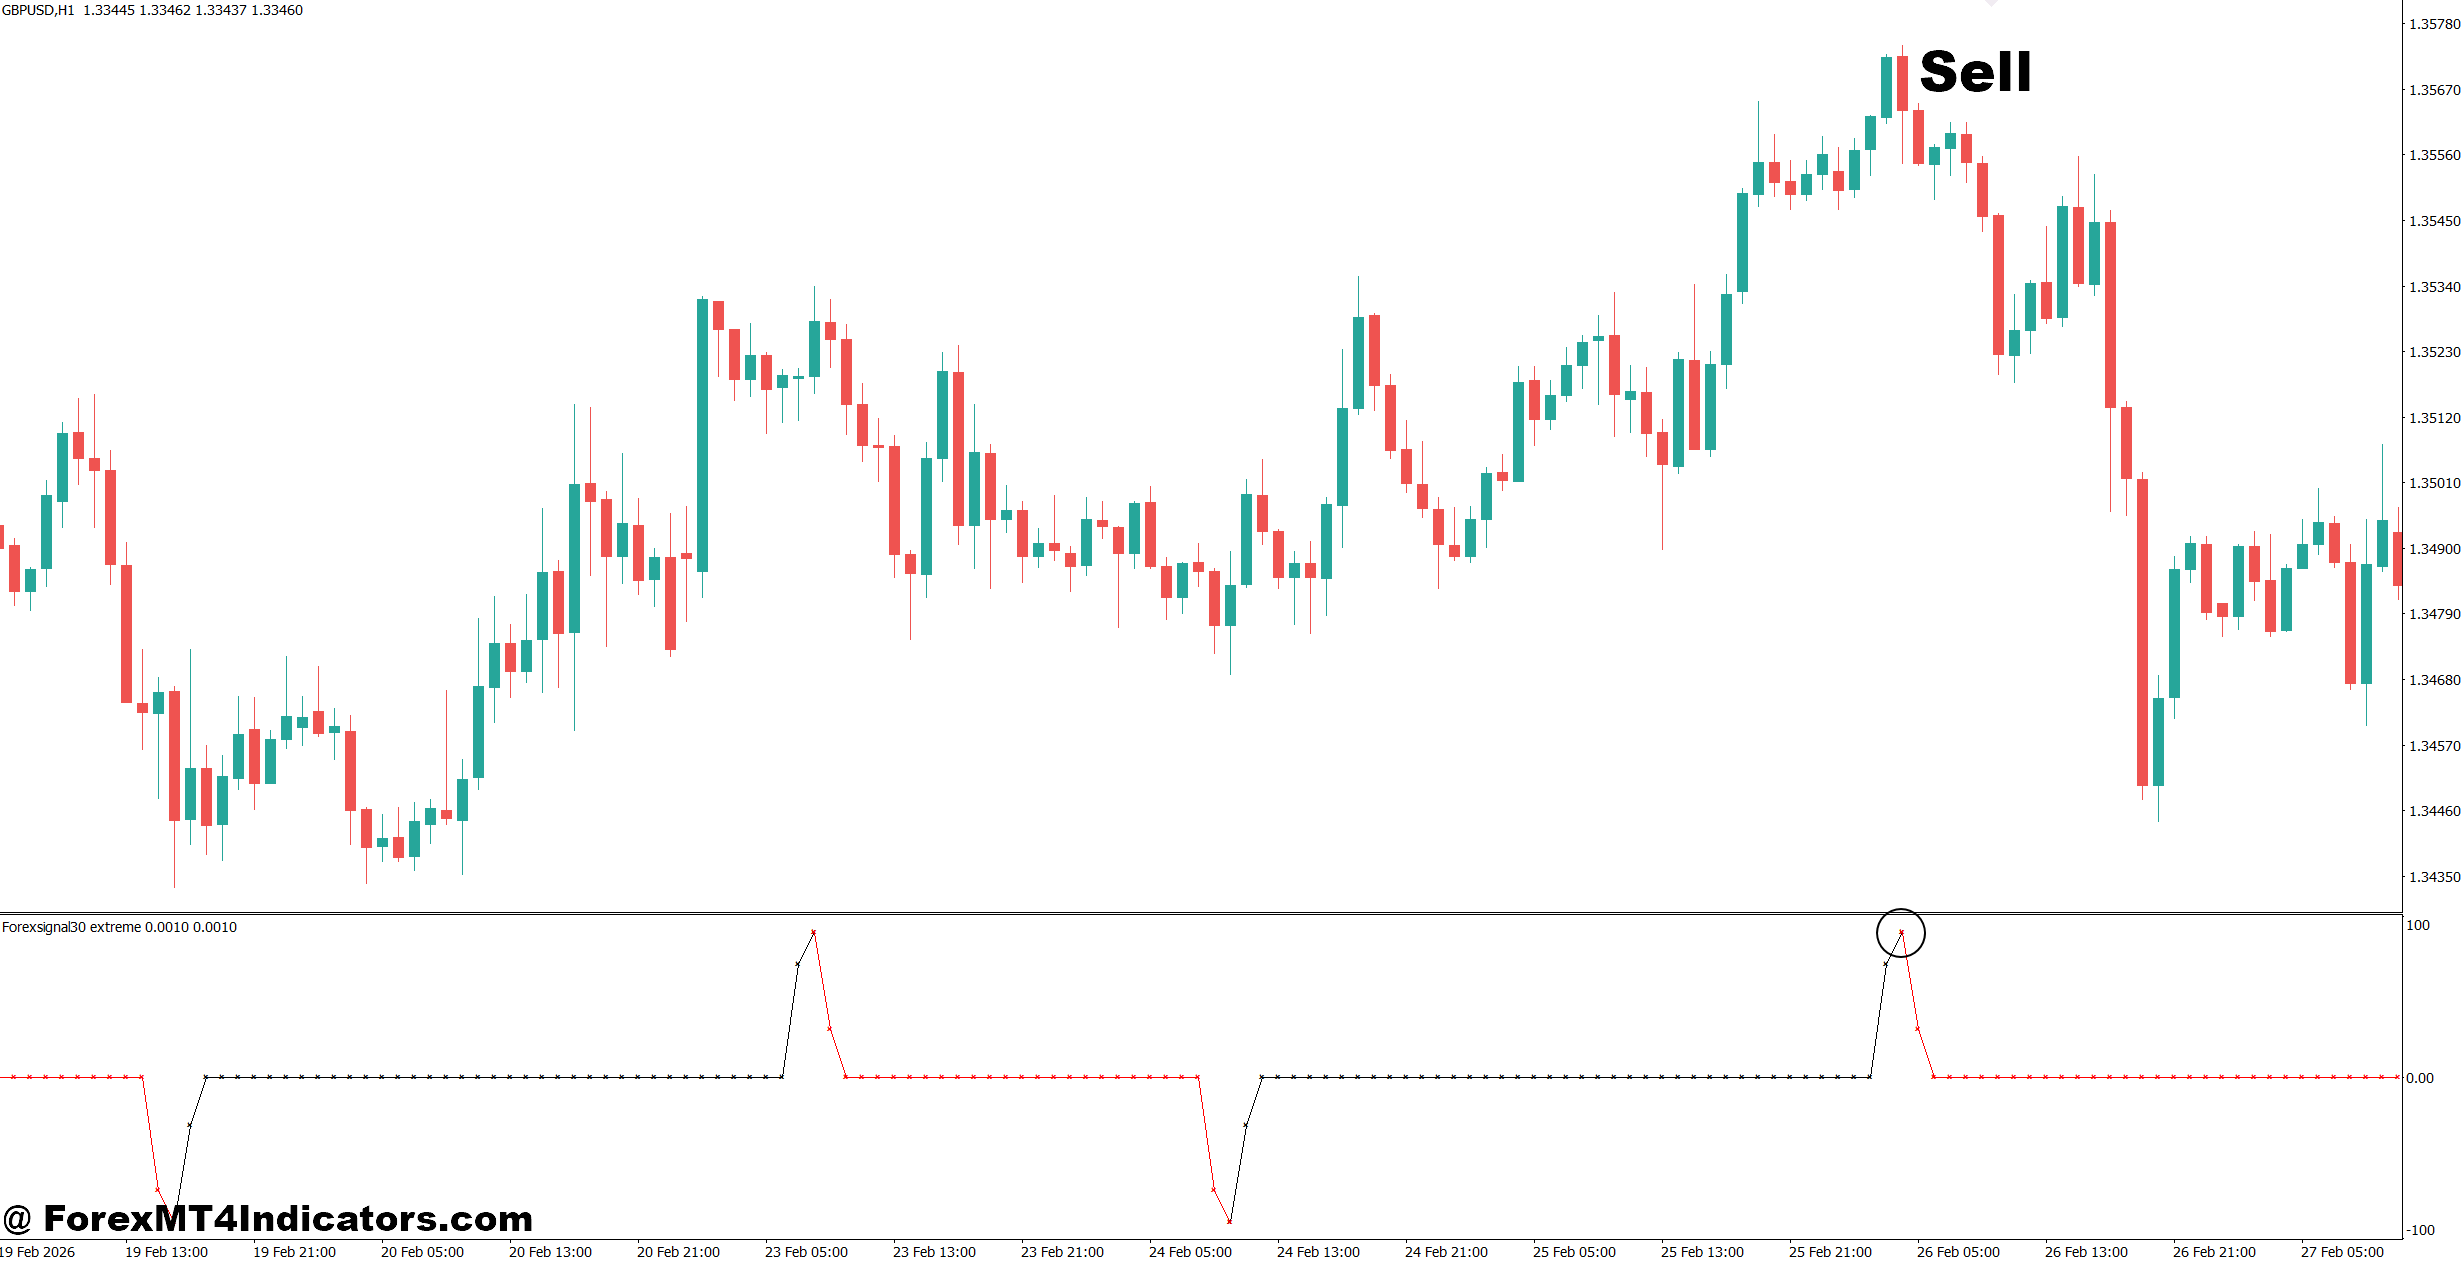
- Wait for a confirmed SELL signal – Enter after the bearish arrow closes on M15 or H1 rather than reacting during the candle.
- Check H1 resistance – Favor SELL signals when GBP/USD rejects resistance and falls at least 10–20 pips from the level.
- Confirm the H4 direction – Look for lower highs and lower lows before taking bearish signals against short-term market noise.
- Use a 15–30 pip stop – Place the stop above the recent swing high or resistance zone.
- Target 30–60 pips – Look for a minimum 1:1.5 risk-to-reward setup before entering EUR/USD or GBP/USD.
- Limit risk to 0.5–1% – Reduce position size if the required stop becomes wider than 30–40 pips.
- Skip SELL signals near strong support – Don’t short EUR/USD when a bearish arrow appears only 5–10 pips above major H1 or H4 support.
- Check the daily trend – Prefer SELL signals when the daily chart confirms bearish structure; avoid shorting directly into a strong daily reversal.
Final Thoughts on Forex Signal 30 Extreme Indicator MT4
The Forex Signal 30 Extreme Indicator MT4 can be useful as a visual entry tool, especially when traders combine its signals with market structure and confirmation from higher timeframes. Its biggest practical benefit is helping traders focus their attention on potential turning points instead of entering simply because price is moving quickly.
The key points are simple: use signals around meaningful support and resistance, wait for candle confirmation, keep risk near 0.5%–1% while testing, and avoid trading every signal during sideways conditions. Traders should also compare its results across EUR/USD, GBP/USD, and other pairs rather than assuming one setting works everywhere.
The strongest setup is rarely the indicator signal alone. It is the signal plus location, trend, confirmation, and sensible risk. Before putting money behind the strategy, traders should test whether those conditions actually produce an edge over a meaningful sample of trades.
Level up your trading
Learn to read the chart — not just the indicator
eBook · Instant PDF
Video Course · 12 modules
Recommended MT4/MT5 Brokers
- ✓ *FREE *$50 to start (withdrawable)
- ✓ Deposit bonus up to $5,000
- ✓ Negative balance protection
Trading forex and CFDs carries a significant risk of loss and is not suitable for everyone. Broker links are affiliate links — we may earn a commission at no cost to you.
Free MT4 Indicator Download

Enter Your Email Address below, download link will be sent to you.