

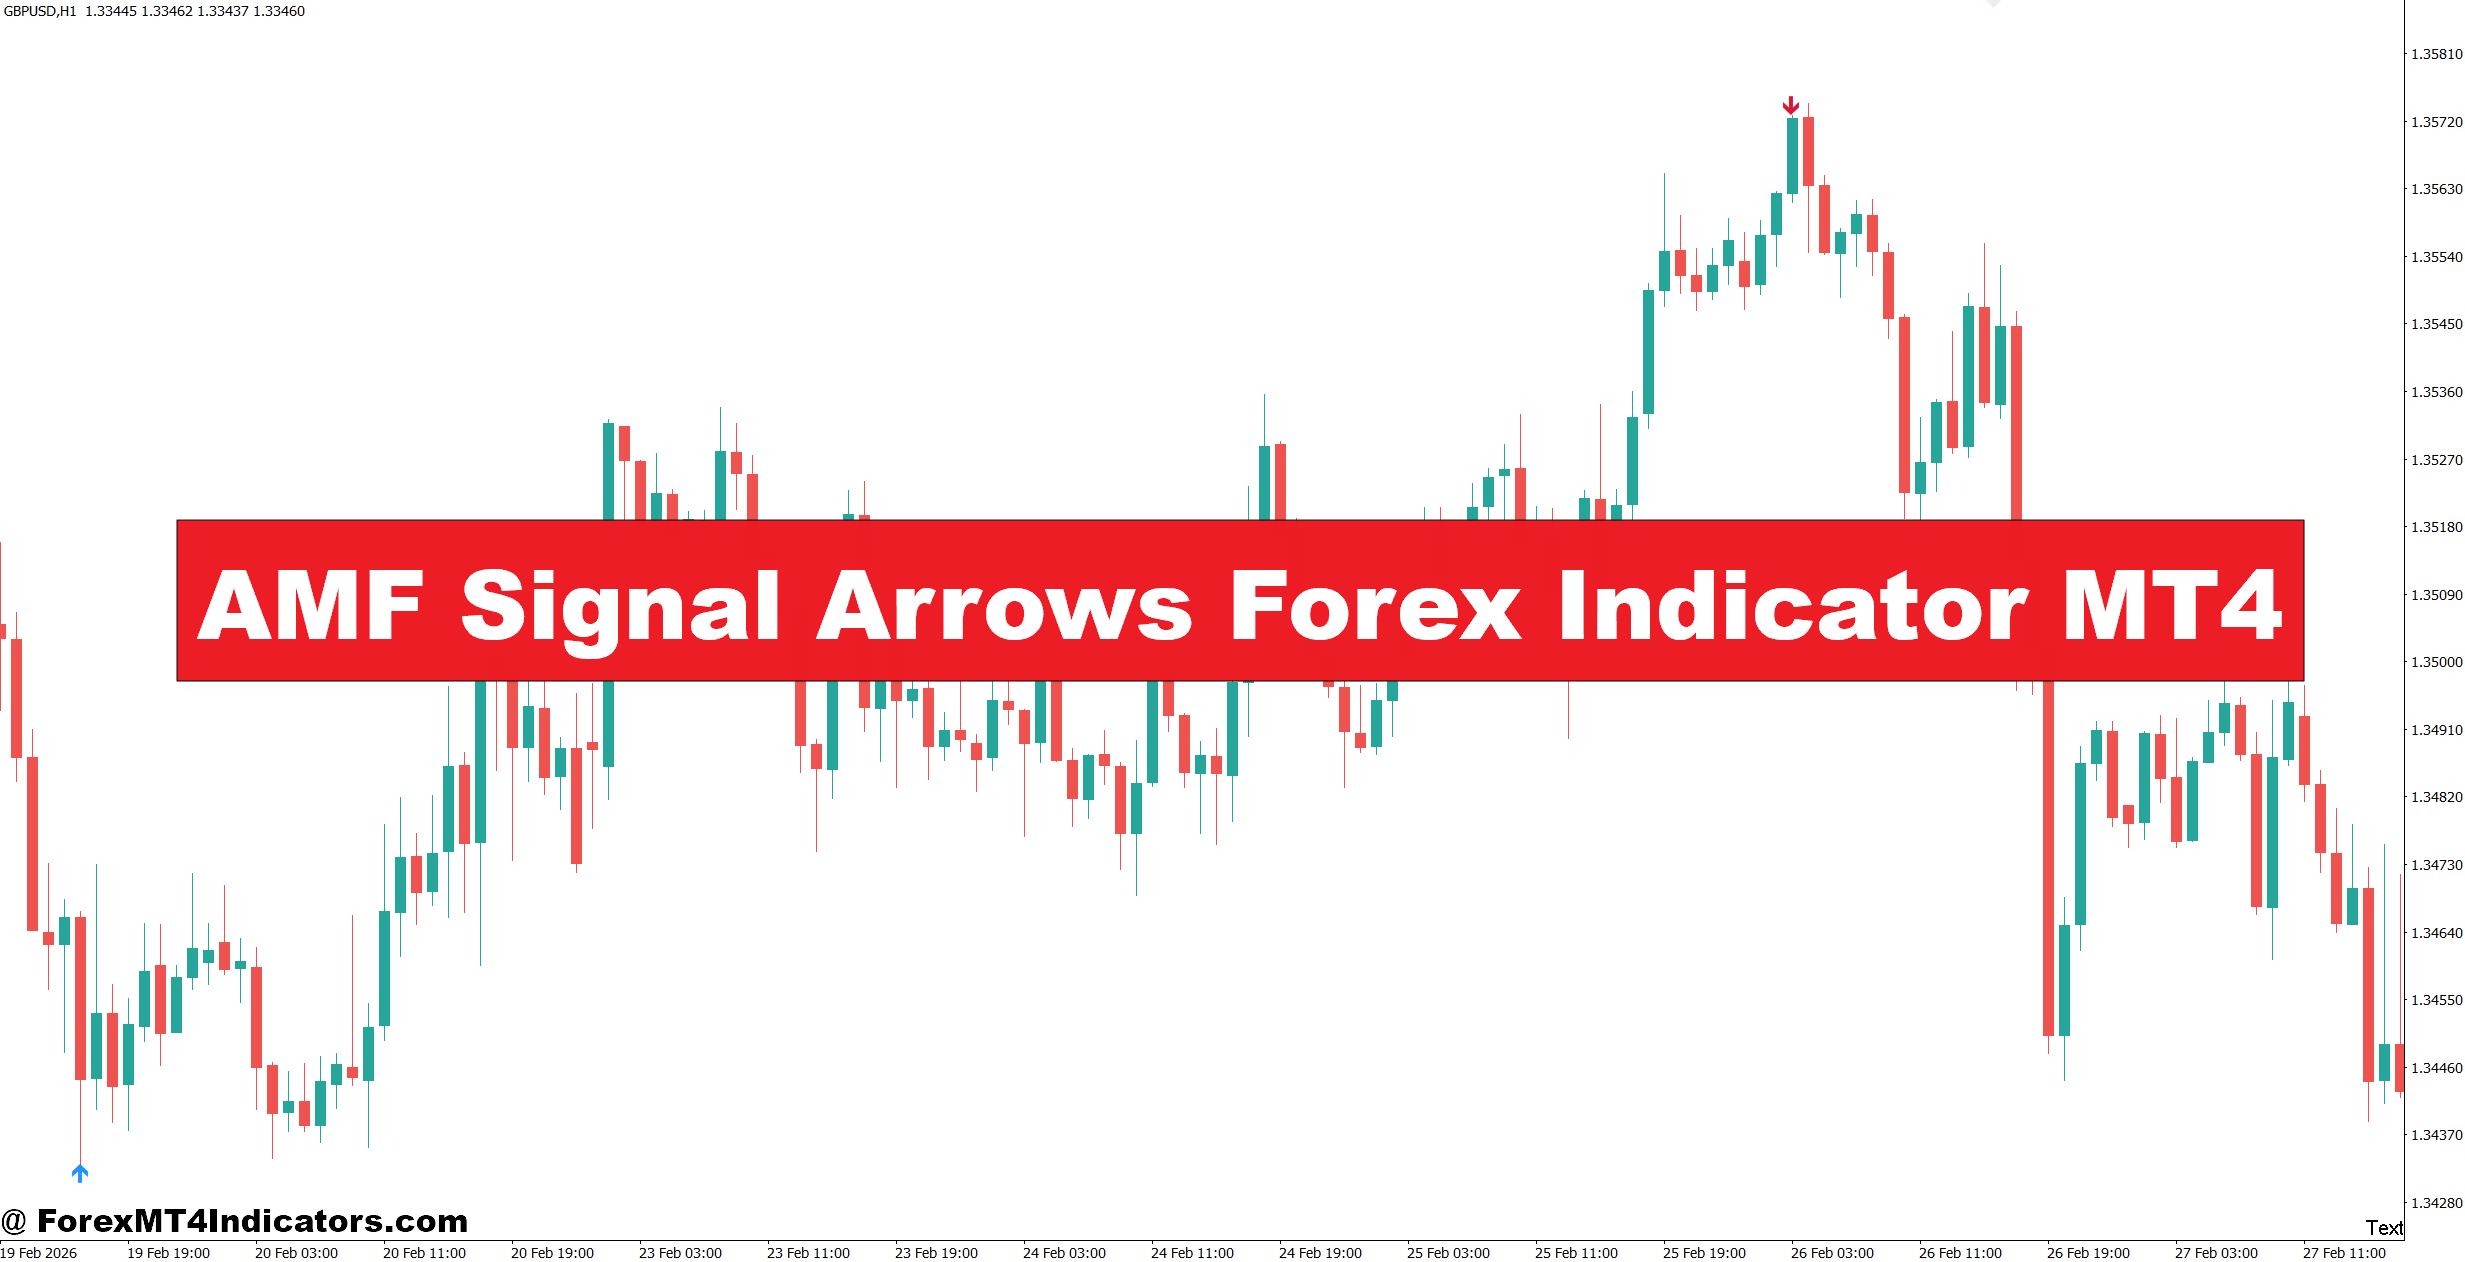
The AMF Signal Arrows Forex Indicator MT4 is designed to give traders visual entry cues directly on the MetaTrader 4 chart. Its arrows can help traders spot potential bullish and bearish shifts without relying on one price candle alone. But an arrow should be treated as a setup alert, not a command to trade.
The useful part comes from combining those signals with trend direction, support and resistance, and sensible risk control. Here’s how traders can approach it in real market conditions.
What Is the AMF Signal Arrows Forex Indicator MT4?
The AMF Signal Arrows Forex Indicator MT4 is a chart-based technical indicator that places directional arrows when its internal conditions suggest a possible change or continuation in price direction. A buy-style arrow generally points traders toward a potential bullish setup, while a sell-style arrow highlights possible bearish pressure.
The exact calculation can vary between AMF versions and custom MT4 builds, so traders should check the specific indicator’s inputs rather than assume it uses one universal formula. In practice, signal-arrow tools commonly evaluate recent price movement, trend behavior, momentum, or filtered price conditions before displaying a signal.
That distinction matters. An arrow appearing after a large bullish candle does not necessarily mean price has just become a good buying opportunity. The trader still needs to ask where the signal appeared and whether the broader market supports it.
For example, suppose EUR/USD is trading on the 1-hour chart. Price has moved from 1.0840 to 1.0910 and then pulls back toward 1.0880. If a bullish AMF arrow appears near 1.0880 while that area also matches previous support, the signal has more context than an isolated arrow in the middle of a range.
How the Indicator Can Be Used in Real Trading
The most practical approach is to use the arrows as an entry filter rather than a complete trading system.
Consider GBP/USD on the 1-hour chart. Assume the pair has formed higher highs and higher lows for several sessions. A trader marks support around 1.2740. Price drops toward that zone, holds above it, and an upward arrow appears around 1.2755.
Instead of buying immediately, the trader can wait for the candle to close. If the next candle trades above the signal candle’s high, the setup has stronger confirmation. A stop could sit 15–25 pips below the recent swing low, depending on current volatility.
The opposite setup works for short trades. Imagine USD/JPY testing resistance near 149.80 on the 1-hour chart. Price rejects that level, forms a bearish candle, and the indicator prints a downward arrow. A short entry becomes more interesting if the market also starts forming lower highs.
This type of confirmation helps reduce some obvious fake-outs. But it won’t remove them. During London-New York overlap, a strong news release can push price 30 or 40 pips through a technical level before reversing.
A Useful Multi-Timeframe Method
Some traders use the higher timeframe to establish direction and the lower timeframe for timing.
For instance:
- Daily chart: bullish structure
- 4-hour chart: price above major support
- 1-hour chart: bullish AMF arrow
- 15-minute chart: bullish break of the recent minor high
That sequence gives the arrow a stronger technical setting.
A trader who sees a buy arrow against a clear daily downtrend should be more cautious. It may represent a short-lived retracement rather than a genuine trend reversal.
AMF Signal Arrows Settings and Timeframe Selection
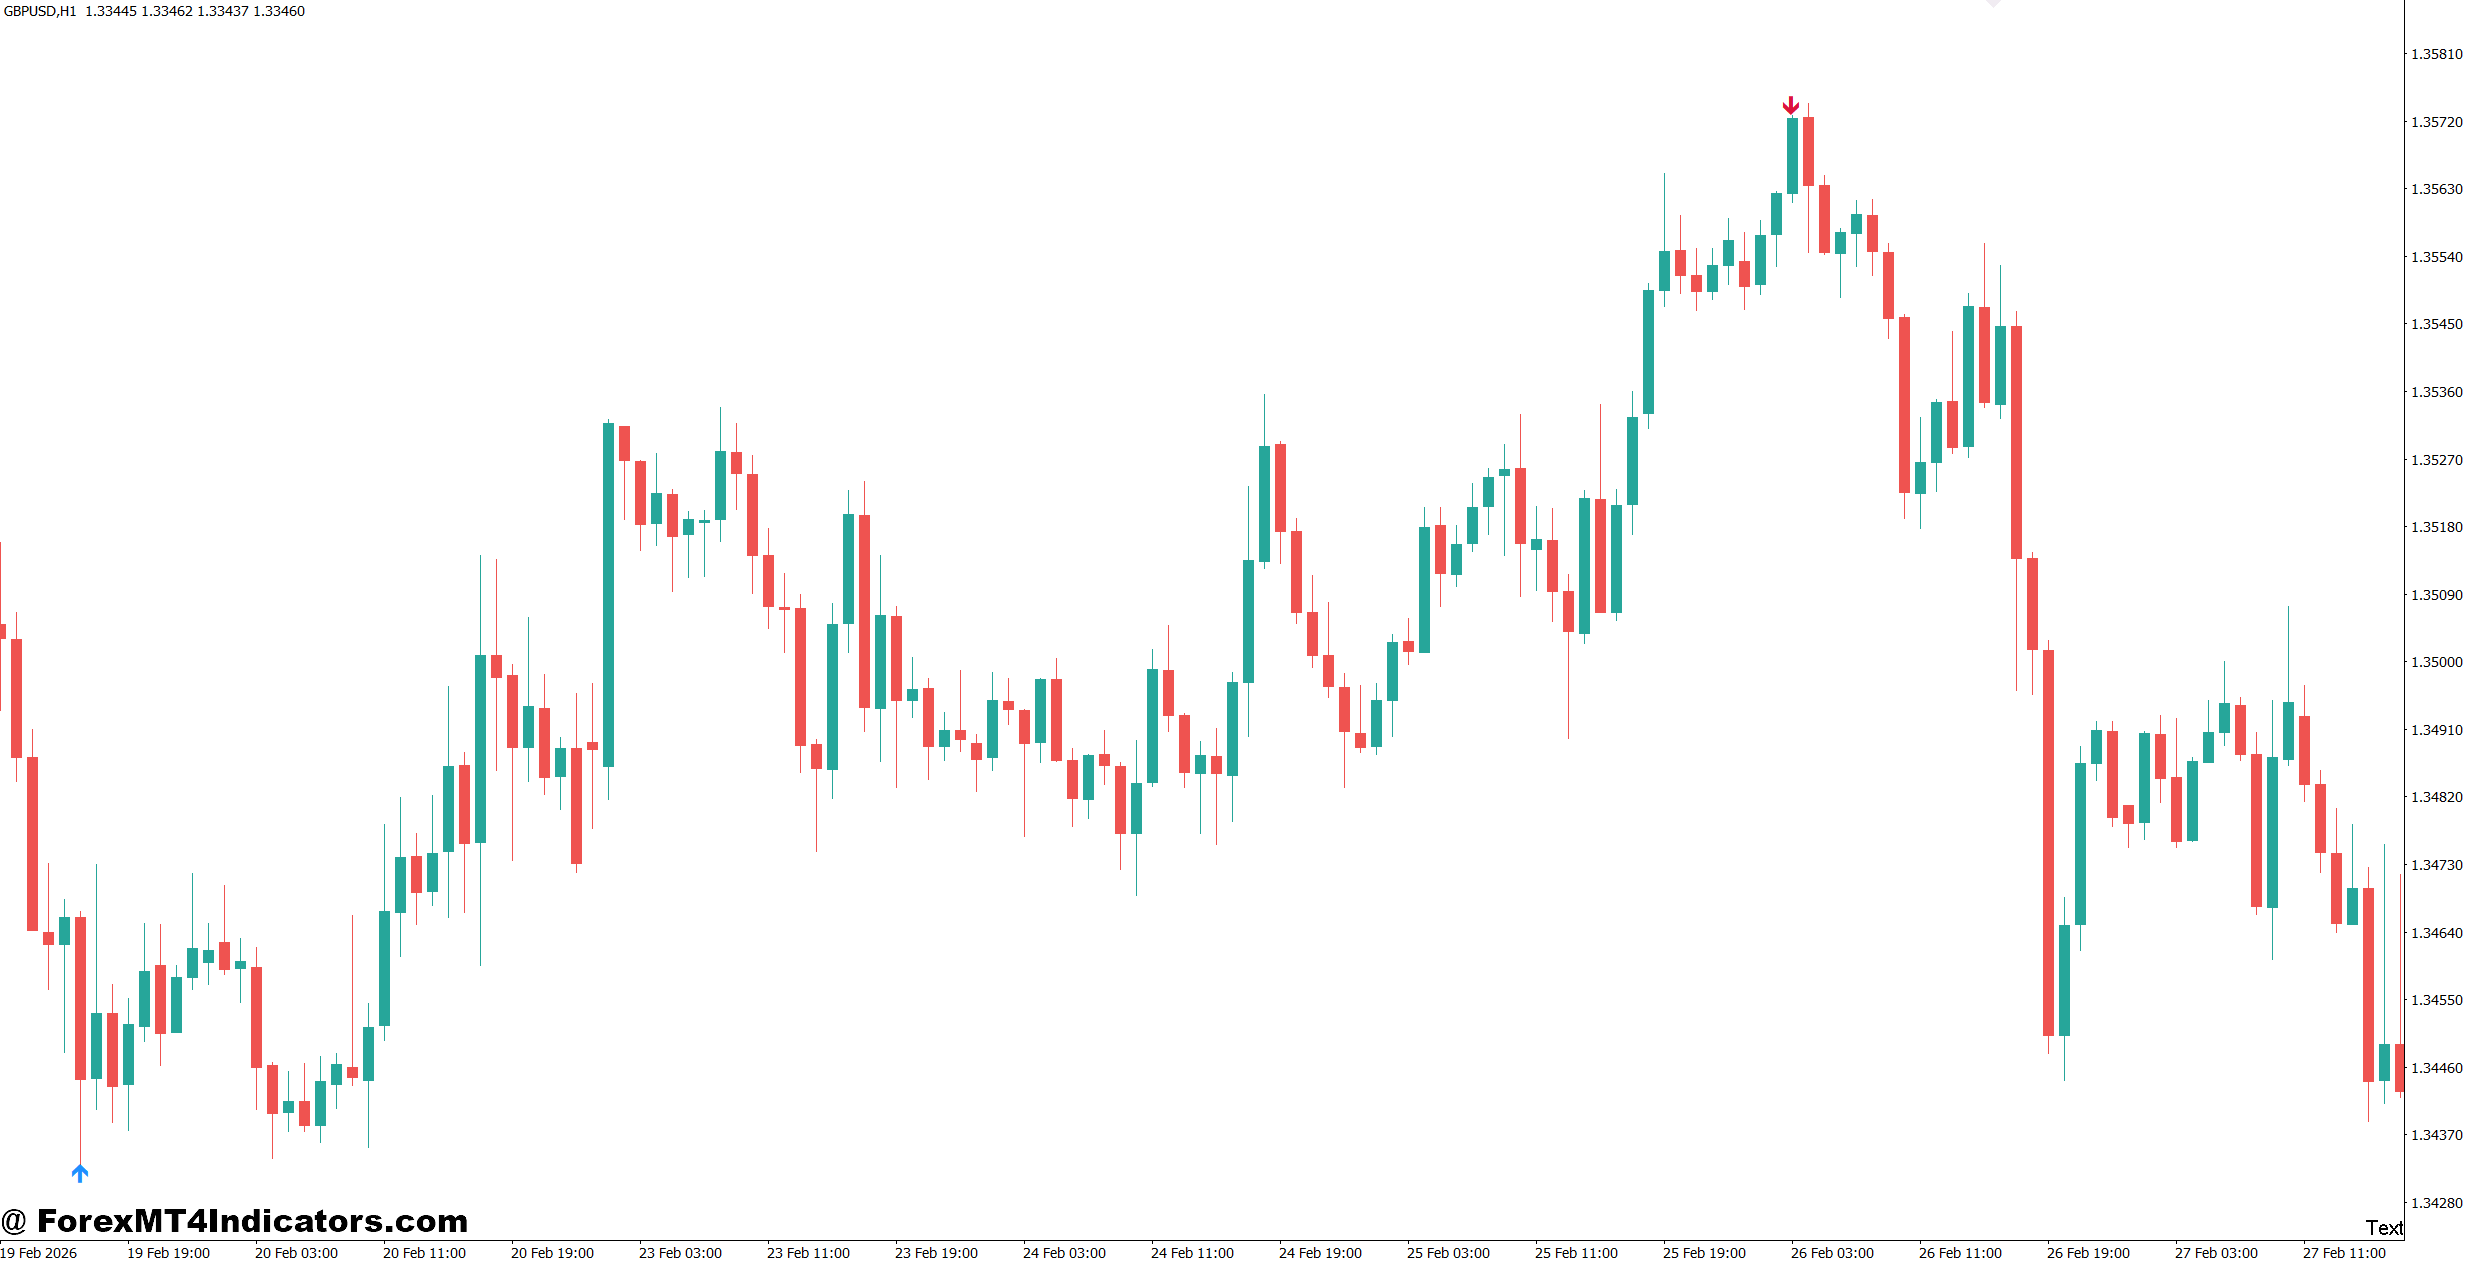
Settings should match the pair and timeframe rather than being copied blindly from another trader.
On major pairs such as EUR/USD and USD/JPY, traders can test the indicator on the 15-minute, 1-hour, and 4-hour charts. The 15-minute chart produces more signals but also exposes the trader to more market noise. The 4-hour chart gives fewer signals, yet each setup usually has more room to develop.
A simple testing framework can help:
15-minute chart: Use for short-term setups, but require stronger confirmation and tighter trade management.
1-hour chart: A practical middle ground for many swing and intraday traders. A 20–35 pip stop may be reasonable on some major-pair setups, depending on the recent swing and volatility.
4-hour chart: Better suited to larger moves. Stops may need to be 40–80 pips or more because normal price fluctuations are wider.
The numbers above are examples, not fixed rules. Gold, GBP pairs, and exotic currencies can move much more aggressively.
Traders should also test whether changing signal sensitivity creates too many arrows or removes useful ones. A setting that looks excellent on EUR/USD during one month may perform poorly on GBP/JPY during a volatile period.
Advantages, Limitations, and Comparison With Other Indicators
One advantage of an arrow-based tool is speed. Traders can scan a chart and immediately identify areas that deserve attention. It can also make chart review easier because potential directional changes are visually marked.
Another benefit is that it can work alongside standard technical analysis. Support and resistance, moving averages, RSI, MACD, and market structure can all provide additional confirmation.
But there is a major limitation: a signal arrow does not predict the future with certainty.
Whipsaws are common when price moves sideways. During a narrow 40-pip EUR/USD range, the indicator might generate several bullish and bearish signals as price repeatedly crosses the same area. Taking every arrow can quickly produce a series of losses.
Compared with a moving average, the AMF indicator may provide more direct entry cues, while a moving average mainly describes trend direction. Compared with RSI, it may be easier to use visually, but RSI can provide useful momentum and overbought/oversold information that an arrow alone does not explain.
A trader testing it against MACD might find that the arrow appears earlier, while MACD confirmation arrives later. That creates a trade-off between getting an earlier entry and waiting for stronger confirmation.
When testing this type of indicator on volatile NFP sessions, experienced traders usually avoid treating the first arrow as enough evidence. Spread expansion, slippage, and sudden liquidity changes can make an otherwise clean setup much harder to execute.
A Practical Trading Routine
A disciplined routine can make the indicator more useful.
First, identify the higher-timeframe trend. Next, mark nearby support and resistance. Then wait for an AMF arrow in an area that makes technical sense.
For a bullish setup, a trader might risk 0.5% of the account on the trade, place the stop below a meaningful swing low, and target at least 1.5 times the initial risk. If the stop is 20 pips, a 30-pip target provides a 1:1.5 risk-to-reward ratio.
For a bearish setup, the same principle applies around resistance or a confirmed lower high.
The trader should also record every signal. After 50–100 trades, the results can reveal which pairs, sessions, and timeframes actually suit the indicator. That data is far more useful than judging it from five winning trades.
Trading forex carries substantial risk. No indicator guarantees profits. Traders should test the AMF Signal Arrows Forex Indicator MT4 on a demo account before committing real money and should never risk capital they cannot afford to lose.
How to Trade with AMF Signal Arrows Forex Indicator MT4
Buy Entry
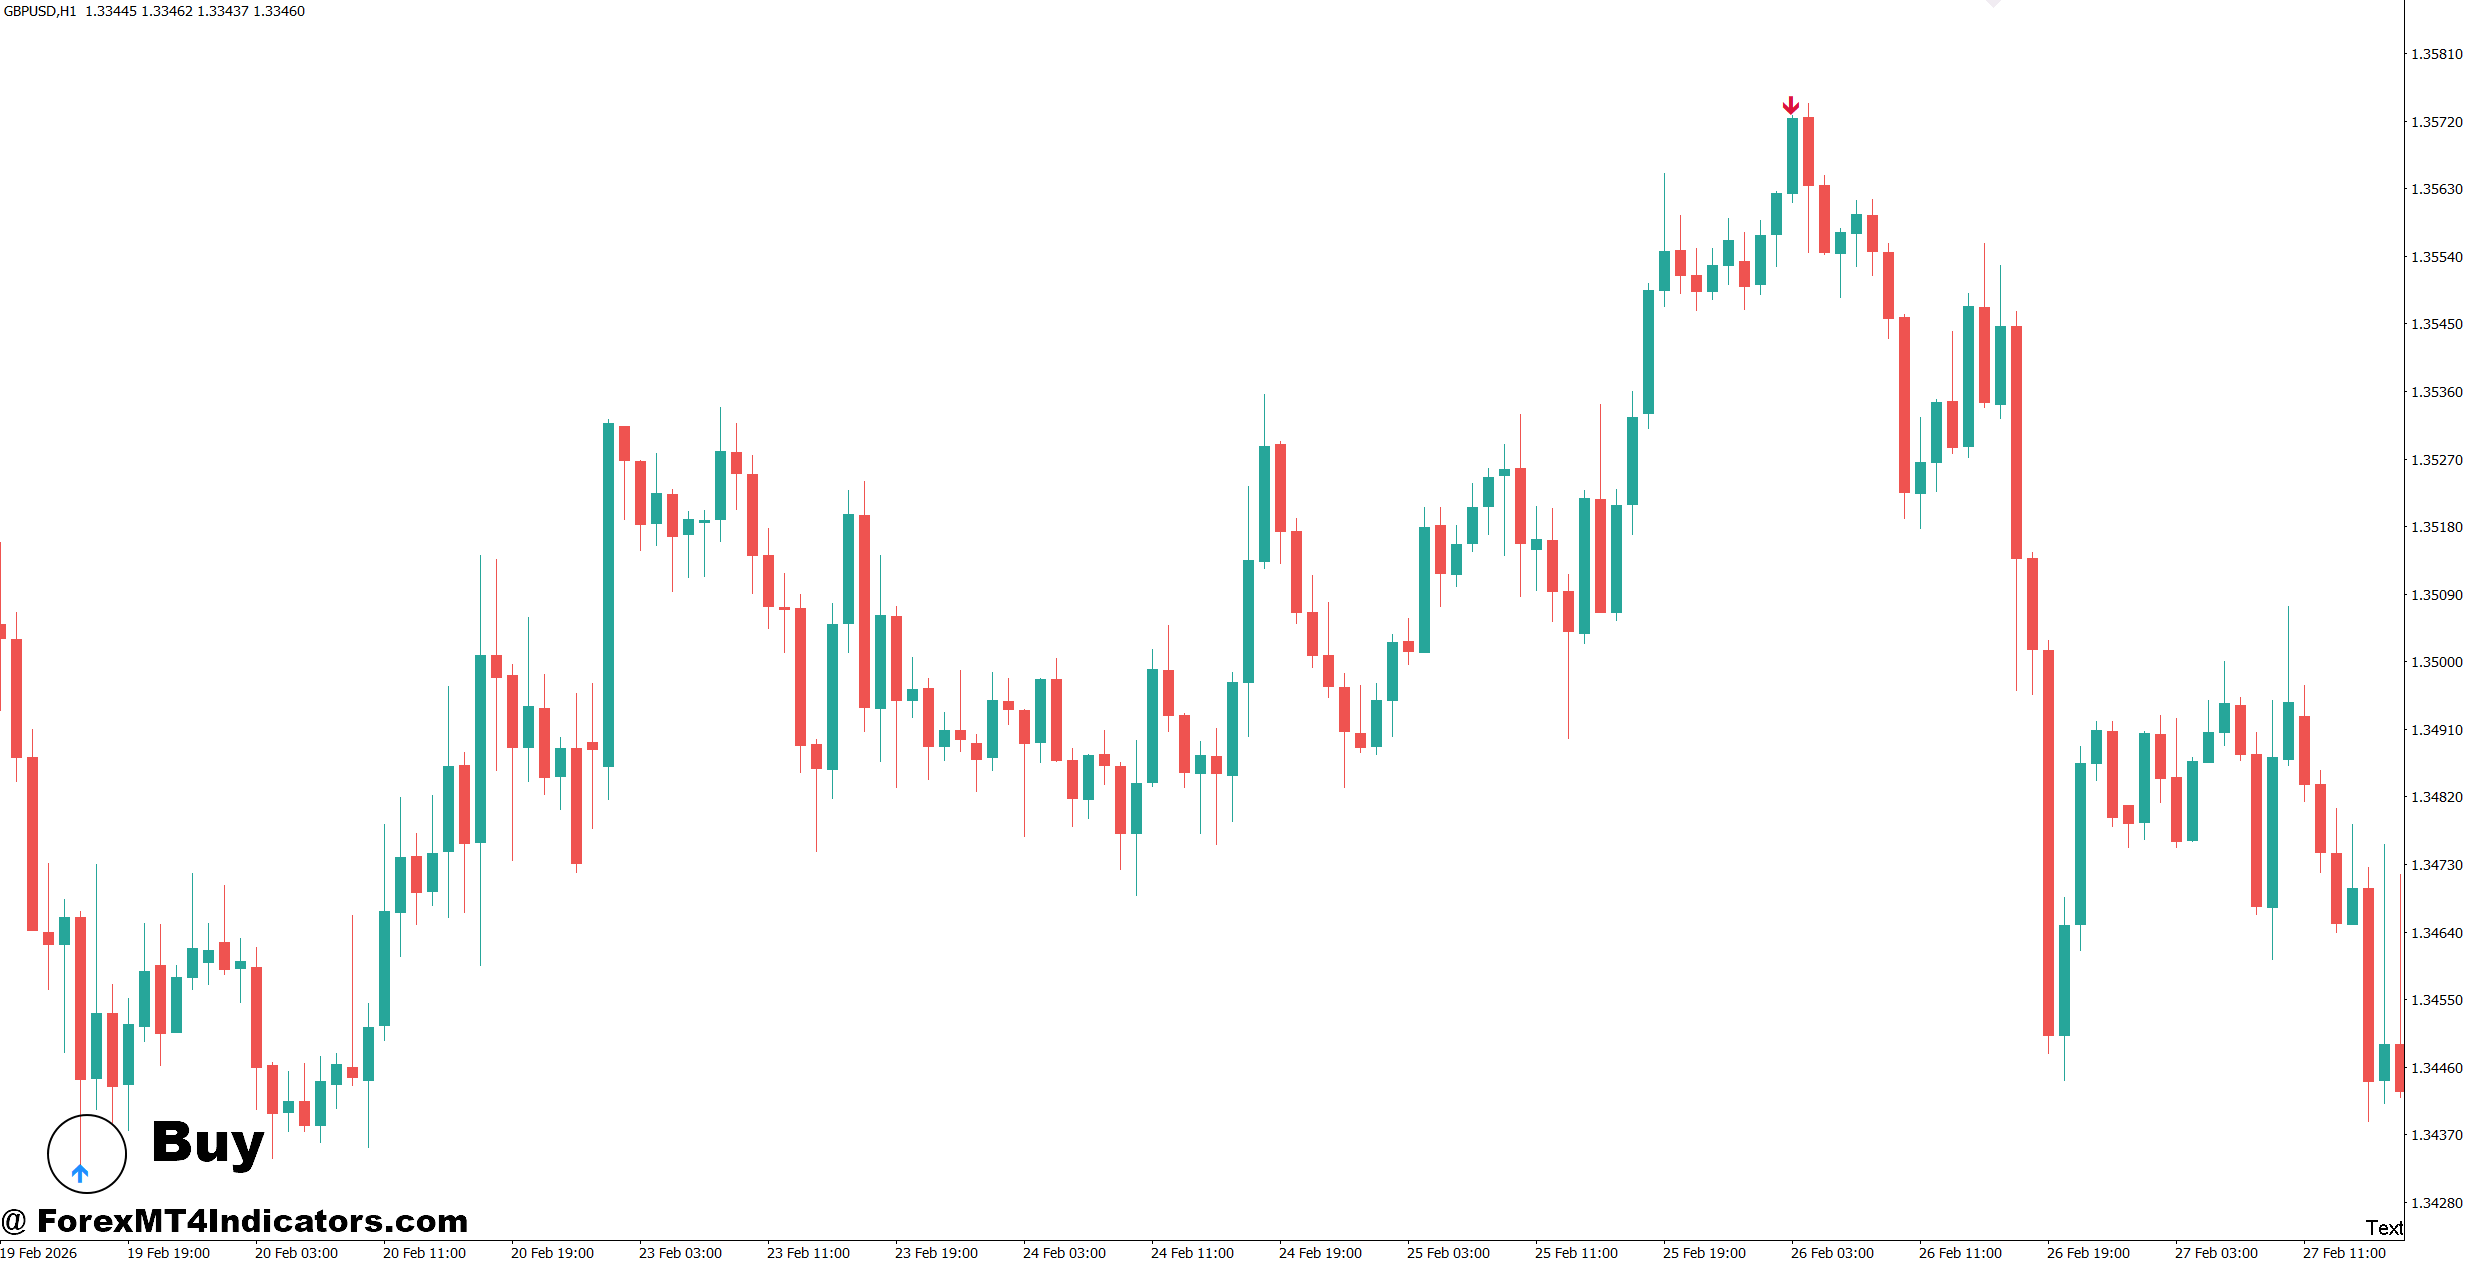
- Wait for a bullish arrow on H1 – Consider a BUY when the AMF Signal Arrows indicator prints an upward arrow and the H1 candle closes above the signal level.
- Confirm support nearby – Look for BUY arrows around support zones, such as EUR/USD holding 1.0850, rather than buying after a 30-pip spike.
- Check the H4 trend – Prefer BUY signals when the 4-hour chart shows higher highs and higher lows, confirming bullish market structure.
- Use daily direction – A bullish Daily trend adds confirmation; avoid aggressive BUY trades when the Daily chart is clearly bearish.
- Enter after a small pullback – If GBP/USD prints a BUY arrow, wait for a 5–15 pip retracement before entering when possible.
- Keep risk below 1% – Risk around 0.5%–1% of account equity per trade and place the stop below the recent swing low.
- Target at least 1:1.5 – With a 20-pip stop loss, aim for roughly 30 pips or more when market structure allows.
- Avoid BUY signals during major news – Skip fresh arrows 5–15 minutes before high-impact events such as NFP or major central-bank decisions.
Sell Entry
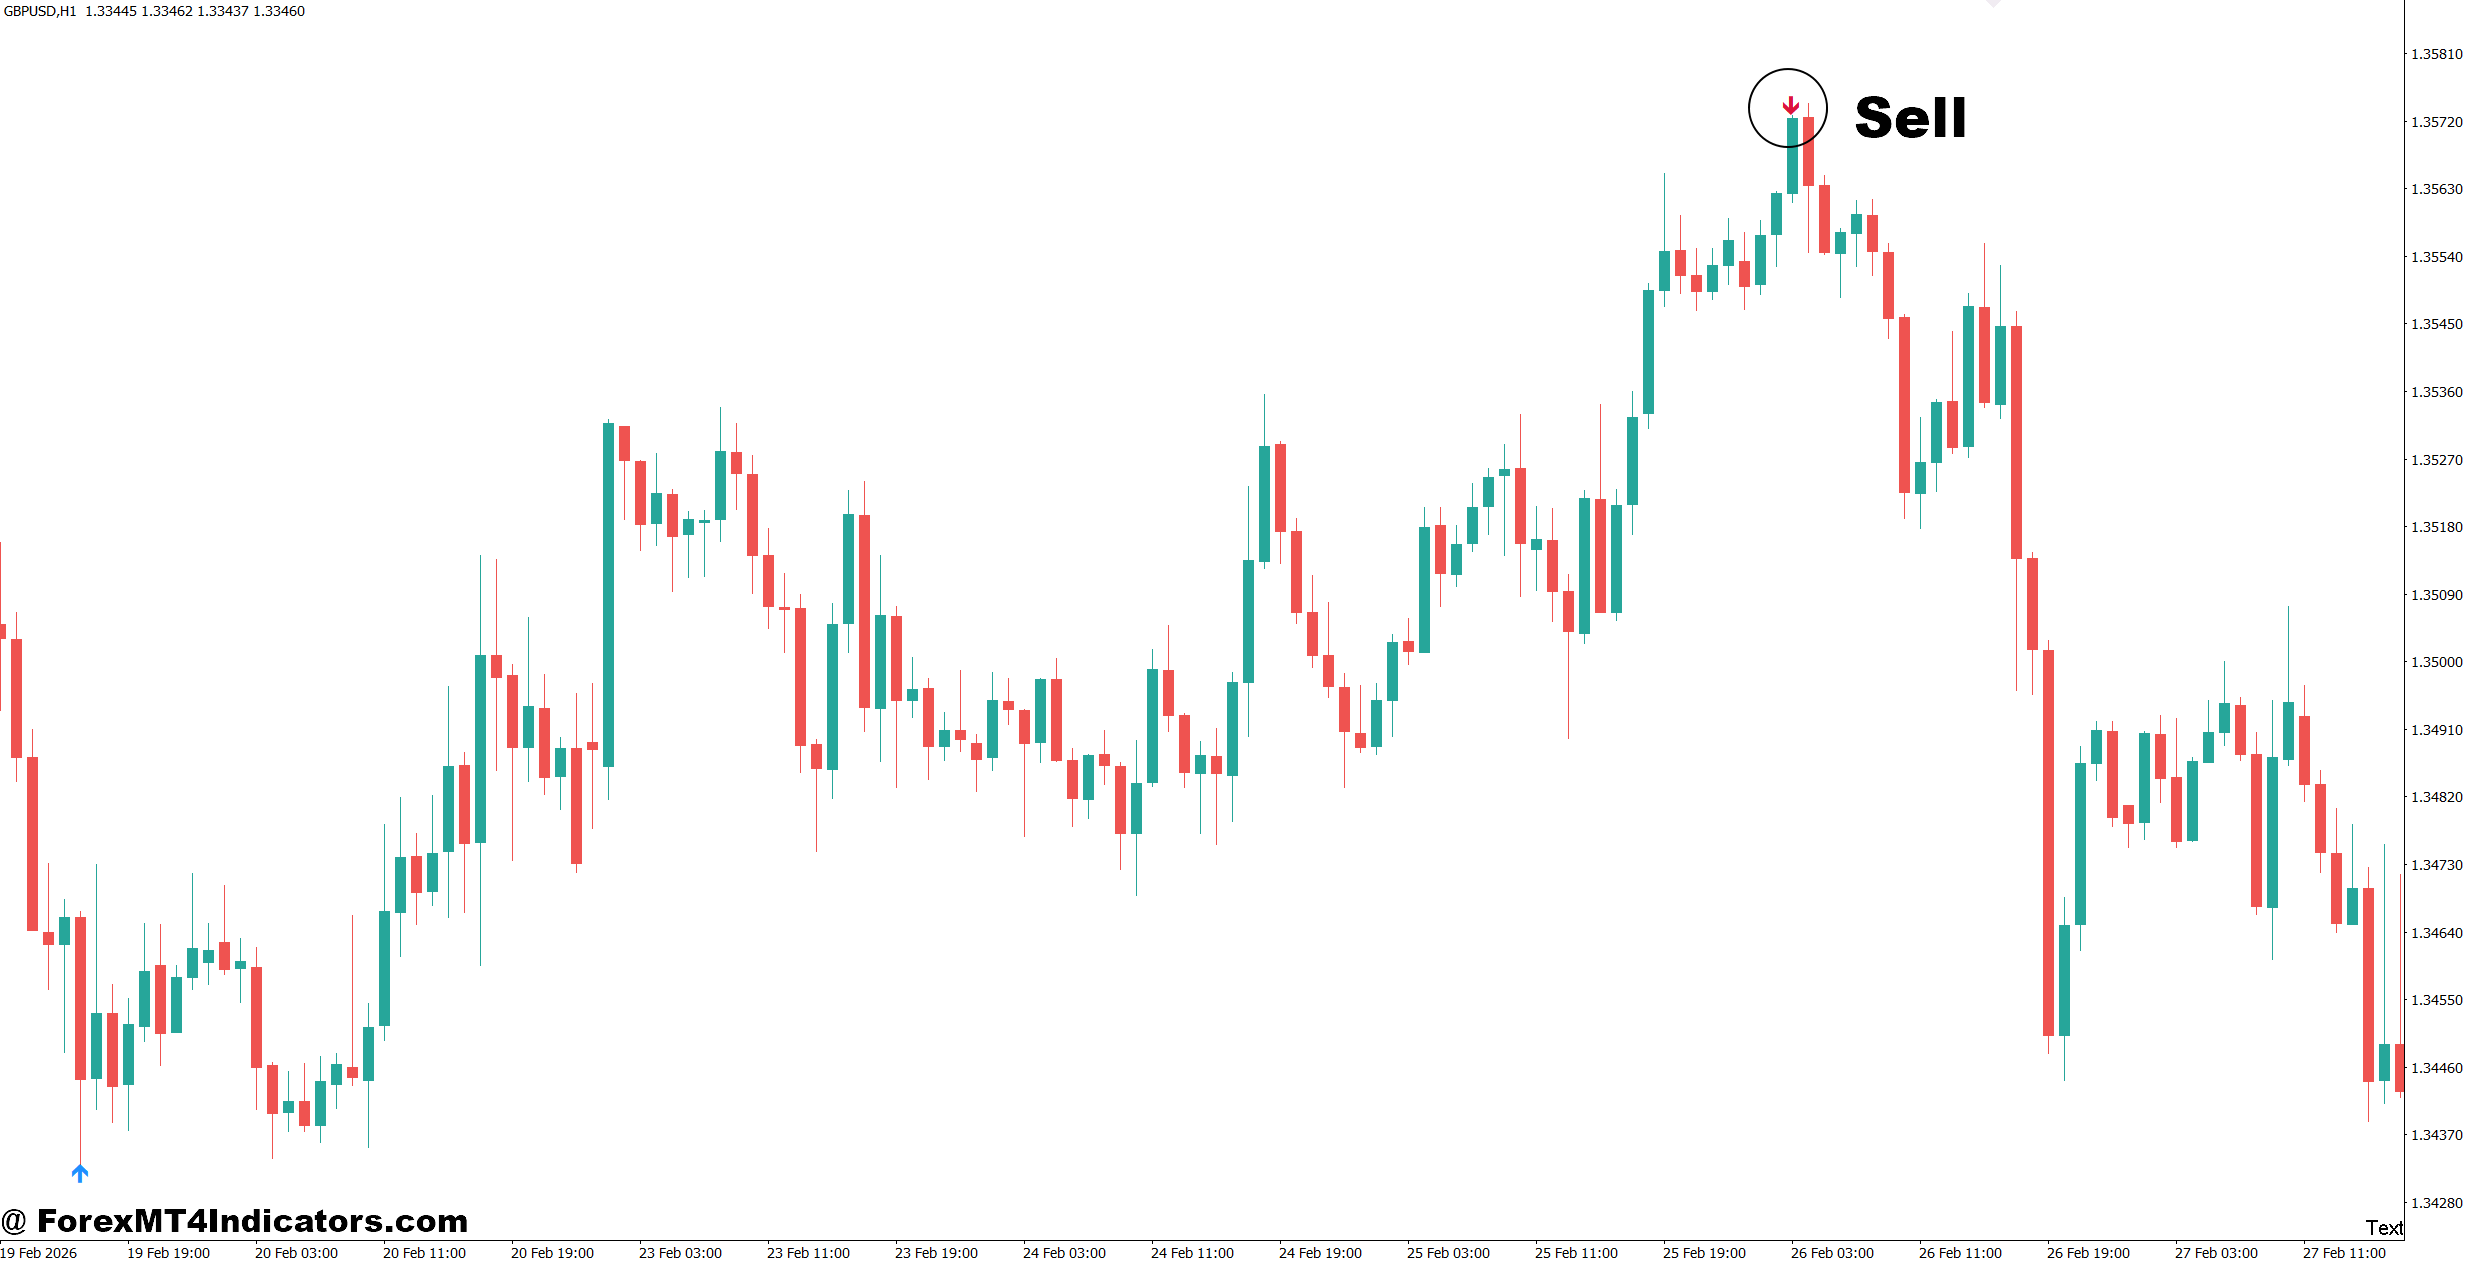
- Wait for a bearish arrow on H1 – Consider a SELL after a downward arrow appears and the H1 candle closes below the signal area.
- Confirm resistance rejection – Prefer SELL signals near resistance, such as EUR/USD rejecting 1.0950 after a failed breakout.
- Check the H4 structure – Favor SELL setups when the 4-hour chart forms lower highs and lower lows.
- Follow the Daily trend – Daily bearish pressure strengthens an H1 SELL signal; avoid shorting directly into strong daily support.
- Watch GBP/USD pullbacks – After a bearish arrow, a 5–15 pip retracement toward resistance can offer a cleaner entry than chasing the initial drop.
- Risk only 0.5%–1% – Place the stop above a recent swing high and keep the position size small enough to control account exposure.
- Set a realistic profit target – A 25-pip stop can require a 38–40 pip target for approximately a 1:1.5 risk-to-reward ratio.
- Skip signals in sideways markets – Avoid SELL arrows when EUR/USD is trapped in a narrow 20–30 pip range and repeatedly produces false breakouts.
Final Thoughts
The AMF Signal Arrows Forex Indicator MT4 can be useful for traders who want clear visual signals and a faster way to scan potential setups. Its strongest role is as part of a broader trading process, not as a standalone buy-and-sell machine.
The key points are simple: use higher-timeframe structure for direction, look for arrows near meaningful price levels, confirm the candle or market structure before entering, and keep risk controlled.
A bullish arrow in the middle of random price action is weak. The same arrow near established support with a clear trend can be much more interesting.
The best next step is to test the indicator across at least 50–100 historical setups and record the pair, timeframe, session, stop size, target, and result. That exercise will show whether its signals actually fit the trader’s strategy rather than relying on appearances alone.
Level up your trading
Learn to read the chart — not just the indicator
eBook · Instant PDF
Video Course · 12 modules
Recommended MT4/MT5 Brokers
- ✓ *FREE *$50 to start (withdrawable)
- ✓ Deposit bonus up to $5,000
- ✓ Negative balance protection
Trading forex and CFDs carries a significant risk of loss and is not suitable for everyone. Broker links are affiliate links — we may earn a commission at no cost to you.
Free MT4 Indicator Download

Enter Your Email Address below, download link will be sent to you.