

The VWAP Indicator MT4 gives traders a way to judge where price sits relative to a volume-weighted average price. It can help identify potential pullback areas, trend bias, and stretched price conditions. Here’s how traders can use it without treating the indicator as a standalone buy or sell system.
What Is the VWAP Indicator MT4?
VWAP stands for Volume Weighted Average Price. Unlike a simple moving average, VWAP gives greater importance to prices associated with higher trading volume.
The basic calculation is:
VWAP = Cumulative (Price × Volume) ÷ Cumulative Volume
In spot forex, there is no centralized exchange volume for the entire market. MT4 indicators therefore commonly work with tick volume, which measures how frequently prices change during a candle. That distinction matters because tick volume isn’t the same as centralized exchange-traded volume.
The VWAP line can act as a reference point for the session or selected calculation period. When price trades above it, buyers have generally been able to push price above the weighted average. When price stays below it, sellers have greater control.
But traders shouldn’t treat every VWAP touch as a reversal signal. Market structure still matters.
How Traders Can Read VWAP on MT4
The simplest approach is to combine VWAP with price action and trend direction.
Suppose EUR/USD is trading around 1.0840 on the 1-hour chart while VWAP sits at 1.0825. Price then breaks a previous resistance level at 1.0835 and holds above VWAP. A pullback toward 1.0830–1.0835 followed by a bullish rejection can provide a more controlled long entry than buying the initial breakout.
A trader might place a stop around 10–15 pips below the rejection area and target the next resistance zone 25–40 pips higher. The exact levels should come from the chart, not from a fixed formula.
Another useful setup appears when price repeatedly crosses VWAP during sideways trading. For example, GBP/USD may move through the VWAP line four or five times within a 20-pip range on the 15-minute chart. That’s usually a warning that the market lacks clean direction. Taking every VWAP crossover in this situation can create a series of whipsaws.
When testing the indicator during volatile NFP sessions, traders should also expect larger deviations from VWAP. A 30–50 pip move away from the line doesn’t automatically mean price must return. Strong news can keep price stretched for an extended period.
Practical VWAP Trading Setups
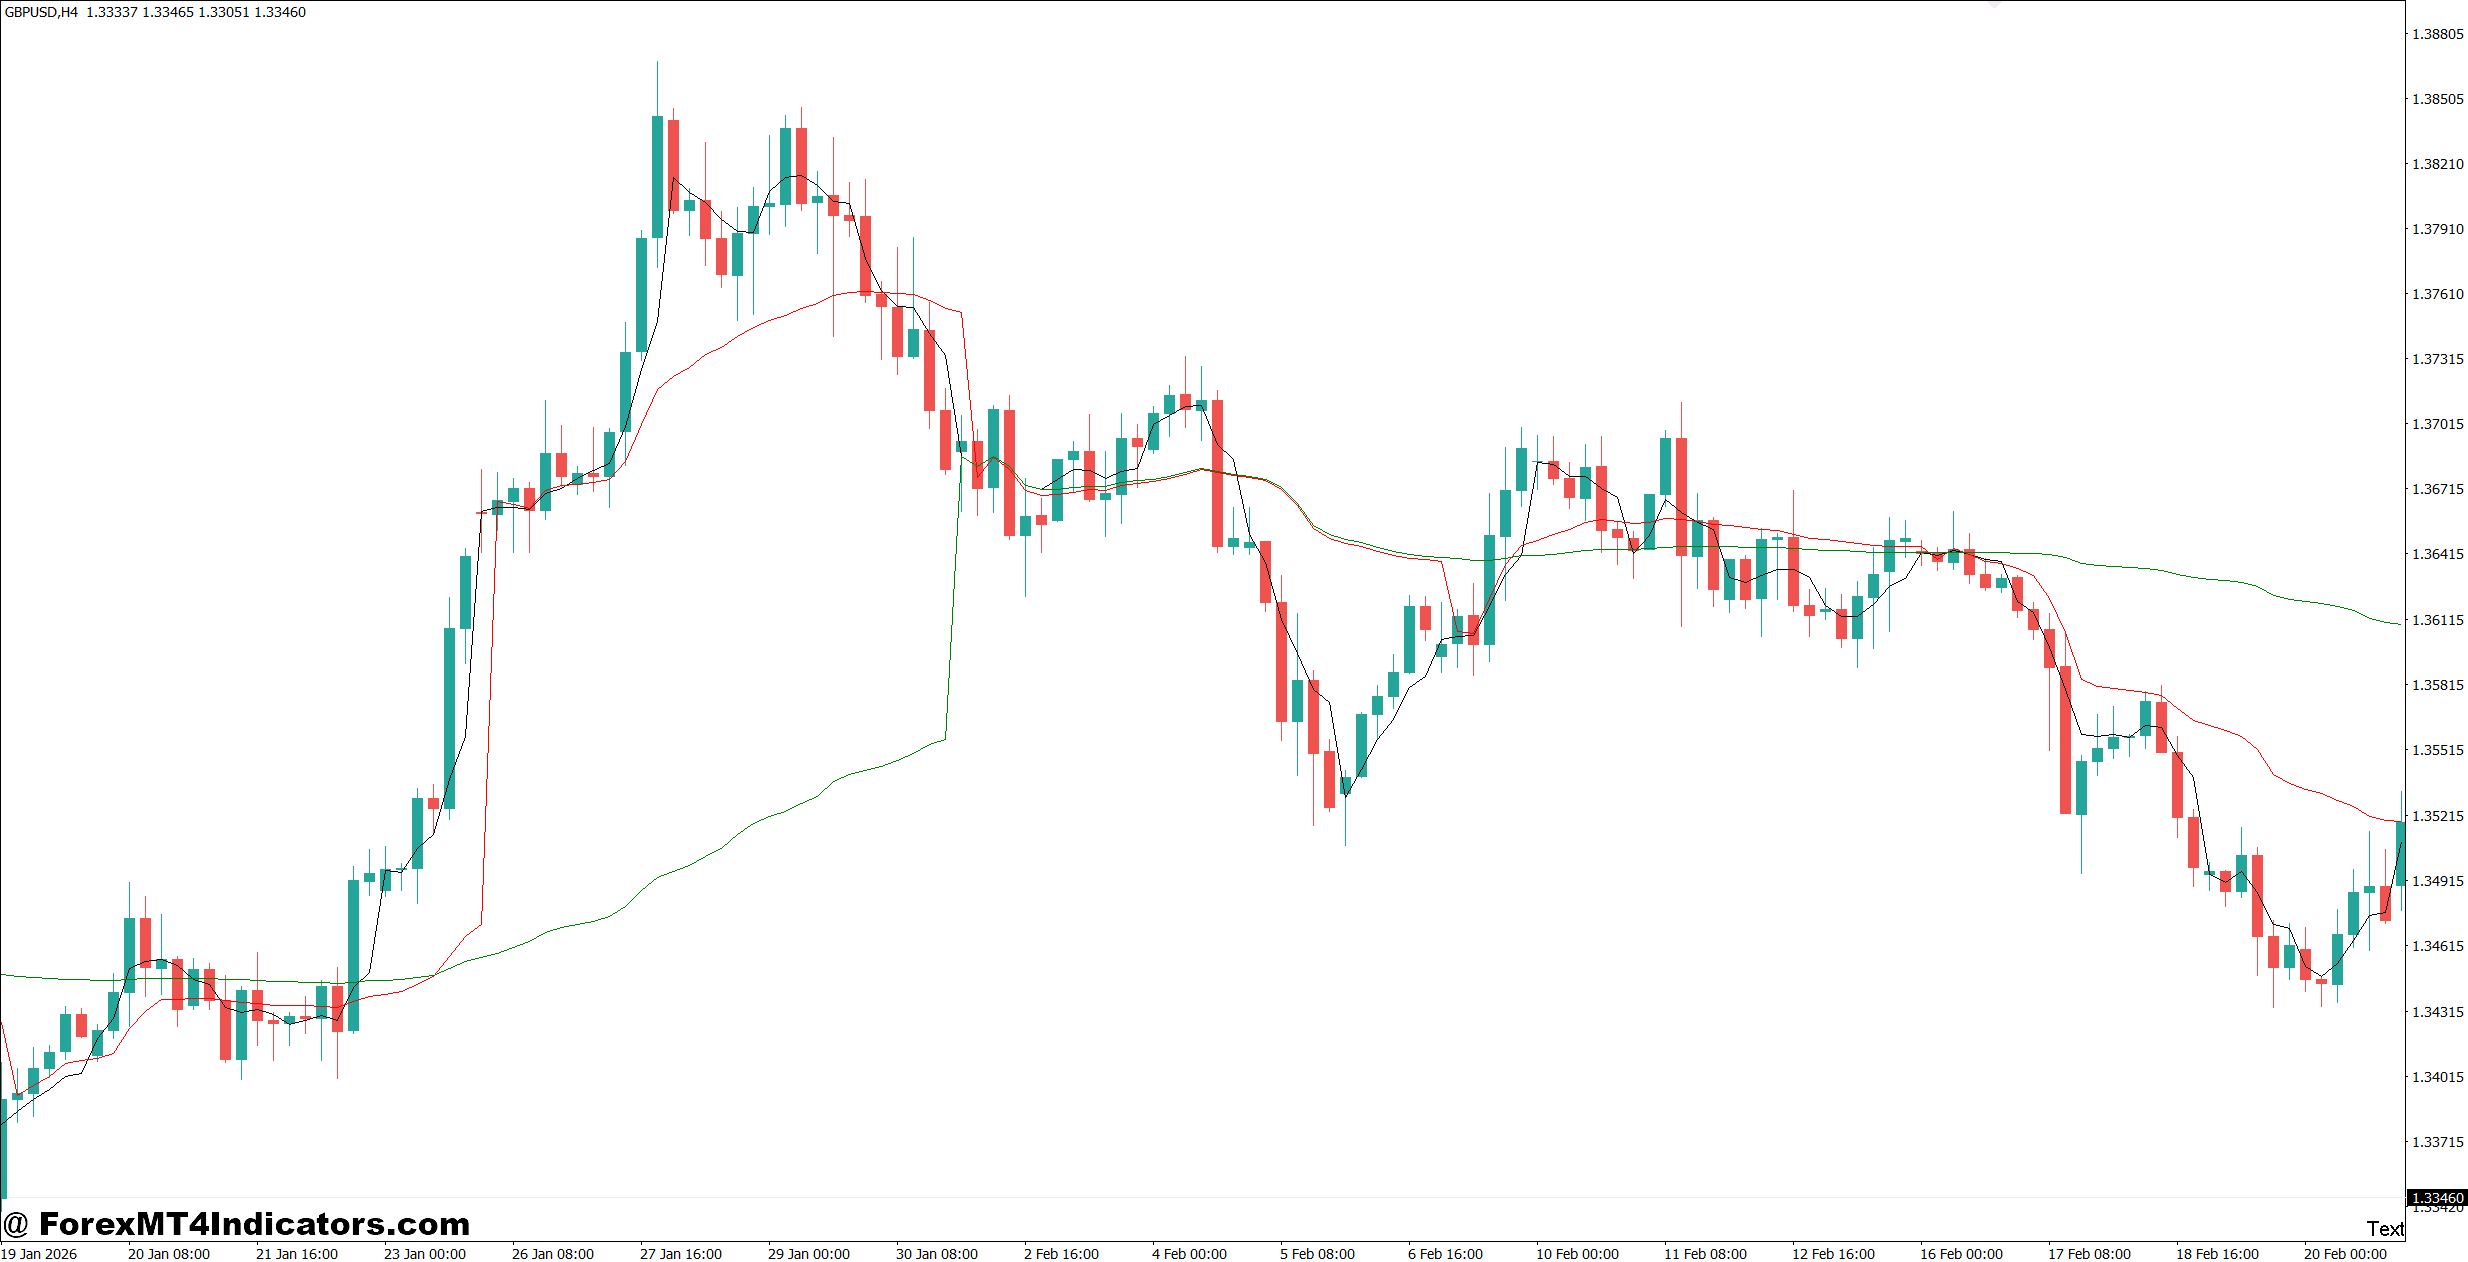
1. Trend Pullback Setup
A strong trend offers one of the cleaner ways to use VWAP.
Imagine USD/JPY on the 1-hour chart has moved from 148.20 to 149.10 while VWAP rises steadily underneath price. After the rally, price pulls back to 148.80, close to VWAP, and forms a bullish rejection candle.
Instead of chasing the earlier move, the trader can wait for the rejection and consider an entry above the candle’s high. A 15–20 pip protective stop may be reasonable if the nearby structure supports it, while a 30–50 pip target could provide a 1:2 or better risk-to-reward setup.
The key idea is not simply “price touched VWAP.” The setup works better when VWAP, market structure, and momentum point in the same direction.
2. VWAP Break and Retest
A VWAP break can become useful when price also breaks a meaningful support or resistance level.
For instance, EUR/USD trades below VWAP around 1.0910 during the London session. It then breaks resistance at 1.0920 and closes above both levels. If the next candle retests 1.0920–1.0925 and rejects lower prices, traders can look for bullish continuation.
A stop below the retest structure might be 12–18 pips, with the first target near the next 25–35 pip resistance zone.
3. Avoiding Overextended Entries
VWAP can also help identify when a move has become extended.
If GBP/USD is 50 pips above VWAP after several consecutive bullish candles, buying immediately may offer poor risk-to-reward. The better choice may be to wait for consolidation or a controlled pullback.
That doesn’t mean price must fall back to VWAP. Strong trends can remain far above the line. The indicator is simply giving traders a reference for judging how far price has moved from its weighted average.
Settings, Timeframes, and Pair Selection
VWAP settings depend heavily on the trader’s strategy and the MT4 indicator version being used. Some versions provide session-based VWAP, while others allow different periods or calculation modes.
For intraday trading, a session VWAP can be useful on the 5-minute, 15-minute, and 1-hour charts. A trader focusing on EUR/USD might use the 15-minute chart for entries while checking the 1-hour chart for the broader structure.
For slower trading, the 4-hour chart can provide useful context, although traders should confirm how the particular VWAP Indicator MT4 calculates its values across sessions.
Settings should also be tested separately for different pairs. EUR/USD may behave differently from GBP/JPY because volatility, spreads, and trading activity aren’t identical.
A practical starting point is to test the indicator over at least 50–100 historical setups. Traders can record entry distance from VWAP, stop size, target size, session, and outcome. That creates better evidence than changing settings after every losing trade.
VWAP vs Moving Averages and Other Indicators
VWAP and moving averages answer slightly different questions.
A 20-period EMA focuses on recent price data and reacts to price changes over a fixed number of candles. VWAP incorporates volume into its calculation and is often used as a reference for the average traded price during a session or selected period.
The RSI, meanwhile, measures momentum rather than average price location. A trader might therefore combine VWAP with the 14-period RSI. For example, price holding above VWAP while RSI remains above 50 can support a bullish bias, but neither condition guarantees a winning trade.
Support and resistance can make the combination even stronger. If VWAP sits near a previous resistance-turned-support zone, traders have two separate reasons to watch that area for a reaction.
The limitation is equally clear: VWAP can perform poorly in choppy markets. Repeated crosses don’t necessarily signal meaningful trend changes. News events can also push price far away from VWAP and keep it there.
Trading forex carries substantial risk. No indicator guarantees profits. Traders should use sensible position sizing, predefined stop-loss levels, and avoid risking money they can’t afford to lose.
How to Trade with VWAP Indicator MT4
Buy Entry
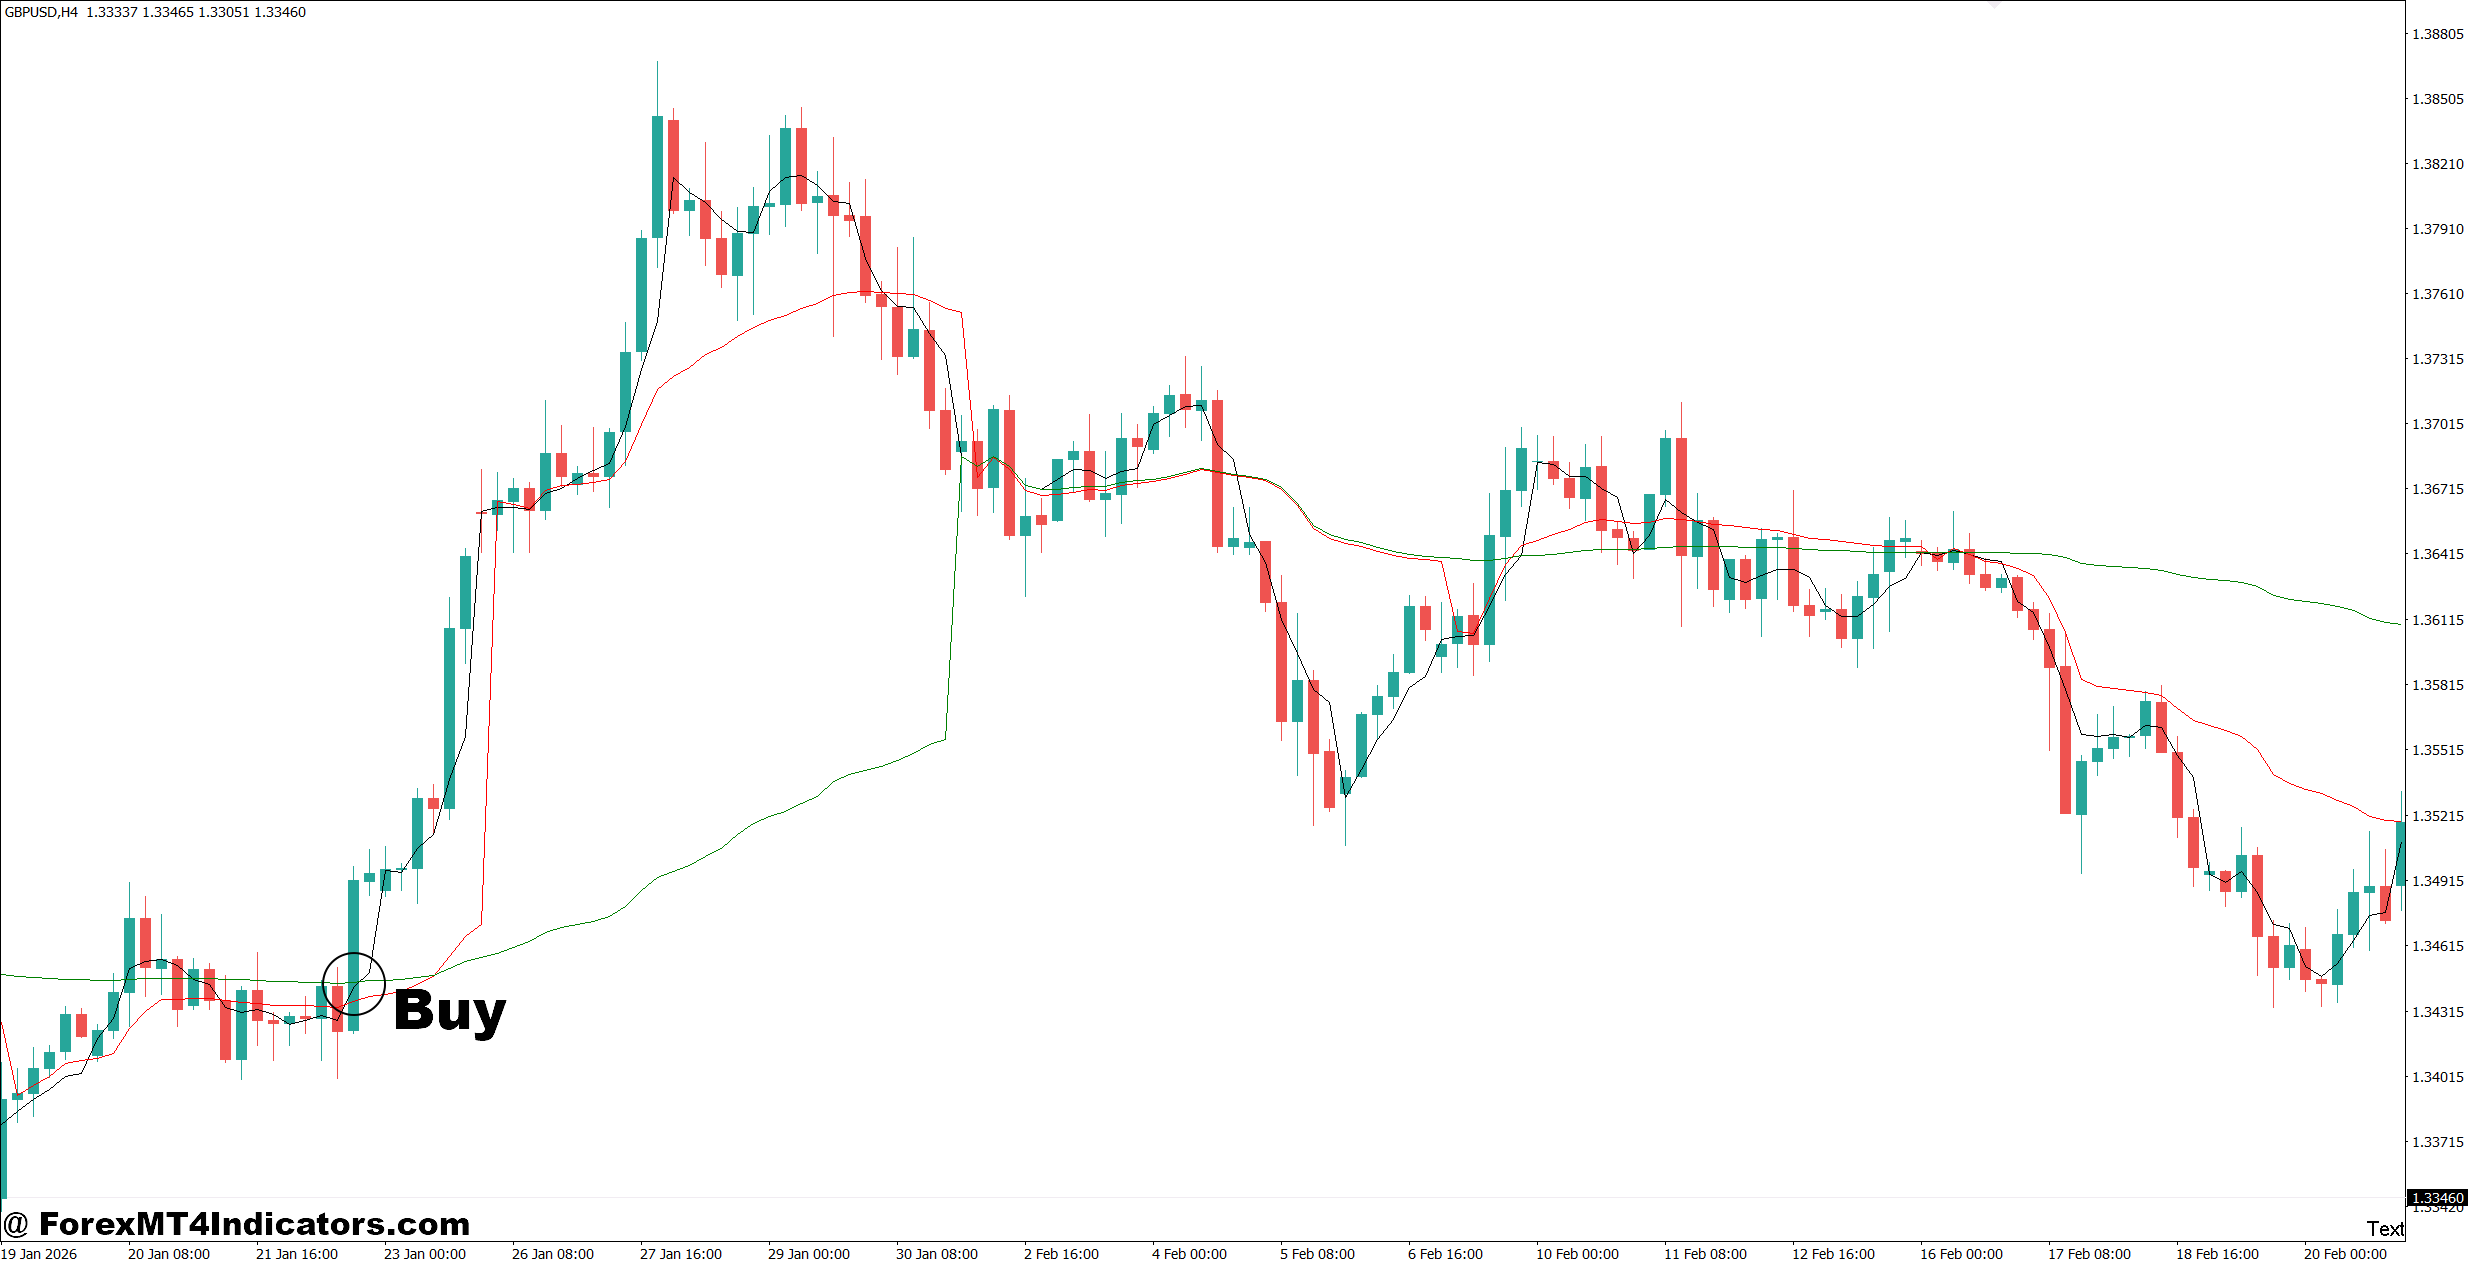
- Buy above VWAP – Enter long when EUR/USD closes above VWAP on the 1-hour chart; aim for 20–40 pips with a 10–15 pip stop.
- Wait for a VWAP retest – Let GBP/USD pull back to VWAP after a breakout, then enter after bullish rejection; risk no more than 1% per trade.
- Confirm 1-hour trend – Take BUY signals when price makes higher highs and higher lows above VWAP; avoid countertrend entries.
- Use 4-hour confirmation – If the 4-hour chart remains bullish and price holds above VWAP, target 30–60 pips on the 1-hour setup.
- Check support near VWAP – Buy when VWAP aligns with a support zone within 5–10 pips and price rejects the area.
- Avoid stretched entries – Don’t buy EUR/USD when price is already 40–50 pips above VWAP; wait for a pullback or consolidation.
- Set a logical stop-loss – Place the stop 10–20 pips below VWAP or the recent swing low, whichever gives better structure.
- Limit daily exposure – Risk a maximum of 2% across all BUY trades and stop trading after 3 consecutive losses.
Sell Entry
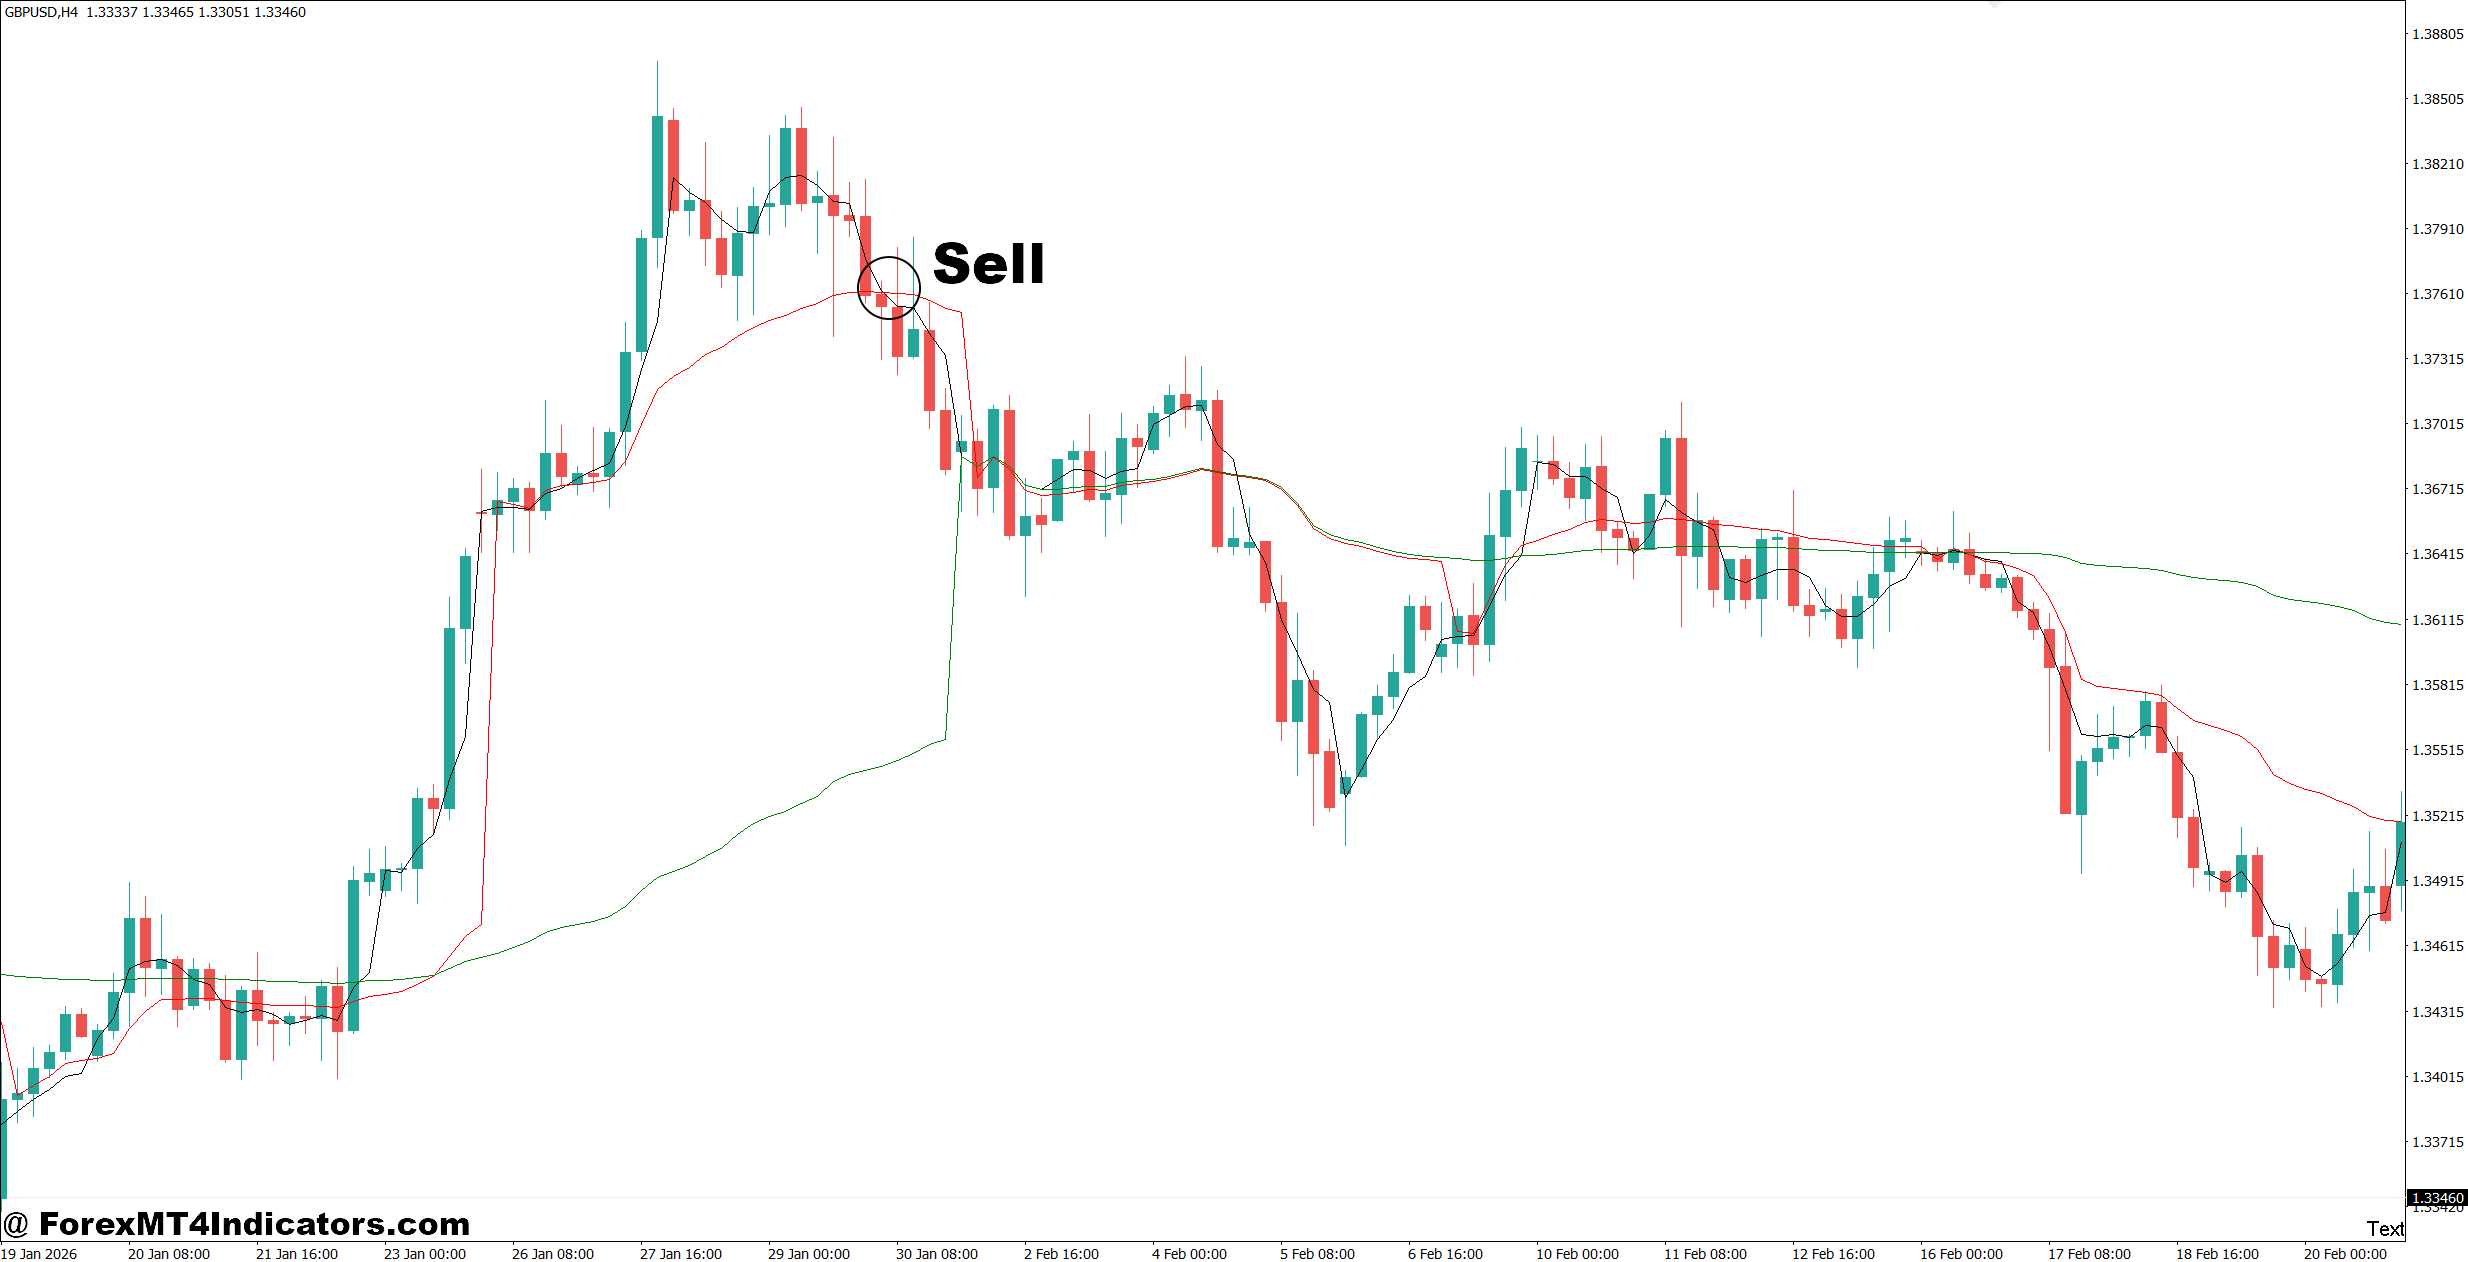
- Sell below VWAP – Enter short when GBP/USD closes below VWAP on the 1-hour chart; consider a 20–40 pip target with a 10–15 pip stop.
- Trade the VWAP retest – Wait for price to retest VWAP from below and reject it; enter after bearish confirmation.
- Confirm lower structure – Look for lower highs and lower lows below VWAP before selling; avoid trades during sideways chop.
- Use 4-hour confirmation – A bearish 4-hour trend strengthens a 1-hour SELL setup; target 30–60 pips when volatility supports it.
- Watch resistance near VWAP – Sell when VWAP sits within 5–10 pips of resistance and price forms a bearish rejection candle.
- Don’t chase sharp drops – Avoid selling EUR/USD after a 40–50 pip fall below VWAP; wait for a retracement.
- Protect the position – Place the stop 10–20 pips above VWAP or the latest swing high and keep risk near 1%.
- Skip major news signals – Avoid new SELL entries immediately before high-impact releases such as NFP; spreads and volatility can expand quickly.
Final Thoughts on VWAP Indicator MT4
The VWAP Indicator MT4 works best as a reference tool rather than a mechanical signal generator. Traders can use it to:
- Judge price location – See whether the current market price is above or below its volume-weighted average.
- Improve pullback entries – Look for price to return toward VWAP during an established trend instead of chasing extended candles.
- Confirm market structure – Give more weight to VWAP setups that agree with support, resistance, breakouts, and trend direction.
- Control risk – Define stops and targets from actual chart structure rather than assuming every VWAP reaction will succeed.
The most useful test is simple: apply the method to a meaningful sample of trades and record the results. A VWAP setup that works on EUR/USD during London trading may behave differently on GBP/JPY during New York. Good trading comes from understanding those differences, not from expecting one indicator to solve every market condition.
Level up your trading
Learn to read the chart — not just the indicator
eBook · Instant PDF
Video Course · 12 modules
Recommended MT4/MT5 Brokers
- ✓ *FREE *$50 to start (withdrawable)
- ✓ Deposit bonus up to $5,000
- ✓ Negative balance protection
Trading forex and CFDs carries a significant risk of loss and is not suitable for everyone. Broker links are affiliate links — we may earn a commission at no cost to you.
Free MT4 Indicator Download

Enter Your Email Address below, download link will be sent to you.