

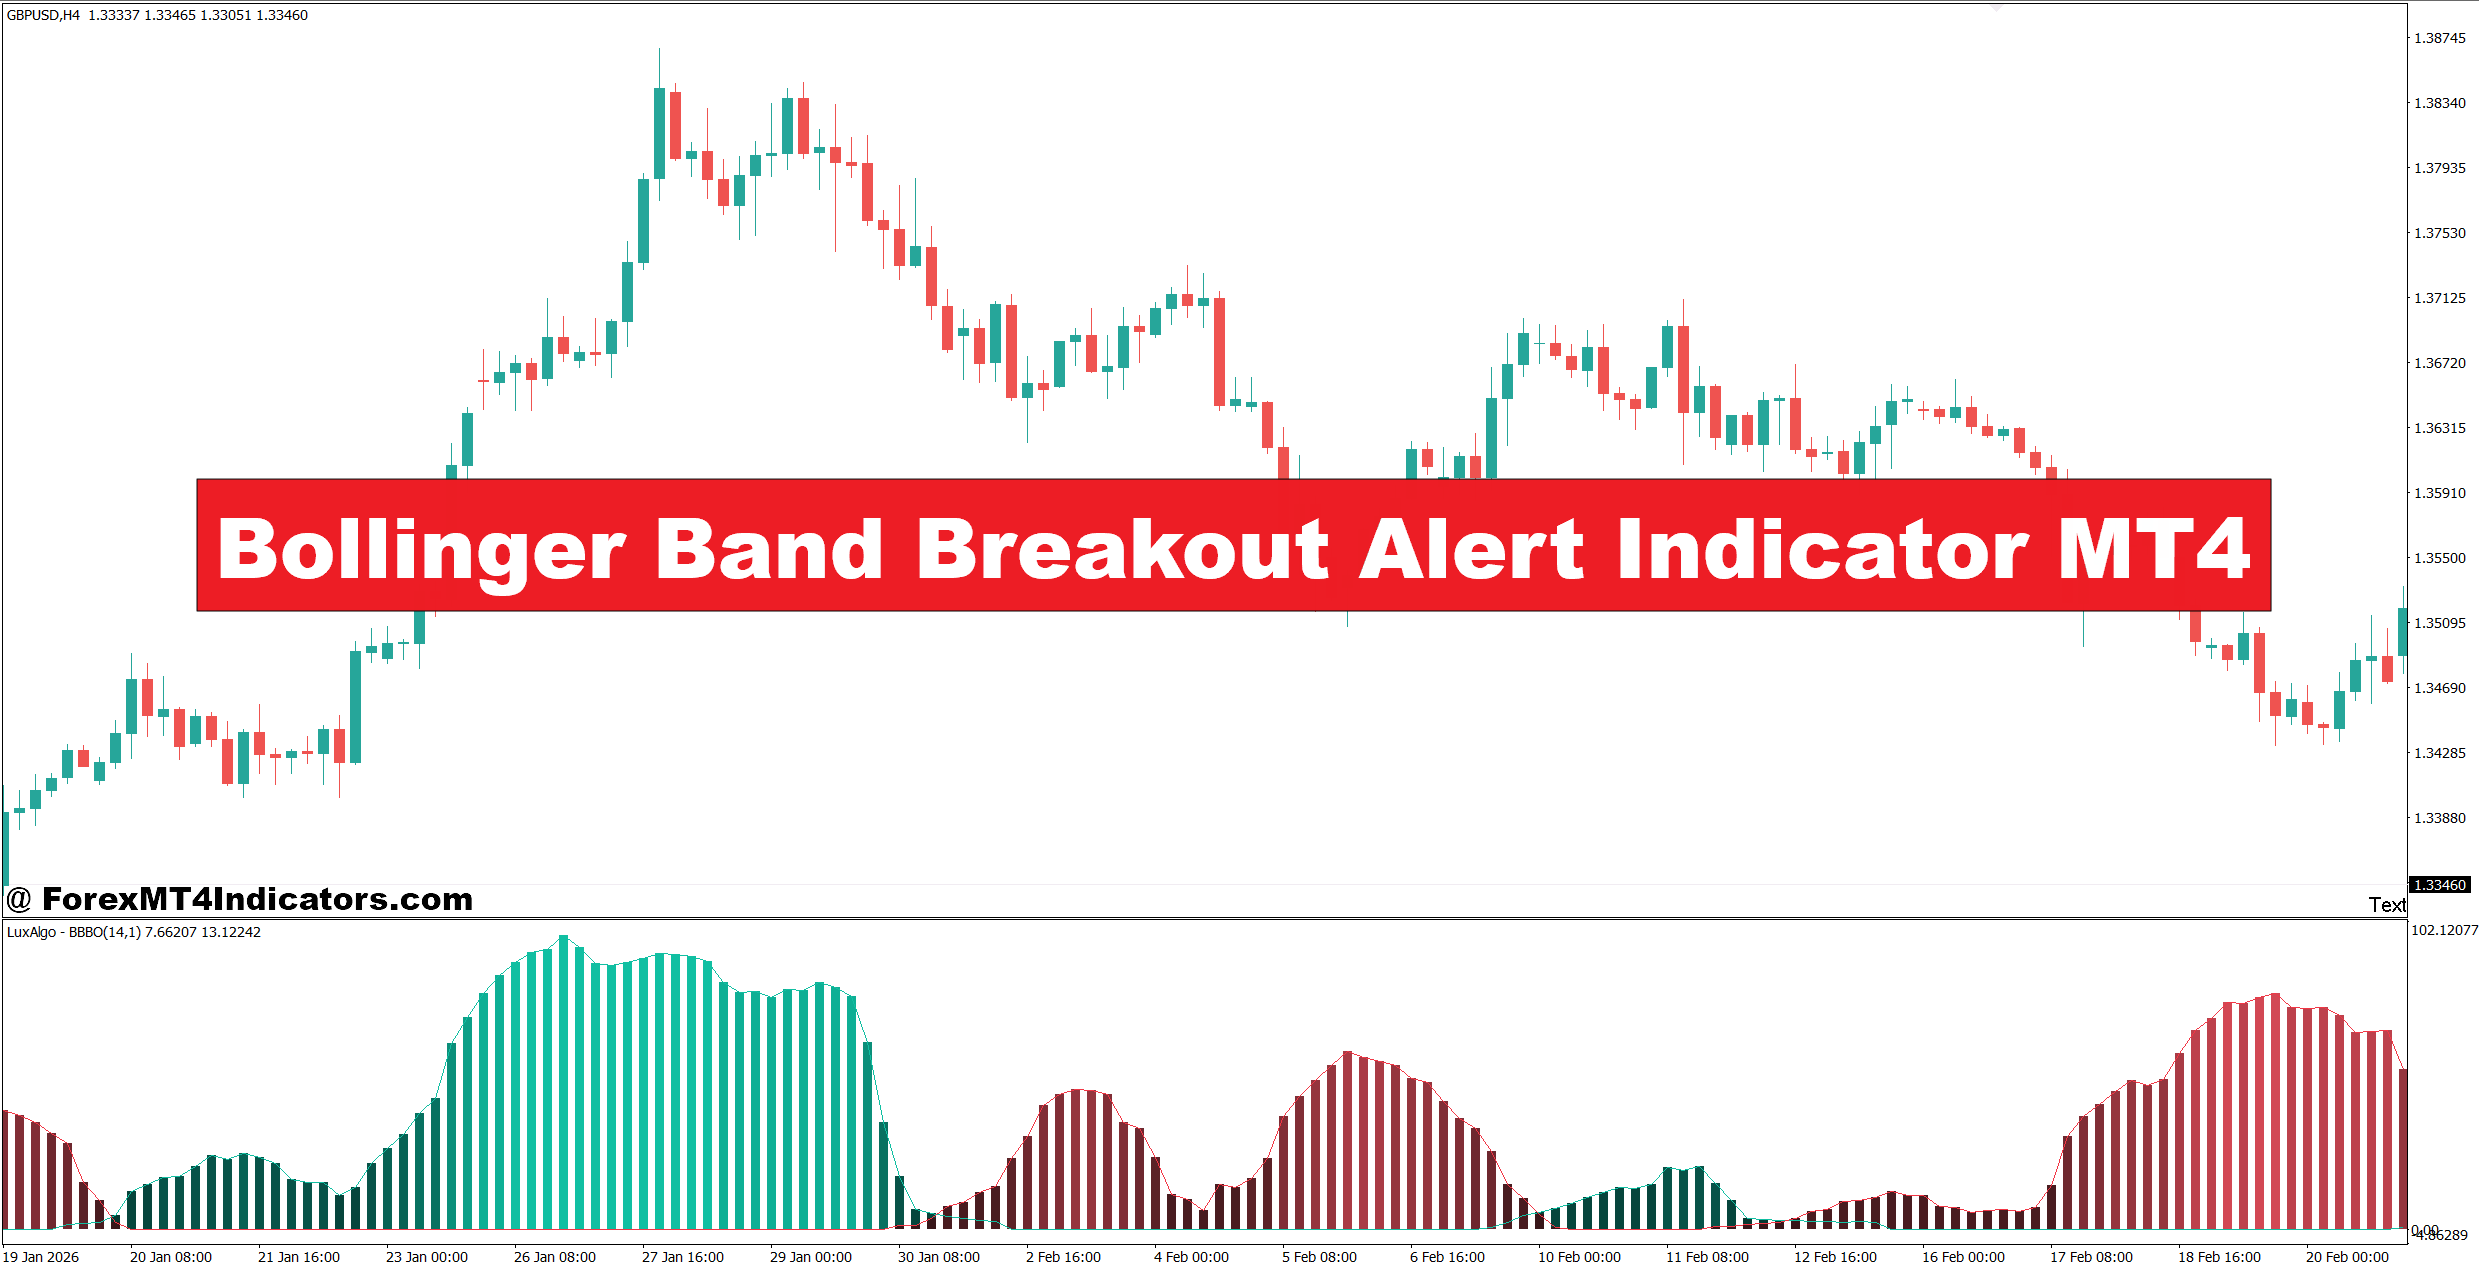
The Bollinger Band Breakout Alert Indicator MT4 is designed to help with this problem by notifying traders when price pushes beyond a Bollinger Band and shows potential breakout activity.
Missing these moves can create more than frustration. Late entries often lead to poor risk-to-reward ratios, while chasing a candle can result in entering just before a pullback. On volatile news days, false breakouts can make the situation even worse and cause unnecessary drawdown.
This indicator gives traders a faster way to spot unusual price expansion. It doesn’t predict where the market must go, but it can highlight moments when volatility and momentum deserve attention. The real value comes from combining the alert with price action, market structure, and sensible risk control.
How the Bollinger Band Breakout Alert Indicator Works
The indicator is based on the standard Bollinger Bands concept. Traditional Bollinger Bands typically use a 20-period moving average as the middle band, with the upper and lower bands placed a certain number of standard deviations away from that average.
The basic calculation is:
- Middle Band: 20-period moving average
- Upper Band: Moving Average + 2 standard deviations
- Lower Band: Moving Average – 2 standard deviations
The Bollinger Band Breakout Alert Indicator MT4 monitors price interaction with these outer bands. When a candle closes or pushes beyond the upper band, the tool can generate a bullish breakout alert. A move below the lower band can trigger a bearish alert.
But a band break alone isn’t enough to justify a trade. Price can move outside a band during strong momentum and continue for 80 pips, but it can also snap back within minutes. That is why experienced traders often check the candle close, recent support or resistance, and the overall trend before acting.
A useful setup occurs when the bands contract during low volatility and then begin expanding. This contraction is often called a Bollinger squeeze. The breakout alert becomes more interesting when price escapes that tight range with a strong candle body.
Using Breakout Alerts in Real Trading Conditions
Consider EUR/USD on the 1-hour chart. Price may spend six hours trading inside a 25-pip range while the Bollinger Bands gradually tighten. If an H1 candle then closes 18 pips above the upper band and breaks a nearby resistance level, the alert may point to a legitimate momentum opportunity.
A trader could avoid entering immediately at the candle’s high. Instead, he or she might wait for a pullback toward the broken resistance area. If price retests the level and holds above it, a buy entry may offer better risk control.
For example, an entry at 1.0850 with a 25-pip stop-loss below the retest could target a previous daily resistance area 50 to 75 pips higher. That creates a potential risk-to-reward ratio between 1:2 and 1:3.
The opposite situation can occur on GBP/USD. Suppose the pair trades near 1.2750 and breaks below the lower Bollinger Band during the London session. If the breakout candle also closes below a clear H4 support level, the bearish signal carries more weight.
Here’s the thing: session timing matters. A breakout during the quiet Asian session may fail more often than one supported by strong activity during London or the London-New York overlap. Traders should also watch the size of the breakout candle. A 60-pip candle that is already stretched far from the moving average may offer a worse entry than a smaller breakout followed by a controlled retest.
When testing this type of setup on volatile NFP days, traders should be especially careful. A price spike can trigger an alert in both directions within a short period. That kind of whipsaw can stop out traders who enter every notification without checking the broader market context.
Settings and Customization for Different Markets
Most Bollinger breakout tools allow traders to adjust the Bollinger period, deviation, and alert behavior. The standard 20-period setting with a deviation of 2.0 is a reasonable starting point because it matches the traditional Bollinger Bands setup.
For shorter timeframes such as M5 or M15, traders may test a 20-period setting but should expect more noise. On EUR/USD, a breakout of only 5 to 8 pips beyond the band may not mean much during active market hours. A stronger confirmation, such as a candle close outside the band plus a break of intraday structure, can filter some fake-outs.
On the H1 chart, traders may look for a more meaningful move. For example, a 15- to 25-pip break beyond the band combined with rising momentum can provide a clearer signal. On H4 or daily charts, the indicator generates fewer signals, but those signals may align better with larger market swings.
A shorter period, such as 14, makes the bands react faster to recent price movement. This can help aggressive traders spot changes earlier, although it can also create more alerts during choppy conditions. A longer setting, such as 30 periods, smooths the bands and may reduce some noise.
Alert settings also matter. Popup, sound, email, or push notifications can be useful, but too many alerts become a distraction. A practical approach is to limit notifications to preferred currency pairs and higher-quality timeframes.
Strengths, Limitations, and Comparison With Other Tools
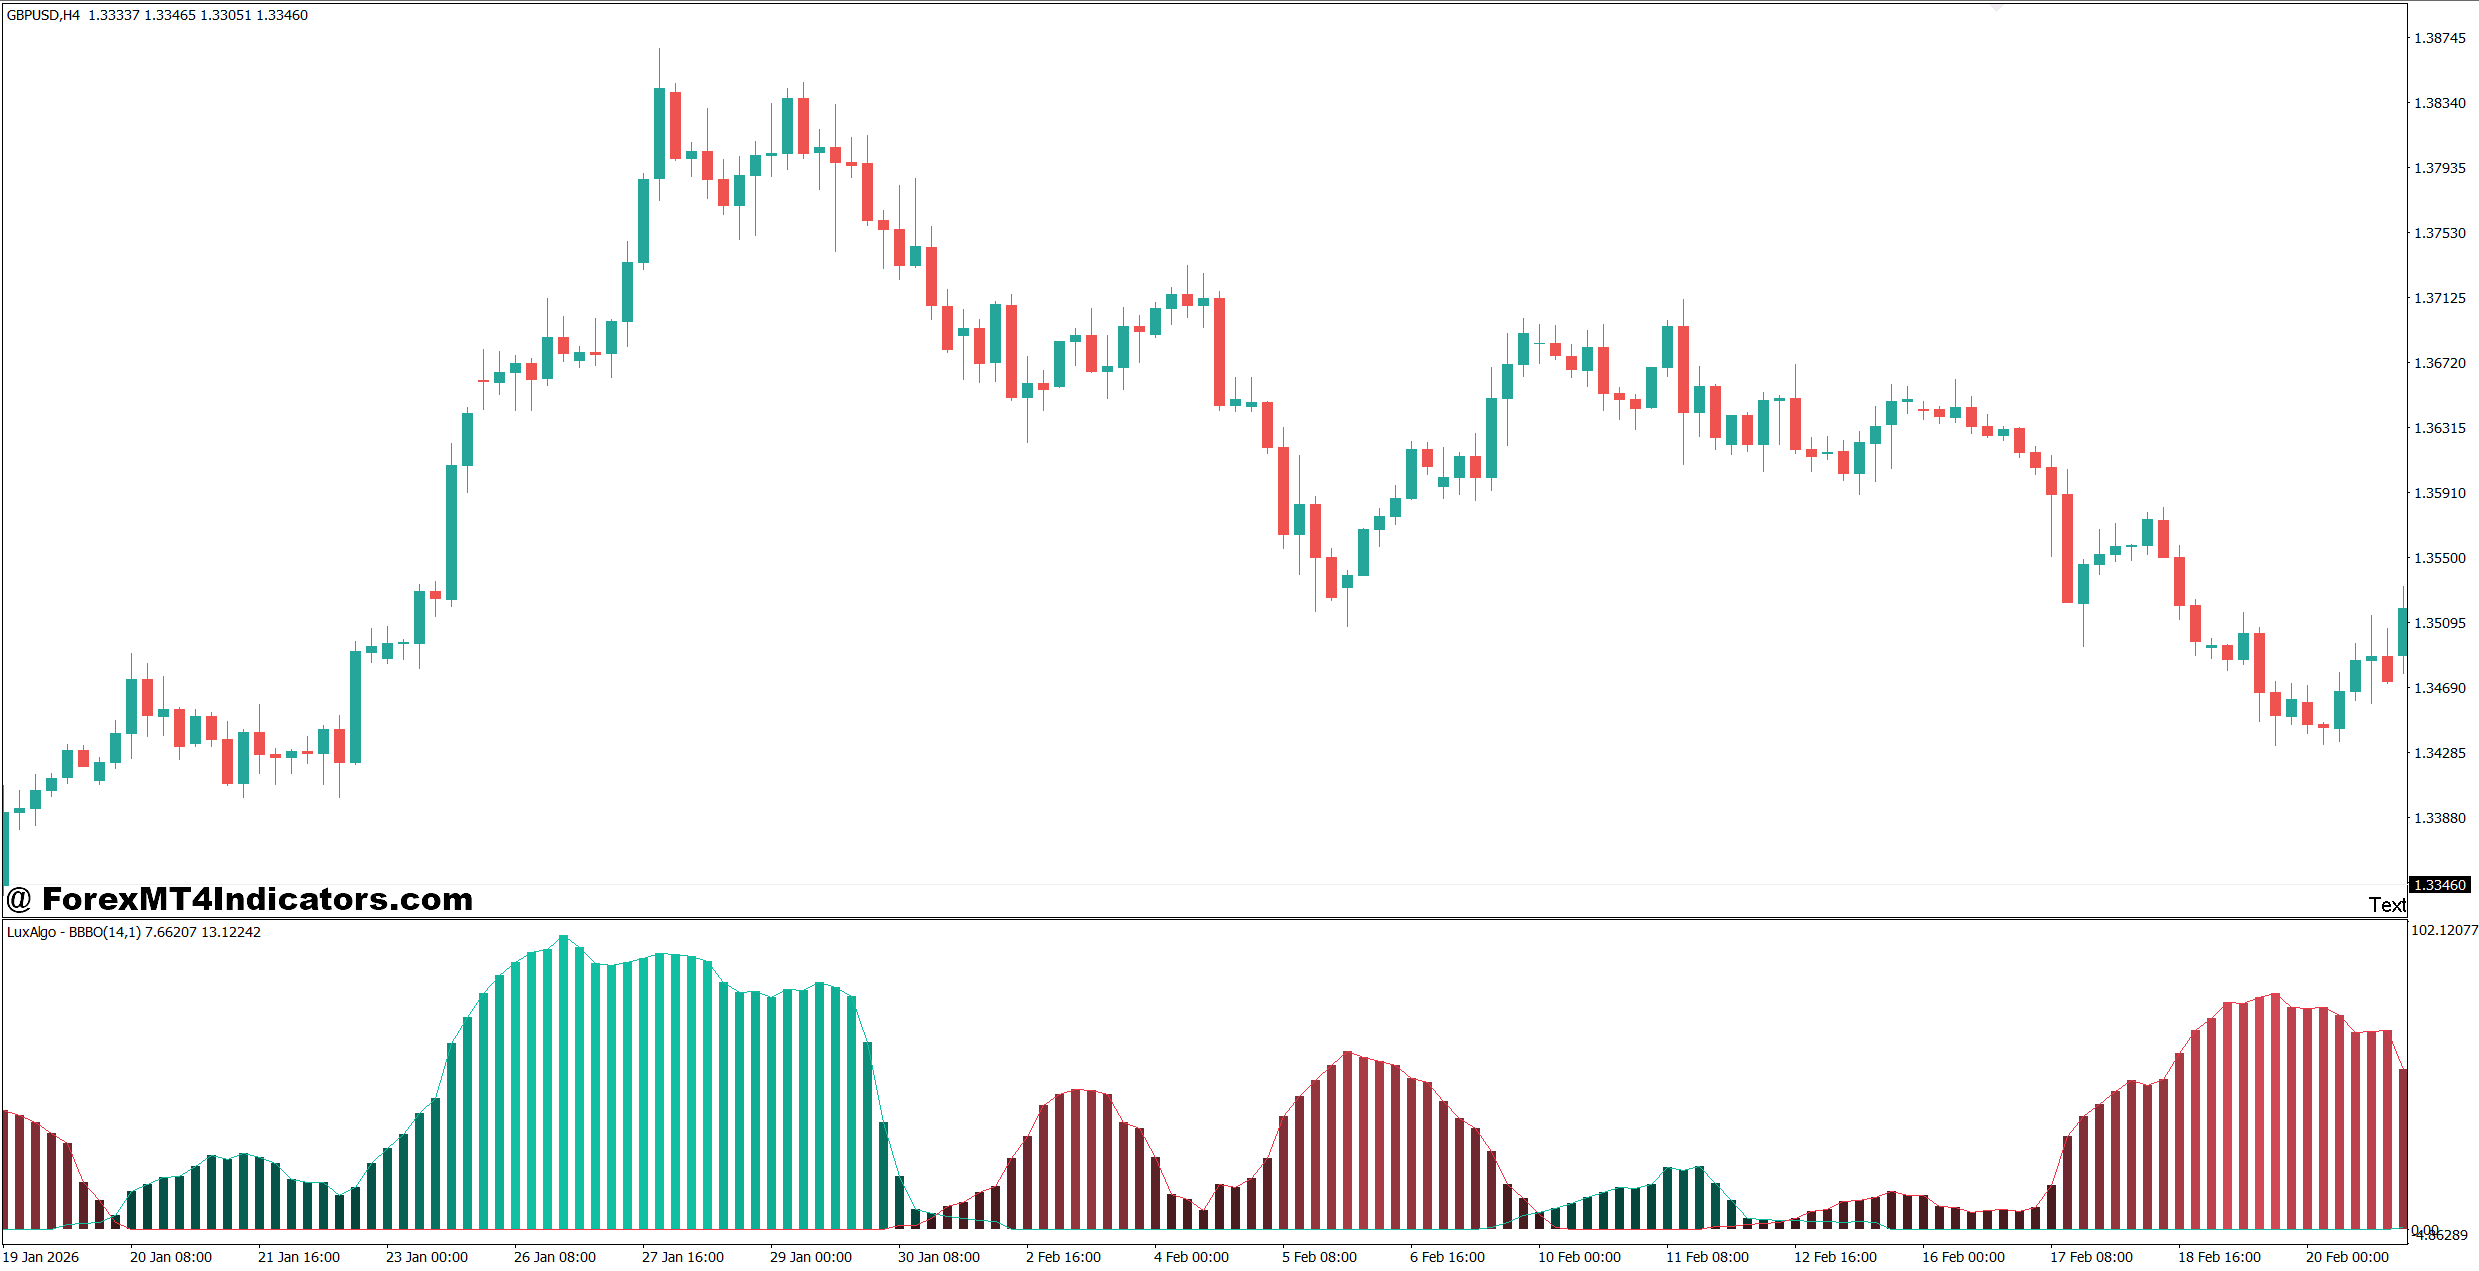
The main strength of this forex breakout indicator is speed. Traders don’t need to stare at several charts waiting for price to move beyond the bands. The alert can bring attention to the chart when volatility expands.
It also works well with other technical analysis methods. A trader can combine it with support and resistance, a 50-period EMA, or the 14-period RSI. For instance, a bullish breakout above the upper band may have stronger context when price is also above the 50 EMA and the RSI remains above 55.
Still, Bollinger Band signals have clear limitations. A move outside the upper band does not automatically mean the market is overbought, and a move below the lower band doesn’t guarantee further selling. Strong trends can remain near an outer band for several candles.
Compared with a moving average crossover, the breakout alert reacts more directly to volatility expansion. Compared with RSI, it focuses less on momentum thresholds and more on how far price has moved relative to its recent average. ATR, on the other hand, measures volatility but does not provide the same visual breakout location.
What makes this different? The indicator’s main job is not to replace analysis. It acts as an attention tool. The trader still needs to decide if the breakout has support from trend direction, market structure, volume data where available, and nearby price levels.
There are also conditions where traders may want to ignore the signal. Avoid taking every alert when Bollinger Bands are flat and price is moving sideways inside a wide, messy range. Signals that run directly into major daily support or resistance also deserve caution.
Trading forex carries substantial risk. No indicator guarantees profits. Traders should test the Bollinger Band Breakout Alert Indicator MT4 on a demo account or through historical chart analysis before risking real capital.
How to Trade with Bollinger Band Breakout Alert Indicator MT4
Buy Entry
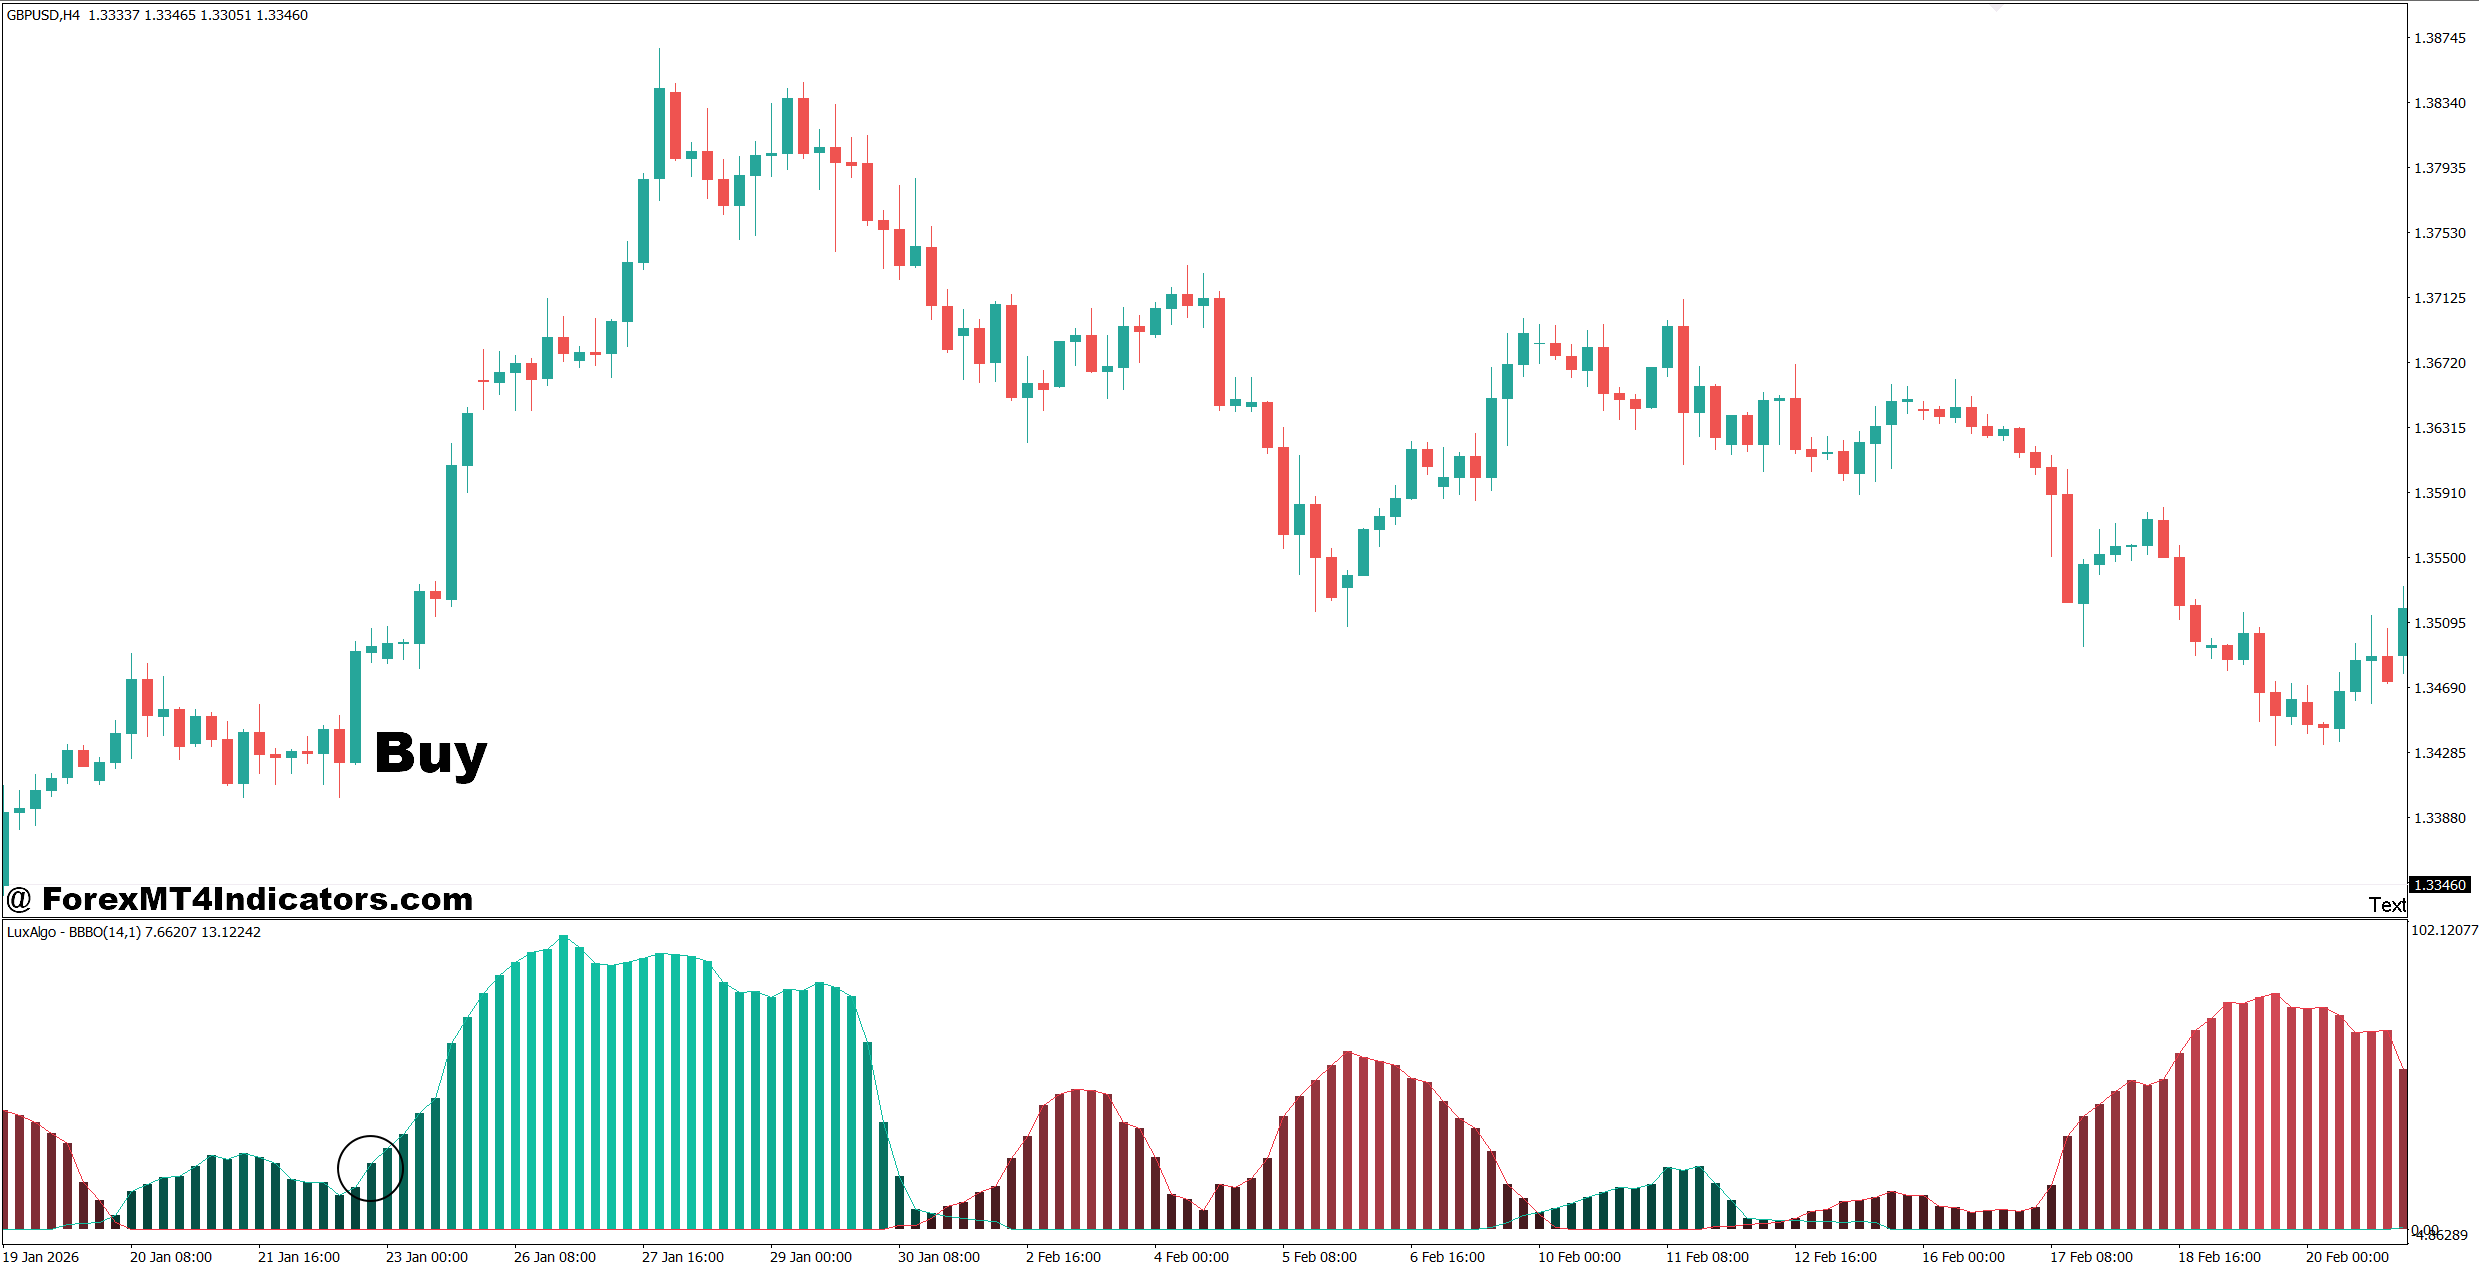
- Buy after an upper-band breakout – Enter when an H1 candle closes above the upper Bollinger Band and breaks resistance by at least 5–10 pips.
- Confirm a strong candle close – Prefer a bullish candle with a body covering 60% or more of its total range to avoid weak breakouts.
- Check the trend direction – On EUR/USD H1, favor buy alerts when price remains above the 50 EMA and higher highs are forming.
- Wait for a retest – After a 15–20 pip breakout, consider buying a successful retest of the broken resistance instead of chasing the candle.
- Use H4 confirmation – A bullish H1 breakout is stronger when the H4 chart also shows price above a major support or resistance level.
- Set a controlled stop-loss – Place the stop 15–30 pips below the breakout or retest area, depending on the pair’s volatility.
- Target at least 1:2 risk-to-reward – With a 20-pip stop, look for a minimum 40-pip profit target before entering.
- Avoid weak or overextended signals – Skip GBP/USD buy alerts when price has already jumped 50–70 pips into major daily resistance.
Sell Entry
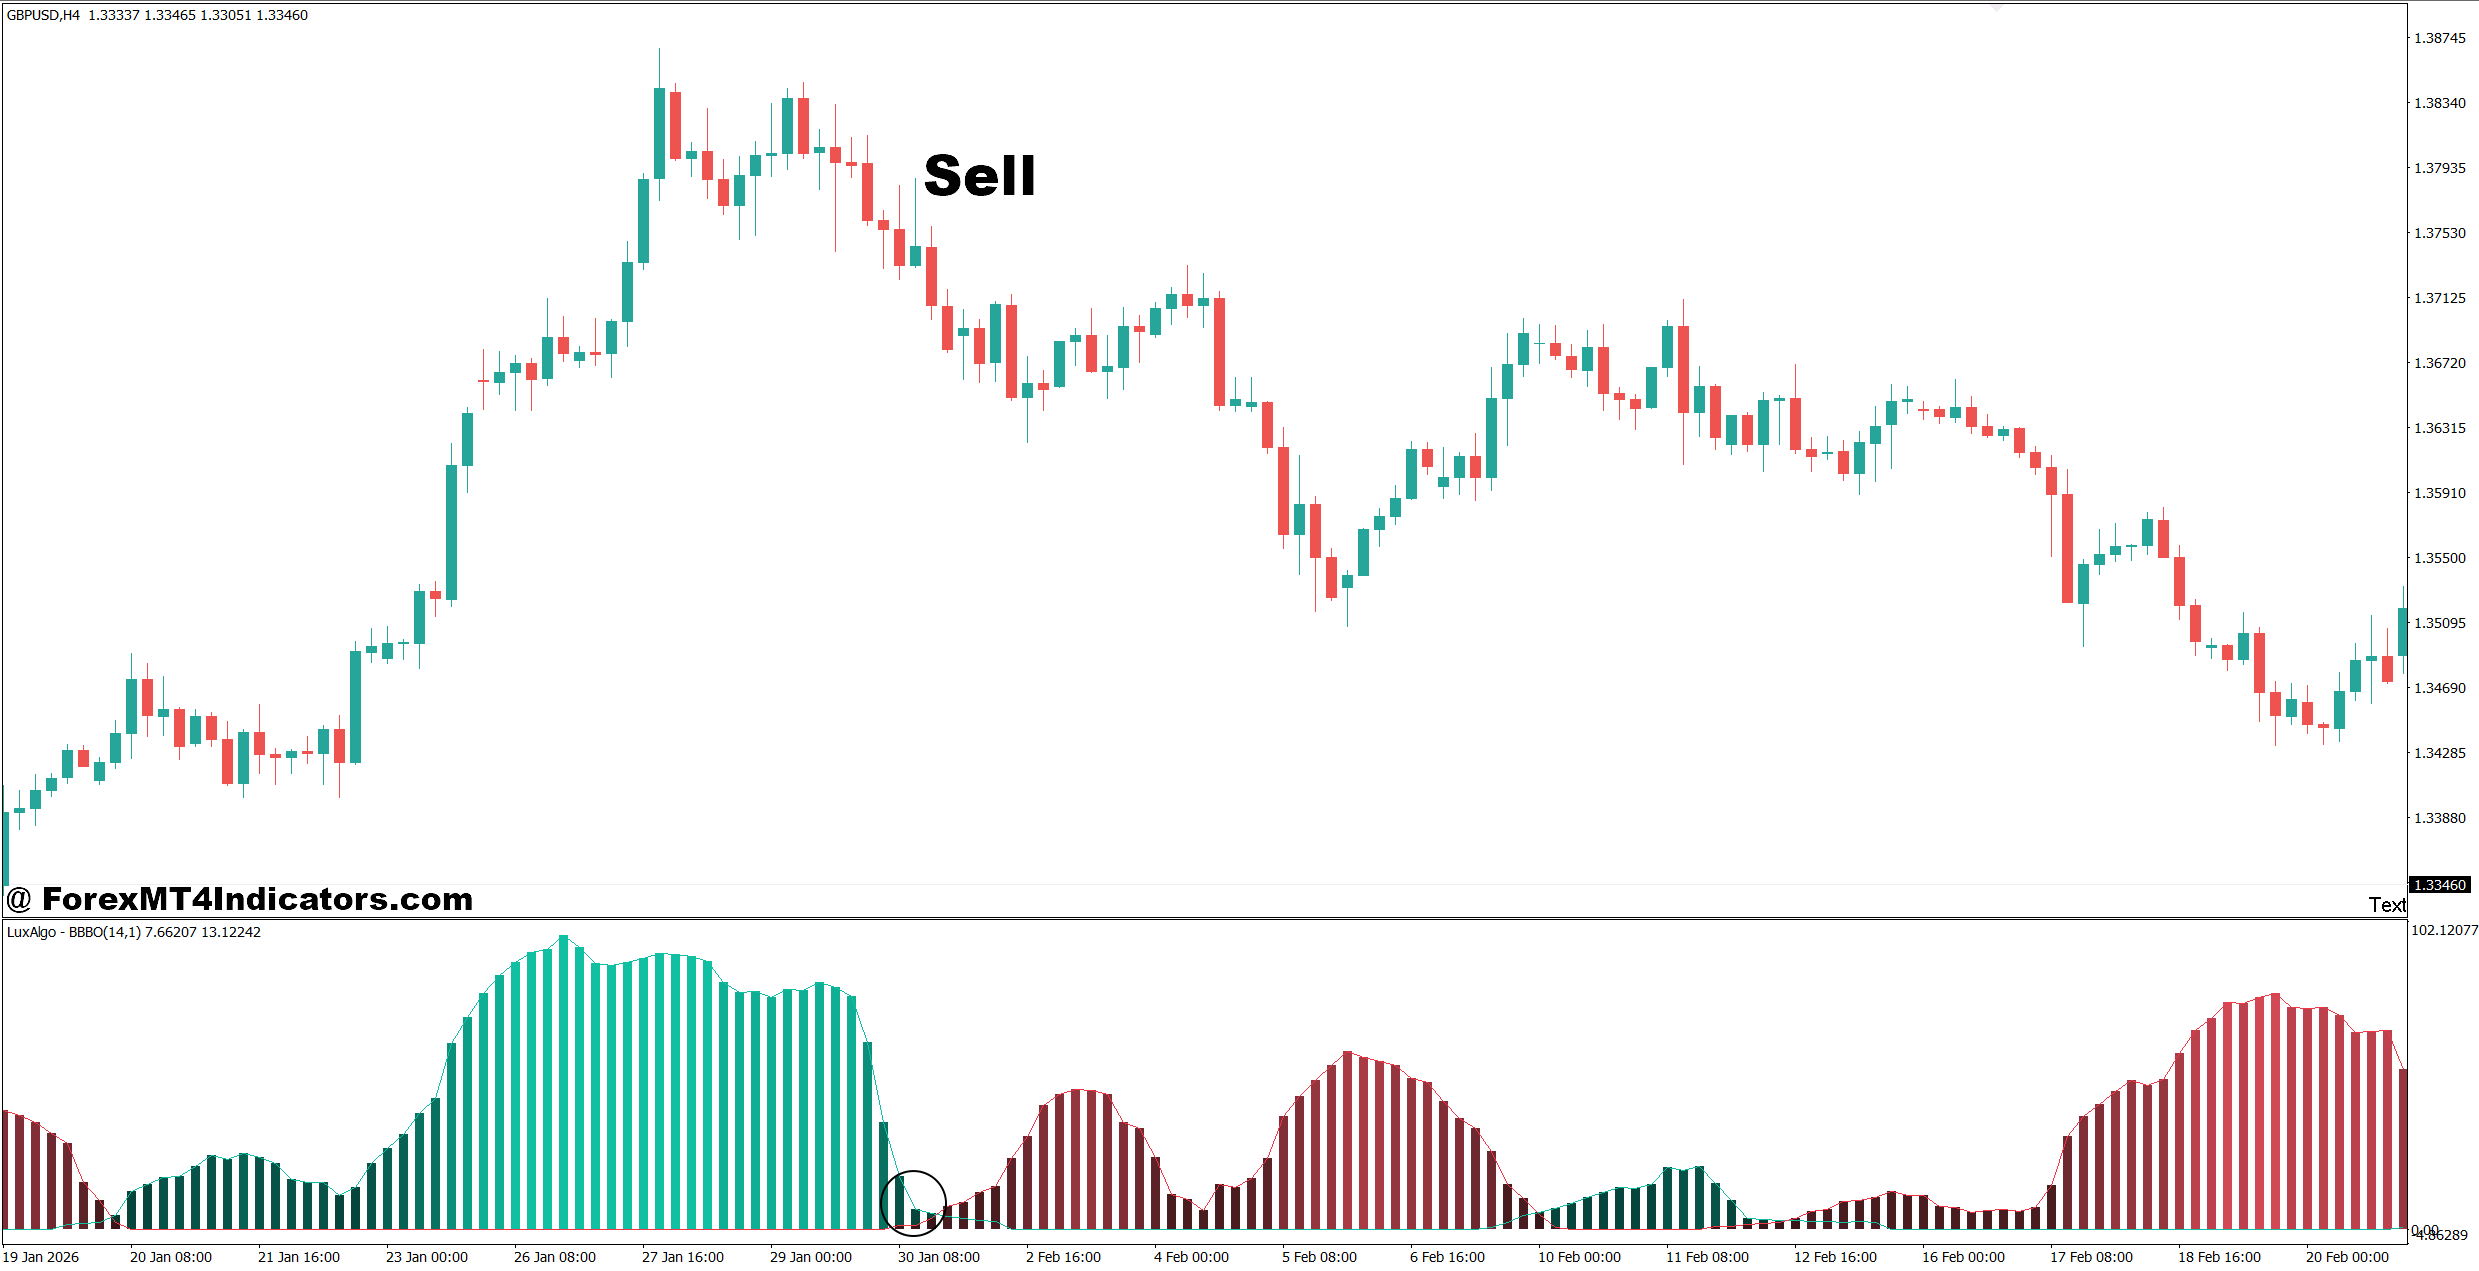
- Sell after a lower-band breakout – Consider selling when an H1 candle closes below the lower Bollinger Band and breaks support by 5–10 pips.
- Confirm bearish momentum – Look for a bearish candle body covering at least 60% of its range before accepting the alert.
- Follow the broader trend – On GBP/USD H1, favor sell signals when price stays below the 50 EMA and forms lower highs.
- Wait for a support retest – After a 15–25 pip breakdown, wait for broken support to reject price before opening the short position.
- Check the daily chart – Avoid aggressive sells when the daily timeframe shows strong support within 20–30 pips of the entry.
- Keep risk below 1–2% – Limit each trade to 1% of account equity, or 2% maximum for a well-tested setup.
- Use a realistic profit target – A 25-pip stop should ideally have a target of at least 50 pips for a 1:2 risk-to-reward setup.
- Avoid news-driven fake-outs – Skip fresh sell alerts on EUR/USD or GBP/USD immediately before major releases such as NFP or CPI.
Final Thoughts
The Bollinger Band Breakout Alert Indicator MT4 can help traders spot volatility expansion without constantly watching the chart. Key points are simple: use alerts as attention signals, confirm breakouts with price structure, adjust settings for the timeframe, and control risk on every trade. A breakout on EUR/USD H1 may look attractive, but entering after an oversized candle can still produce a poor trade. The best results usually come from patience and confirmation rather than reacting to every notification. Traders should test the indicator across different pairs and market conditions, record the results, and decide which setups actually fit their trading plan.
Level up your trading
Learn to read the chart — not just the indicator
eBook · Instant PDF
Video Course · 12 modules
Recommended MT4/MT5 Brokers
- ✓ *FREE *$50 to start (withdrawable)
- ✓ Deposit bonus up to $5,000
- ✓ Negative balance protection
Trading forex and CFDs carries a significant risk of loss and is not suitable for everyone. Broker links are affiliate links — we may earn a commission at no cost to you.
Free MT4 Indicator Download

Enter Your Email Address below, download link will be sent to you.