

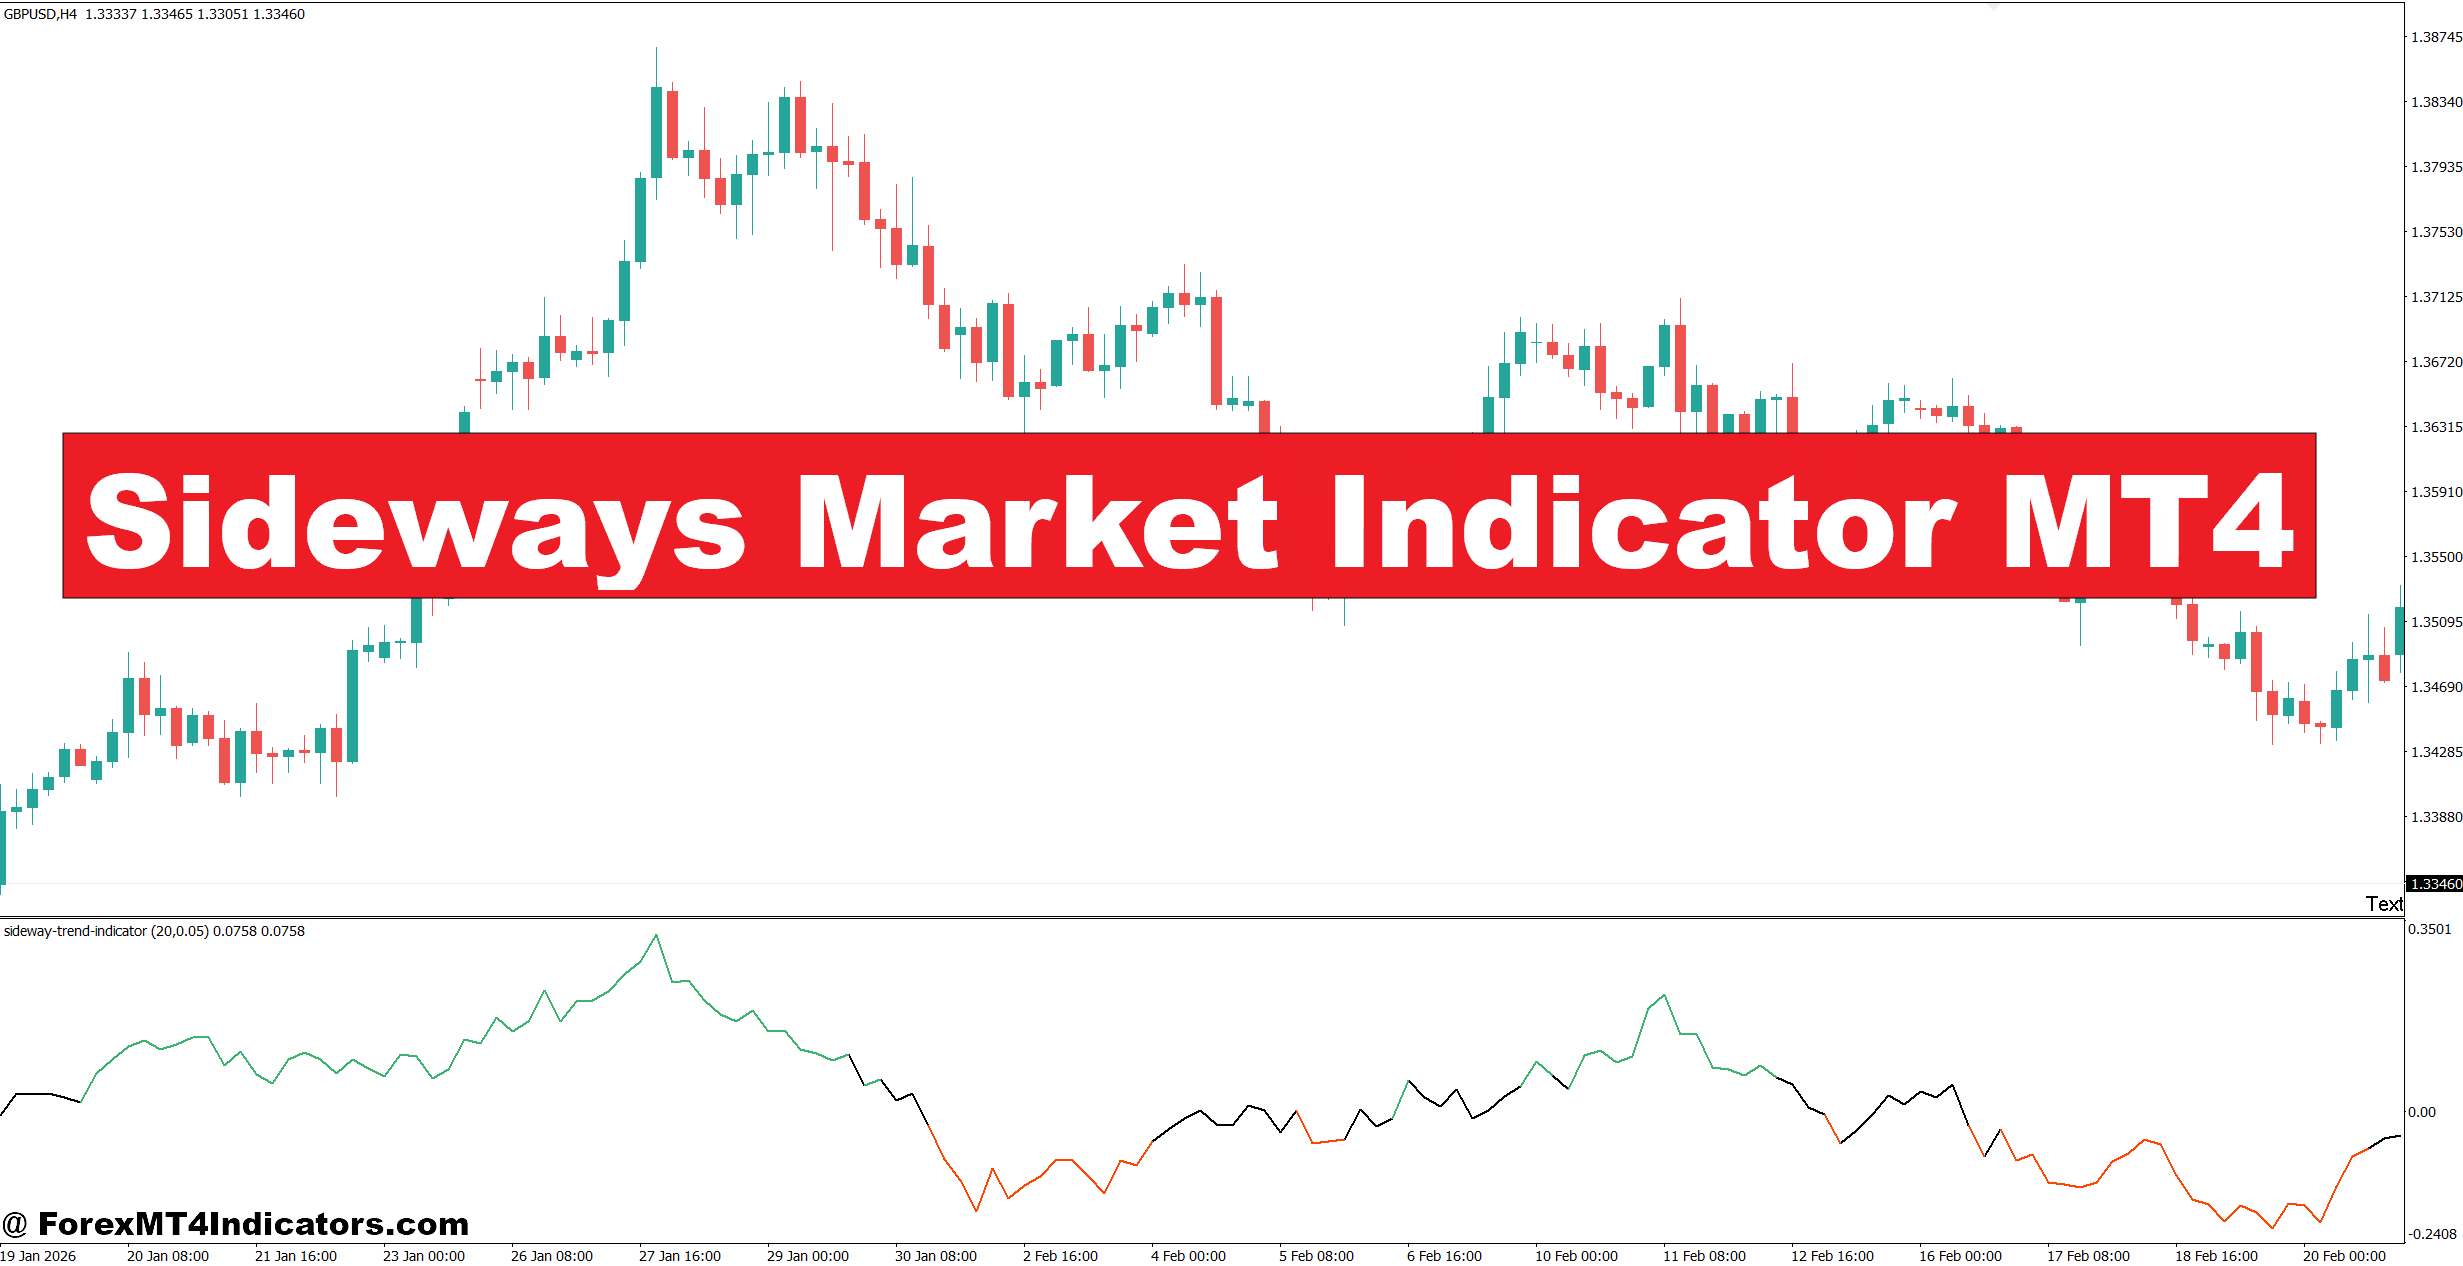
The Sideways Market Indicator MT4 is a technical analysis tool designed to highlight periods when the market is moving within a relatively narrow range rather than forming a sustained bullish or bearish trend.
The exact calculation can differ between versions of the indicator. Many sideways-market tools examine factors such as recent price range, candle movement, volatility, moving-average behavior, or the distance between recent highs and lows. Some versions may also use ATR-style volatility measurements to determine whether current movement is strong enough to qualify as a trend.
The basic idea is straightforward: when price movement remains compressed and directional strength is weak, the indicator identifies the condition as sideways or ranging.
For example, suppose EUR/USD on the 1-hour chart trades between 1.0920 and 1.0955 for several sessions. The total range is only 35 pips, while the pair repeatedly rejects both boundaries. A trader using a trend-following system might receive several signals during this period. A sideways market filter can warn that the environment isn’t ideal for those entries.
The indicator should therefore be viewed as a market-condition tool, not a standalone buy or sell system.
How Traders Can Use It in Real Market Conditions
The strongest use case is filtering trades before an entry is taken. A trader first checks whether the market is trending or ranging, then selects a strategy that fits the condition.
Example: EUR/USD on the 1-Hour Chart
Imagine EUR/USD is trading around 1.0865 after several hours of movement between 1.0845 and 1.0880. The indicator shows sideways conditions, while the 20 EMA and 50 EMA remain relatively flat.
Instead of buying simply because price moves 10 pips higher, the trader waits for price to approach the range boundary. A move toward 1.0880 followed by a bearish rejection may offer a short-term range setup, with a stop placed above the recent swing high.
The opposite approach applies near 1.0845. If price tests support and produces a clear bullish rejection, a range trader may look for a move back toward the middle or upper part of the range.
But traders should not assume every sideways market will respect support and resistance. A breakout can happen at any time.
Example: GBP/USD During a Quiet Session
Suppose GBP/USD on the 30-minute chart remains between 1.2710 and 1.2740 during a low-volatility session. The sideways reading remains active, and average candle size stays small.
A trader may avoid chasing a 12-pip breakout in the middle of the range. Instead, the trader waits for either a confirmed break with stronger momentum or a rejection from one of the established boundaries.
This simple filter can reduce trades taken in the worst part of a range: the middle.
Settings and Timeframe Considerations
There is no universal setting that works equally well on every pair and timeframe. Traders should test the indicator on historical data before relying on it with real money.
On a 5-minute or 15-minute chart, a shorter sensitivity setting may help identify small periods of consolidation. However, it can also produce more frequent changes between sideways and trending conditions.
On the 1-hour chart, traders can generally use a broader lookback because the market needs more movement before a meaningful change in structure develops. A setting equivalent to 14 or 20 periods can be a reasonable starting point for testing, depending on how the particular indicator calculates its reading.
For higher timeframes such as H4, traders may prefer slower settings to avoid reacting to minor price fluctuations.
Pair behavior matters too. GBP/JPY can produce much larger intraday ranges than EUR/USD, so a fixed range threshold may behave differently on each pair.
A practical approach is to compare the indicator against recent price behavior. If it labels a 60-pip movement on GBP/JPY as sideways, the trader should question whether the selected sensitivity fits that pair.
Advantages, Limitations, and Comparison With Other Tools
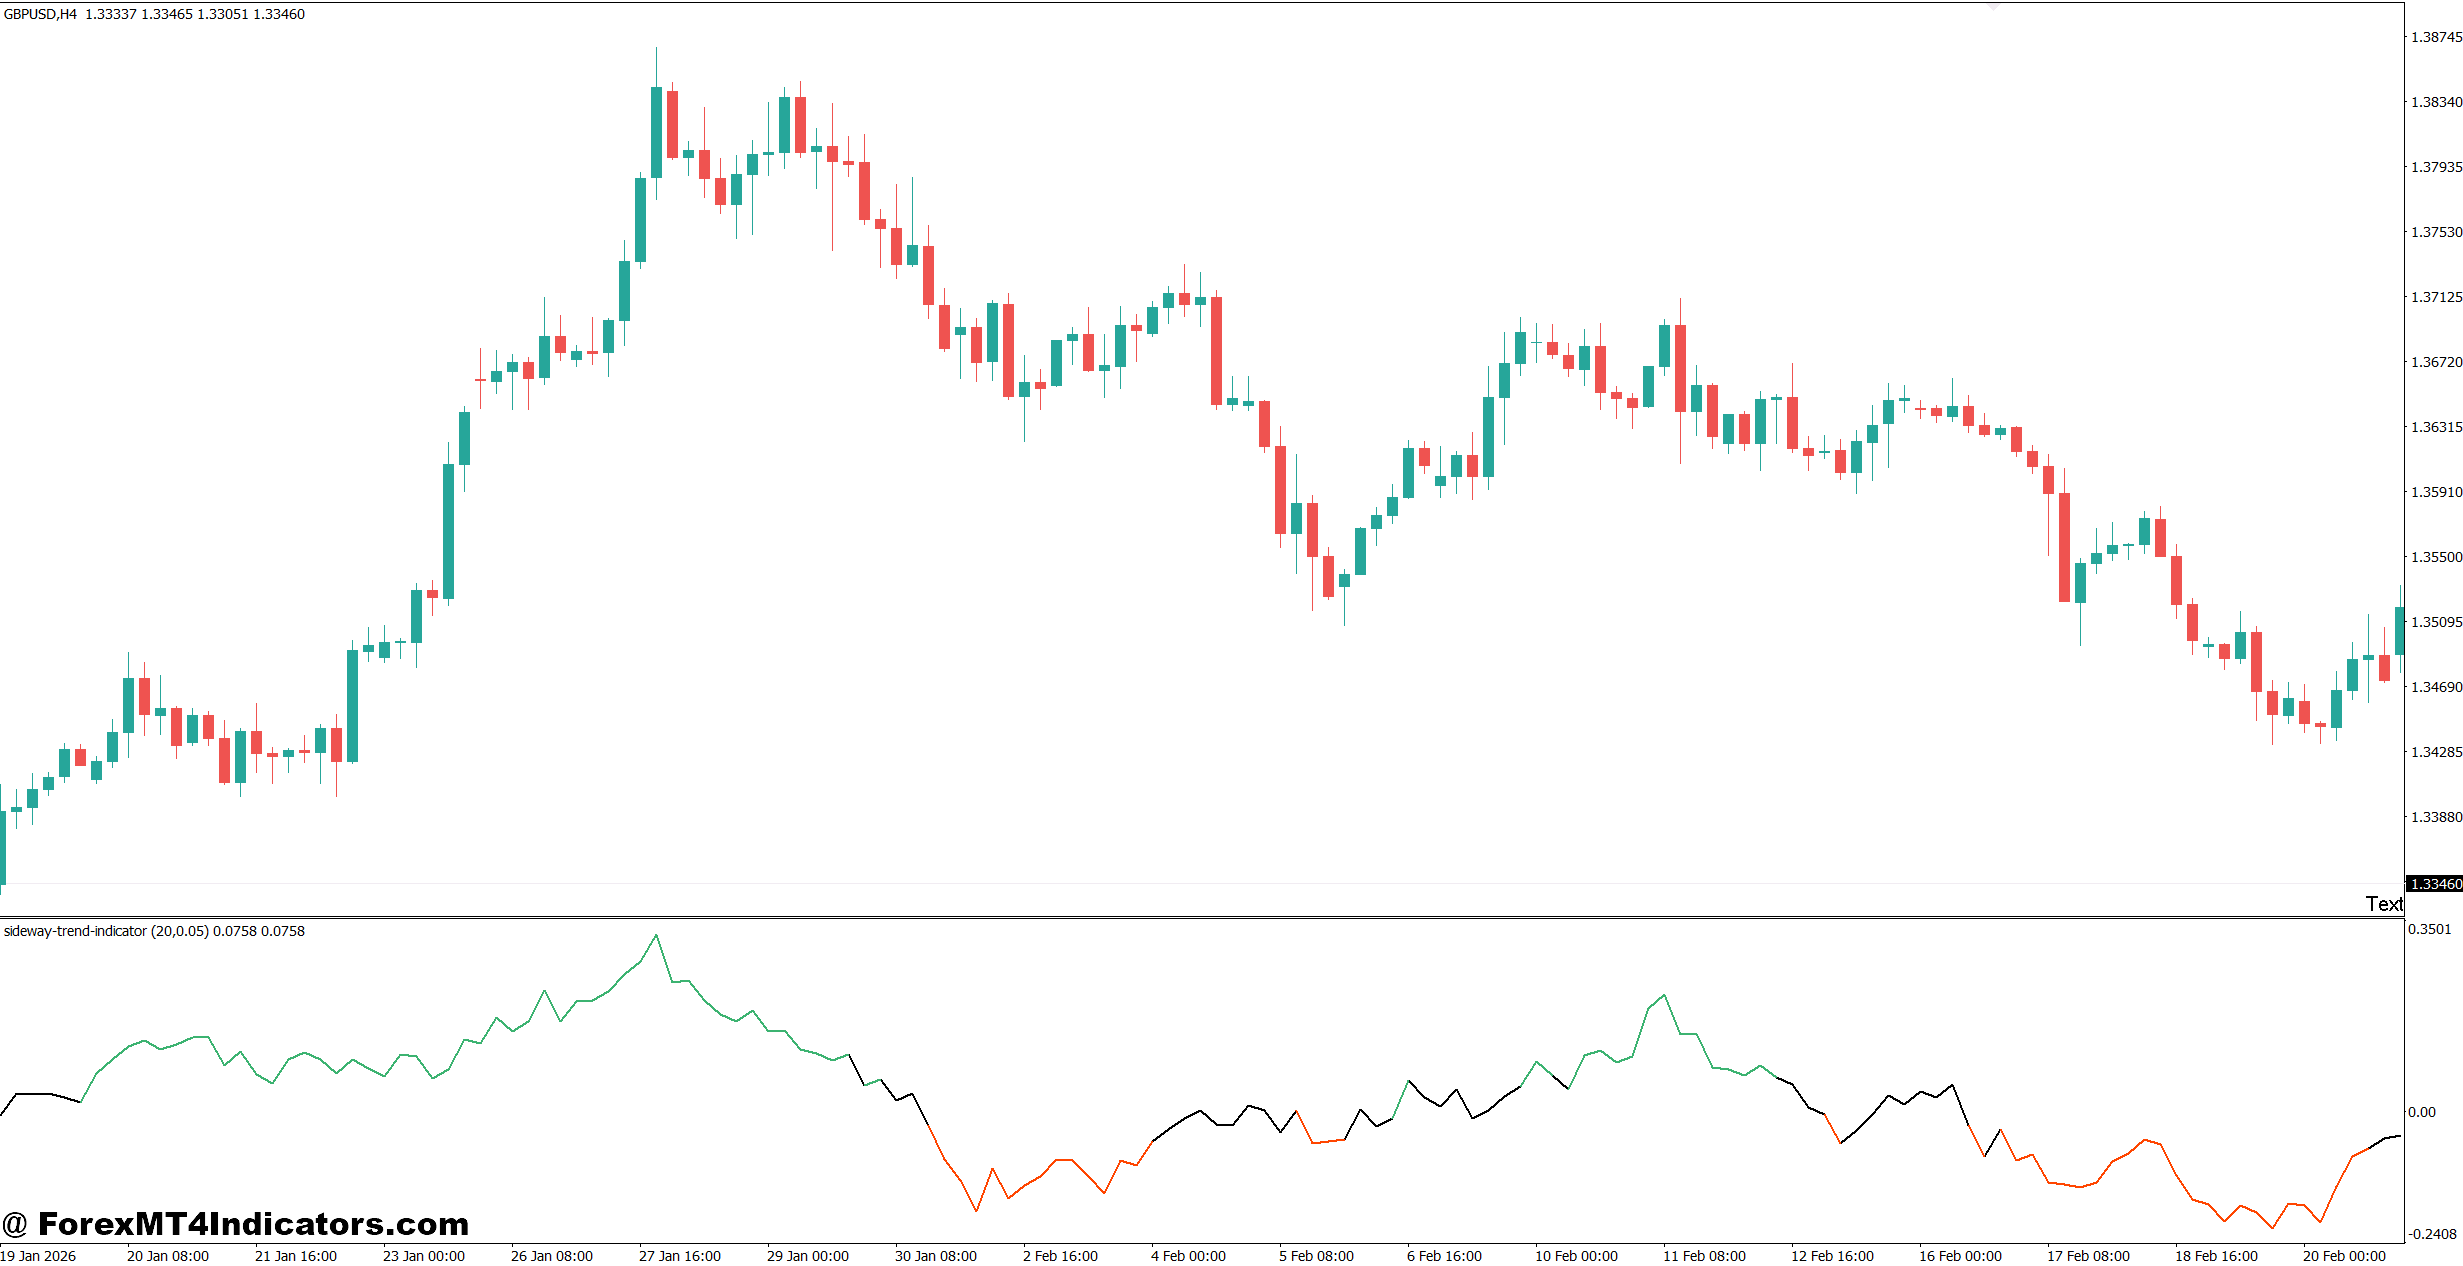
One major advantage is simplicity. The indicator can help traders answer a basic question before entering: Is the market actually moving with enough direction to justify a trend trade?
It can also work well alongside support and resistance. When the indicator identifies a range, traders can mark the most recent swing high and swing low and watch how price reacts around those levels.
That said, the indicator has clear limitations. It can lag because market-condition calculations often rely on previous candles. A market may begin breaking out while the indicator still shows sideways conditions. It can also produce false range readings during short pauses inside a larger trend.
This is why confirmation matters.
Compared with the ADX, a sideways market indicator may provide a more direct visual interpretation of consolidation, while ADX measures trend strength rather than direction. ADX readings below roughly 20 are often associated with weaker trend conditions, but the exact interpretation depends on the market and timeframe.
Bollinger Bands offer another useful comparison. When the bands contract, traders can see that volatility has fallen. However, narrow bands alone don’t prove that the market will remain sideways. A breakout can follow a period of compression.
Moving averages provide another layer of confirmation. When the 20 EMA and 50 EMA become flat and price repeatedly crosses them, the market may be losing directional structure.
Experienced traders often combine these signals rather than relying on one indicator. For example, a sideways reading + flat moving averages + clearly defined support and resistance creates a stronger context than the indicator alone.
Risk management remains essential. A range breakout can develop quickly, especially around major economic releases such as NFP, CPI, or central-bank decisions. When testing this type of indicator on volatile NFP days, traders should expect range conditions to disappear rapidly.
Trading forex carries substantial risk. No indicator guarantees profits. The Sideways Market Indicator MT4 should be tested with historical data, demo trading, and sensible position sizing before being used with significant capital.
How to Trade with Sideways Market Indicator MT4
Buy Entry
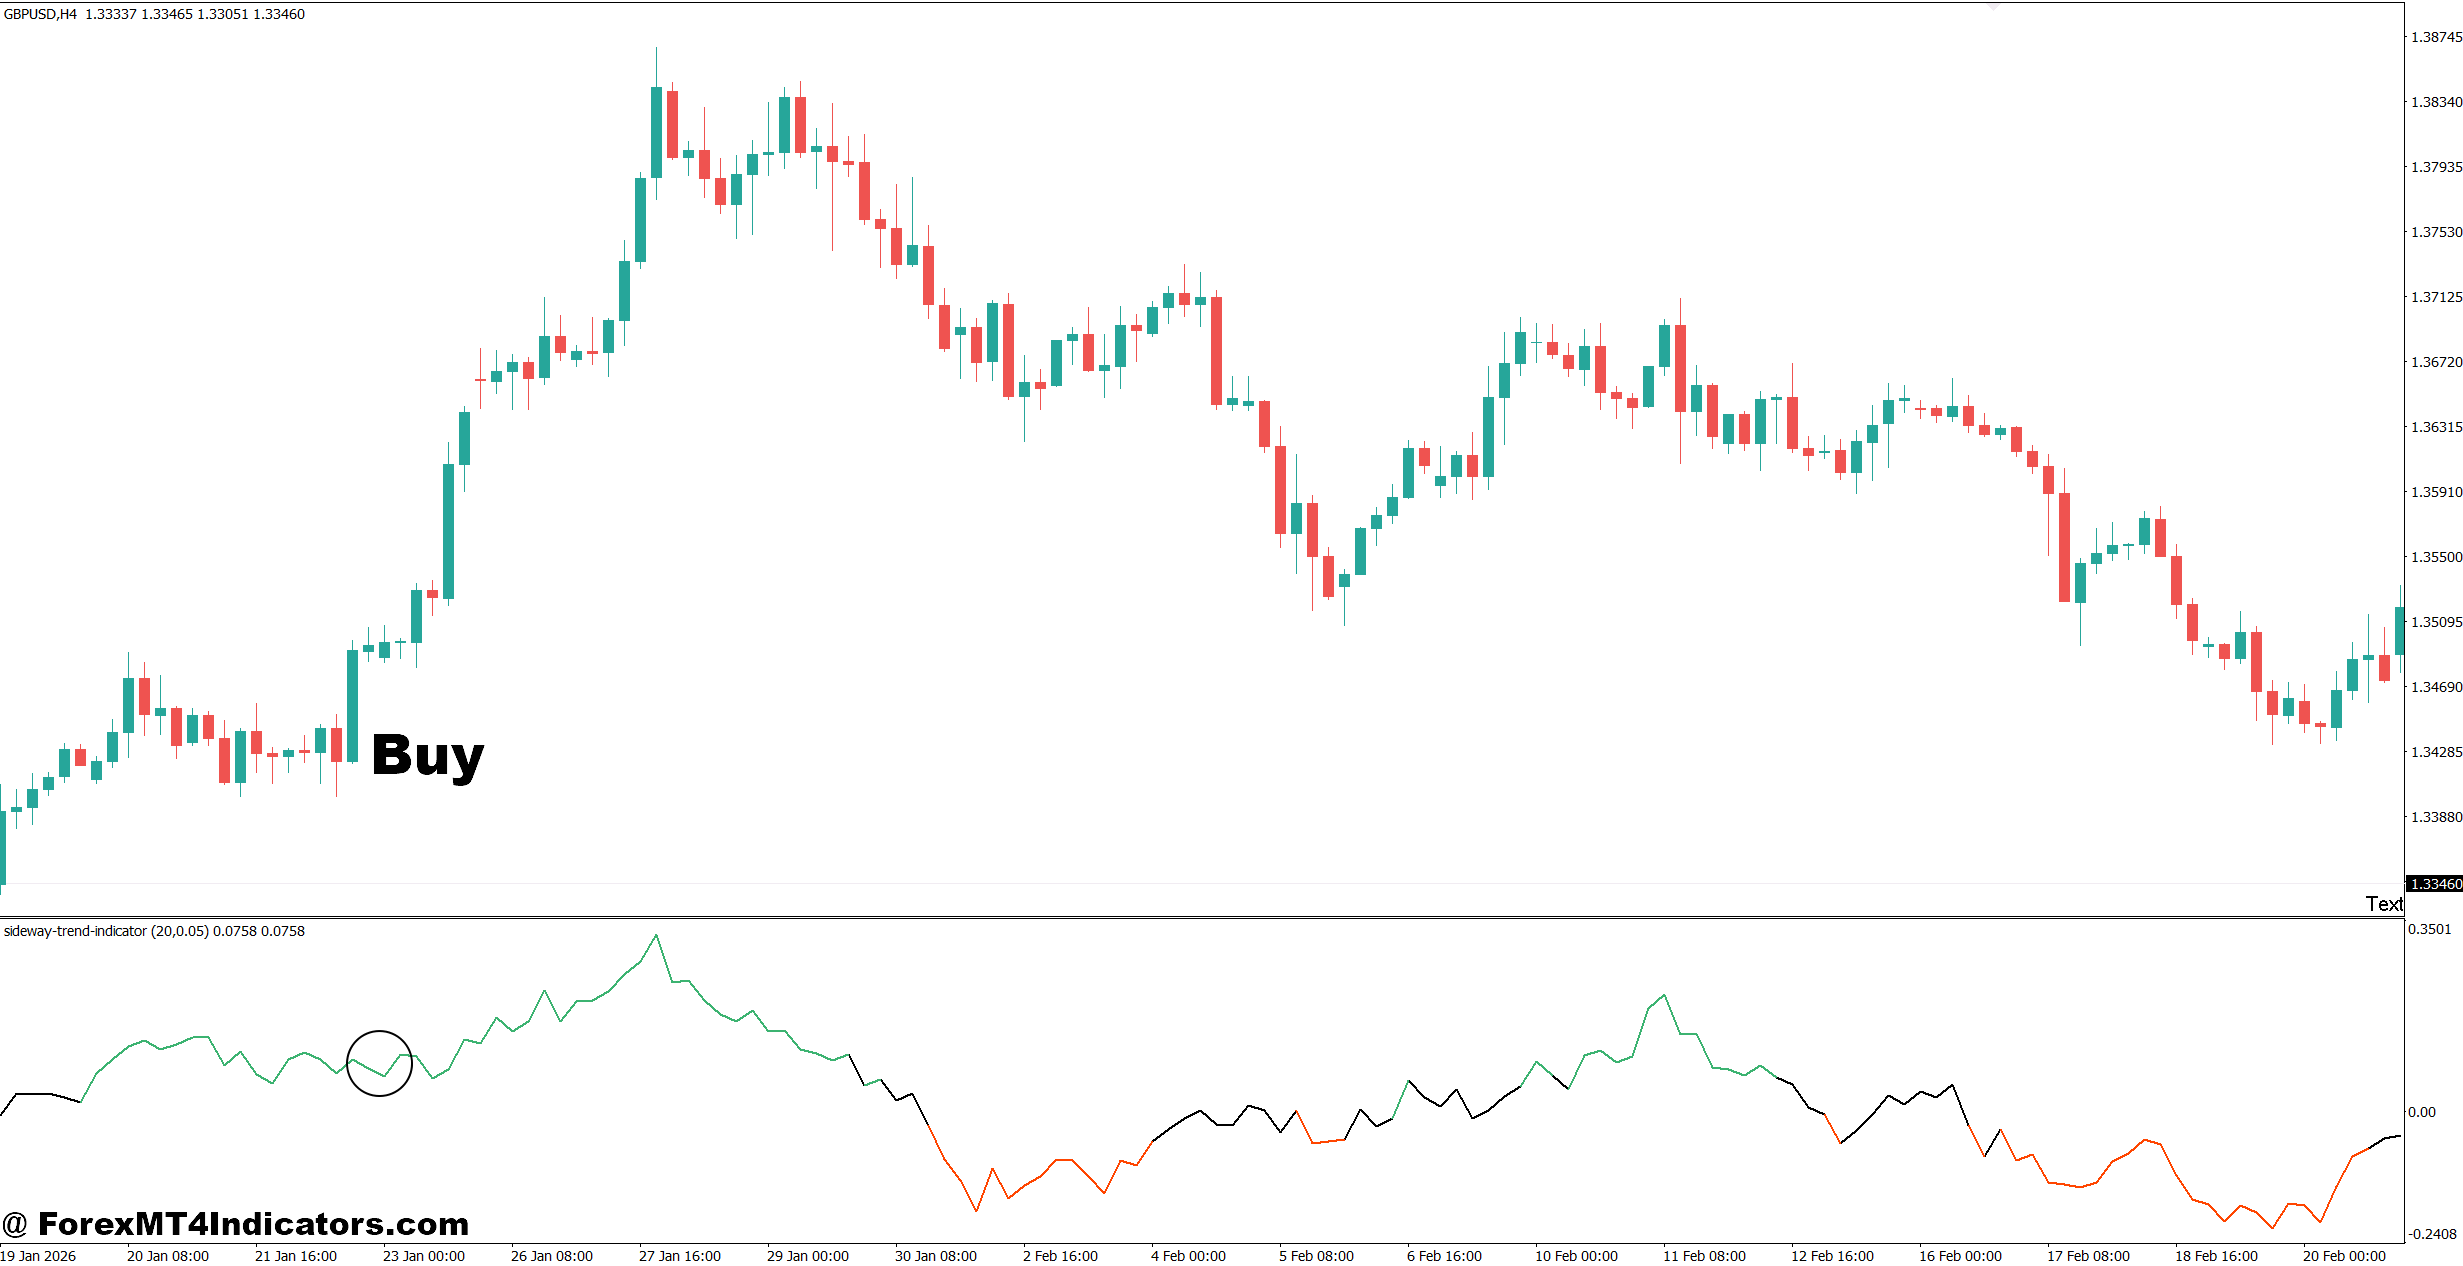
- Wait for support rejection – Buy EUR/USD on the 1-hour chart after a clear bullish rejection near range support, ideally within 5–15 pips of the level.
- Confirm the sideways reading – Take a buy only when the indicator still shows ranging conditions and price holds support for at least 2 candles.
- Look for a bullish candle – Enter after a bullish engulfing or strong rejection candle closes, with the next candle confirming upward movement.
- Target the range midpoint – Aim for 15–30 pips on EUR/USD when buying from support, or target the opposite range boundary if volatility allows.
- Keep the stop controlled – Place the stop 10–20 pips below support, depending on the pair and recent swing structure.
- Check higher timeframe structure – On the 4-hour chart, avoid buys if price is strongly bearish and has broken major support.
- Reduce risk during uncertainty – Risk around 0.5%–1% of account equity per trade when the market remains choppy.
- Avoid buying the middle – Do not enter GBP/USD simply because price rises inside the range; wait for support or a confirmed breakout.
Sell Entry
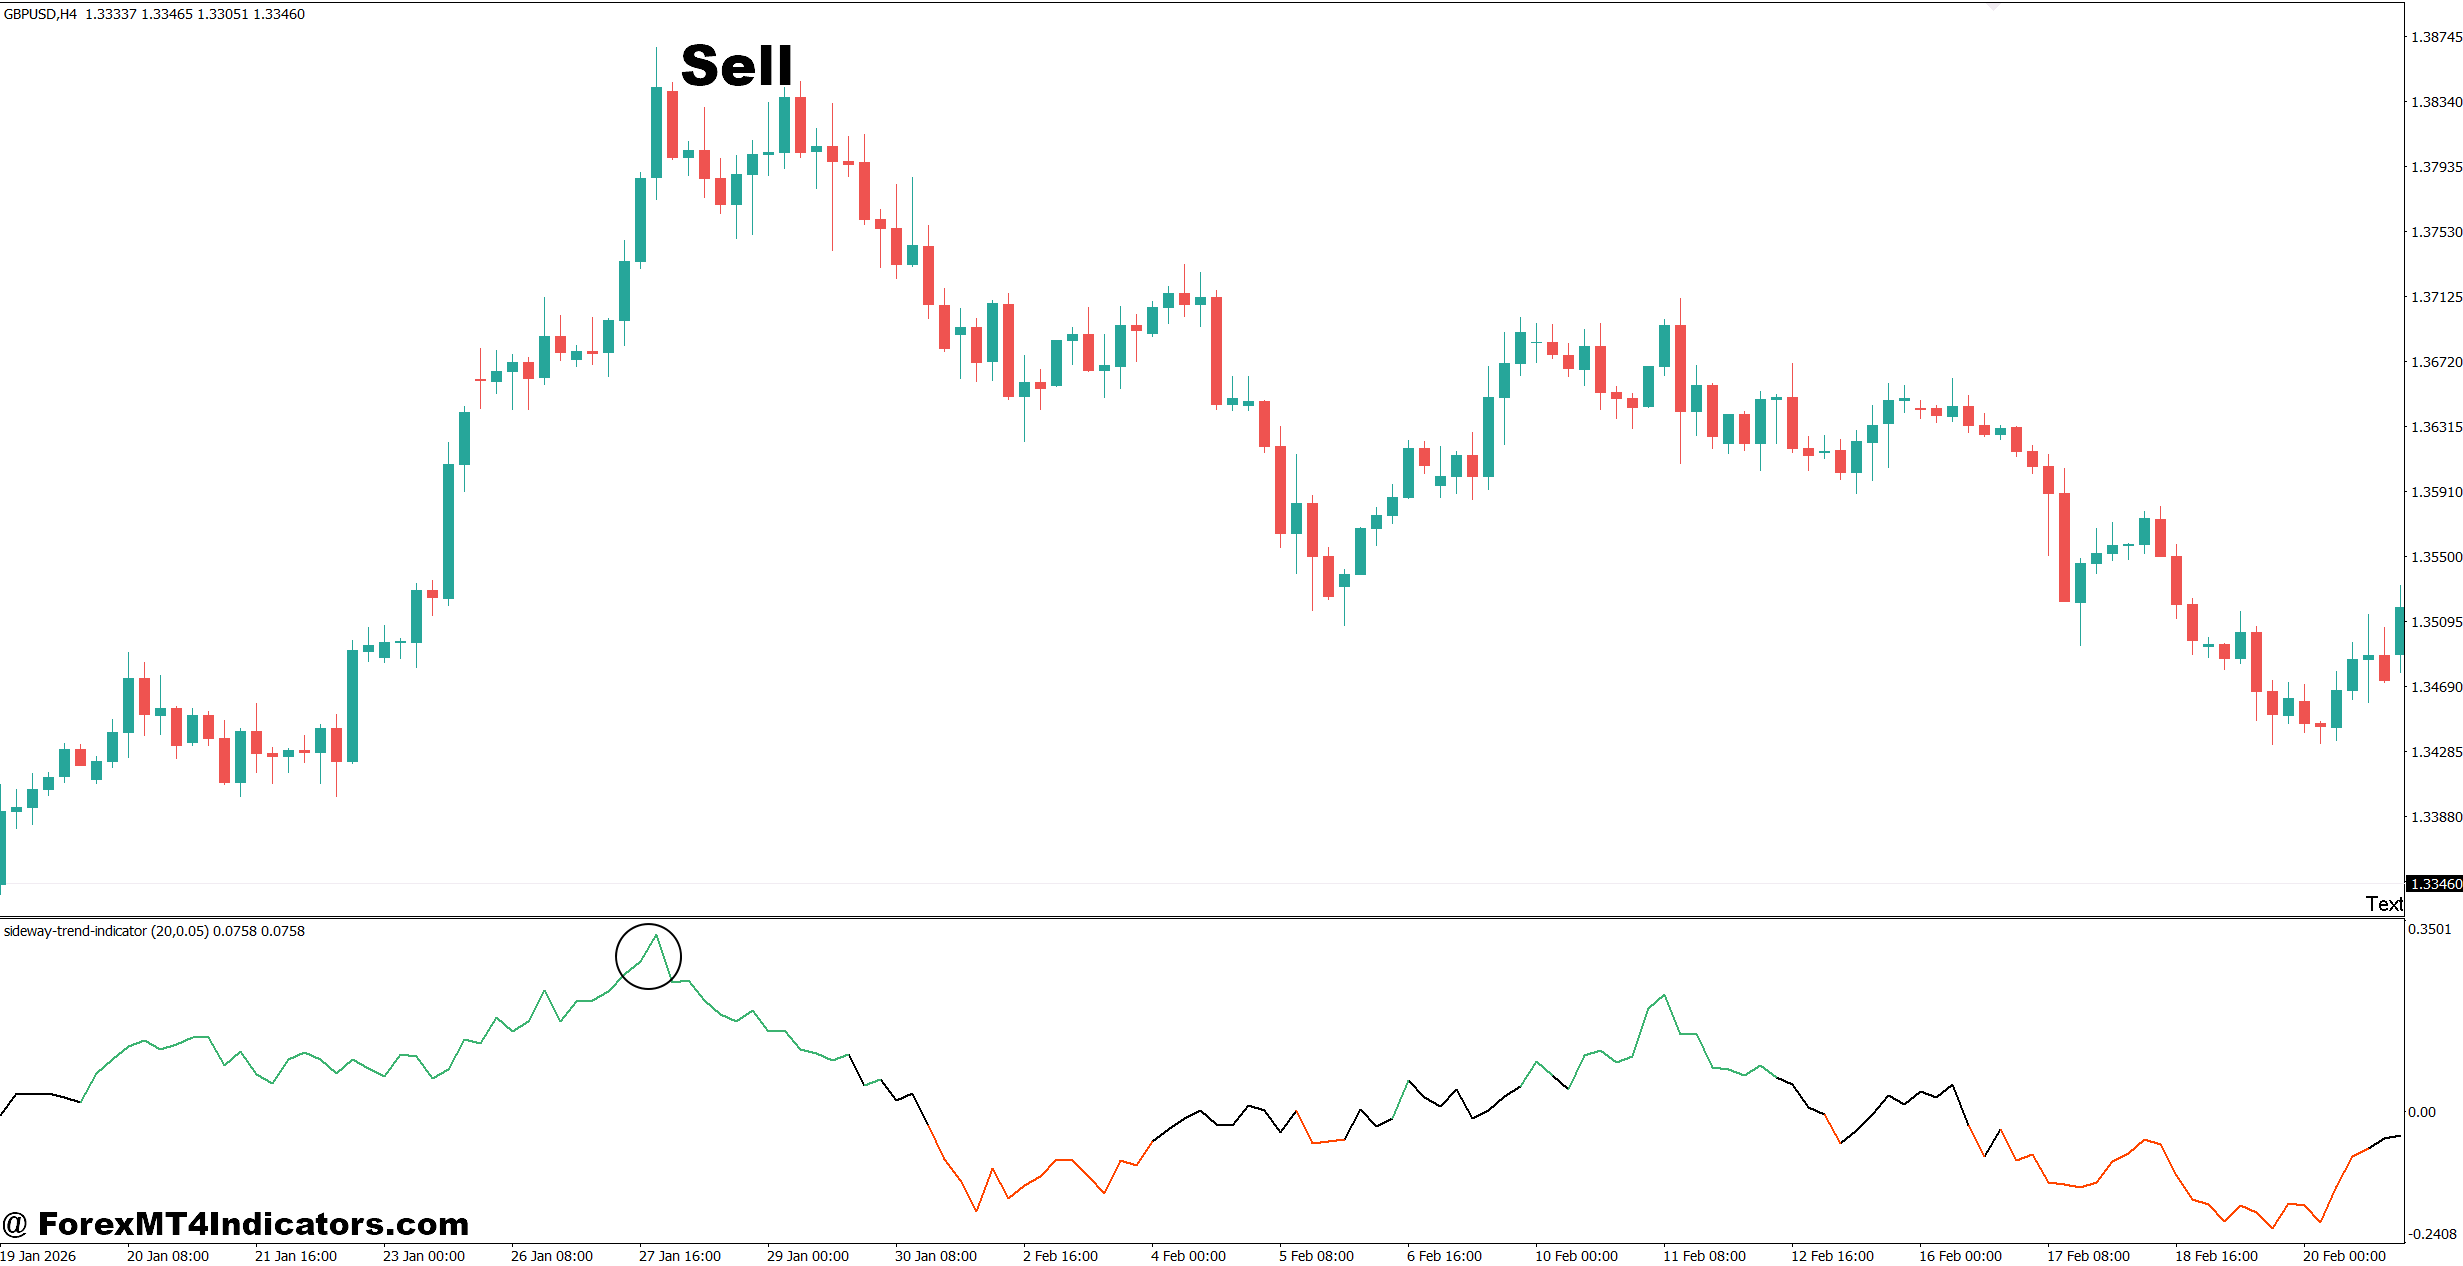
- Wait for resistance rejection – Sell GBP/USD on the 1-hour chart after price rejects resistance within roughly 5–15 pips.
- Confirm range conditions – Take the short only when the indicator continues showing sideways movement and resistance remains intact.
- Use bearish confirmation – Enter after a bearish engulfing candle or strong rejection candle closes near the range high.
- Set a realistic target – Look for 15–30 pips toward the range midpoint or lower boundary, depending on available space.
- Place the stop above resistance – Keep the stop around 10–20 pips above the recent swing high rather than using an arbitrary distance.
- Check the daily chart – Avoid aggressive sells if the daily trend is strongly bullish and price is sitting above major support.
- Limit position risk – Keep risk near 0.5%–1% per trade because sideways markets can produce sudden breakouts.
- Skip breakout traps – Do not sell EUR/USD after a strong 4-hour candle closes above resistance; wait for confirmation before considering a short.
Final Thoughts on the Sideways Market Indicator MT4
The Sideways Market Indicator MT4 is most useful when traders treat it as a filter rather than a magic signal generator.
- It can help identify consolidation before trend-based entries are taken.
- It works well with support, resistance, moving averages, and volatility analysis.
- Settings should be adjusted and tested for different pairs and timeframes.
- Its readings can lag, so traders still need price action and risk management.
The biggest practical benefit is knowing when not to trade a trend setup. A trader who recognizes chop early may avoid several low-quality entries and preserve capital for cleaner market conditions.
The next step is simple: test the indicator on a familiar pair, mark its sideways readings, and compare them with actual price structure. The results will show whether its signals add useful information to the trader’s existing strategy.
Level up your trading
Learn to read the chart — not just the indicator
eBook · Instant PDF
Video Course · 12 modules
Recommended MT4/MT5 Brokers
- ✓ *FREE *$50 to start (withdrawable)
- ✓ Deposit bonus up to $5,000
- ✓ Negative balance protection
Trading forex and CFDs carries a significant risk of loss and is not suitable for everyone. Broker links are affiliate links — we may earn a commission at no cost to you.
Free MT4 Indicator Download

Enter Your Email Address below, download link will be sent to you.