

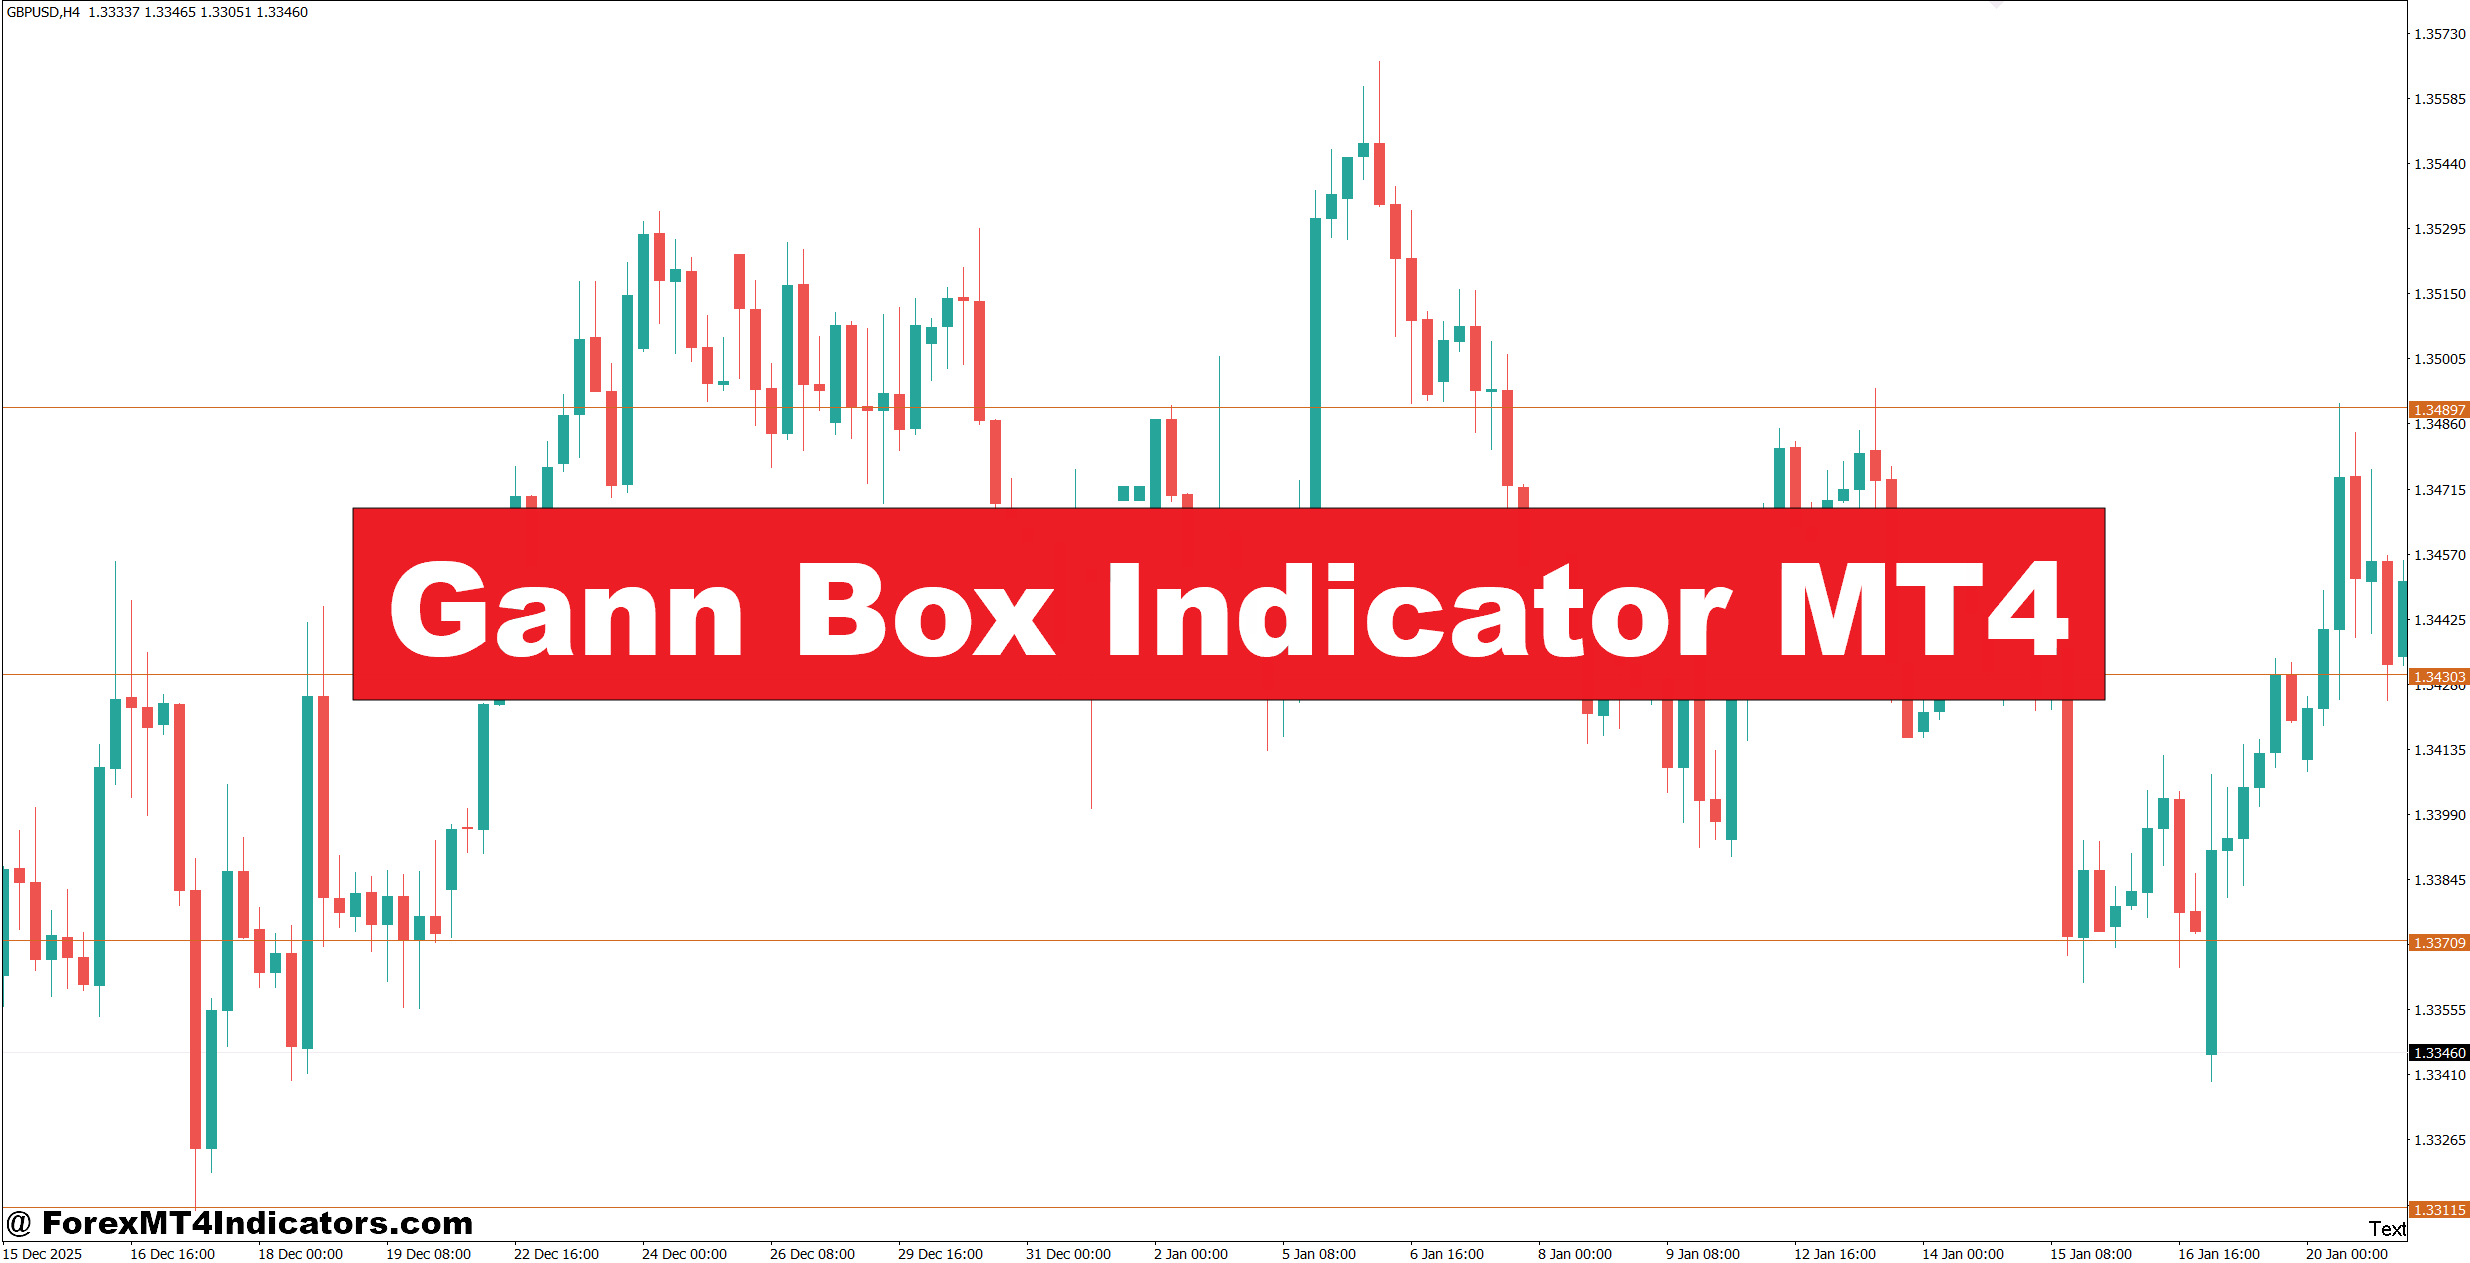
The Gann Box Indicator MT4 helps traders organize price and time into a visual framework. Instead of watching random horizontal levels, traders can study projected price zones, time divisions, and possible reaction areas on the MT4 chart. That can make entry planning more structured.
The problem is that Gann-based analysis can look confusing at first. Traders may draw too many levels, trade every reaction, or assume that a projected line will automatically hold. That approach can lead to whipsaws and unnecessary drawdown.
In practice, the indicator works best as a planning tool rather than a standalone signal generator. Here’s how traders can use it with price action, market structure, and sensible risk control.
What Is the Gann Box Indicator MT4?
The Gann Box Indicator MT4 is a technical analysis tool based on W.D. Gann’s approach to studying the relationship between price and time. It divides a selected chart area into measured sections, creating reference points that can help traders assess potential support, resistance, trend direction, and timing.
The exact calculation depends on the specific MT4 version. Most Gann Box tools use a chosen starting point, price range, and time range to create a grid or series of projected levels. The indicator then extends those relationships across the chart.
This matters because Gann analysis does not focus on price alone. A level may become more useful when price reaches it after a meaningful amount of time. Traders can therefore examine both dimensions instead of treating every horizontal line as ordinary support or resistance.
For example, suppose EUR/USD is trading at 1.0850 on the 1-hour chart. A trader identifies a major swing low around 1.0800 and applies the Gann Box across a 200-pip price range and roughly 40 hourly candles. If price later approaches a projected zone around 1.0900, the trader can watch for rejection, consolidation, or a breakout rather than entering blindly.
How Traders Use Gann Box Levels in Real Markets
The strongest use of the indicator is usually confirmation.
Imagine GBP/USD is in an uptrend on the 4-hour chart. Price makes a higher high at 1.2800 and pulls back toward a Gann Box support area near 1.2700. Instead of buying simply because price touched the level, the trader waits for a bullish candle, a higher low, or a break above a nearby intraday swing.
If confirmation appears, a buy entry might be placed around 1.2720 with a stop near 1.2680. That creates approximately 40 pips of initial risk. A target near 1.2800 would offer around 80 pips, giving the setup a 1:2 risk-to-reward ratio.
The same idea works on the short side. Suppose EUR/USD reaches a Gann resistance area around 1.0950 after several strong bullish candles. If the next H1 candle forms a bearish rejection and breaks below 1.0925, a trader could consider a short around 1.0920, with a stop near 1.0960 and an initial target around 1.0840.
The level itself isn’t the trade. The reaction around that level is what matters.
Combining the Box With Market Structure
Gann levels become more useful when they agree with ordinary price structure.
A trader can look for:
- Previous swing highs and lows
- Breaks of market structure
- Trendline reactions
- Strong rejection candles
- Consolidation before a breakout
- RSI or MACD confirmation
- Higher-timeframe support and resistance
For example, if a Gann support level sits within 10–15 pips of a previous H4 swing low, that area deserves more attention than an isolated Gann line in the middle of nowhere.
During volatile events such as NFP, spreads and price movement can expand sharply. A level that normally holds within 10 pips may be pushed 30 or 40 pips before the market chooses a direction. Traders should avoid assuming that a mathematical level will stop price precisely.
Gann Box Settings for Different Timeframes
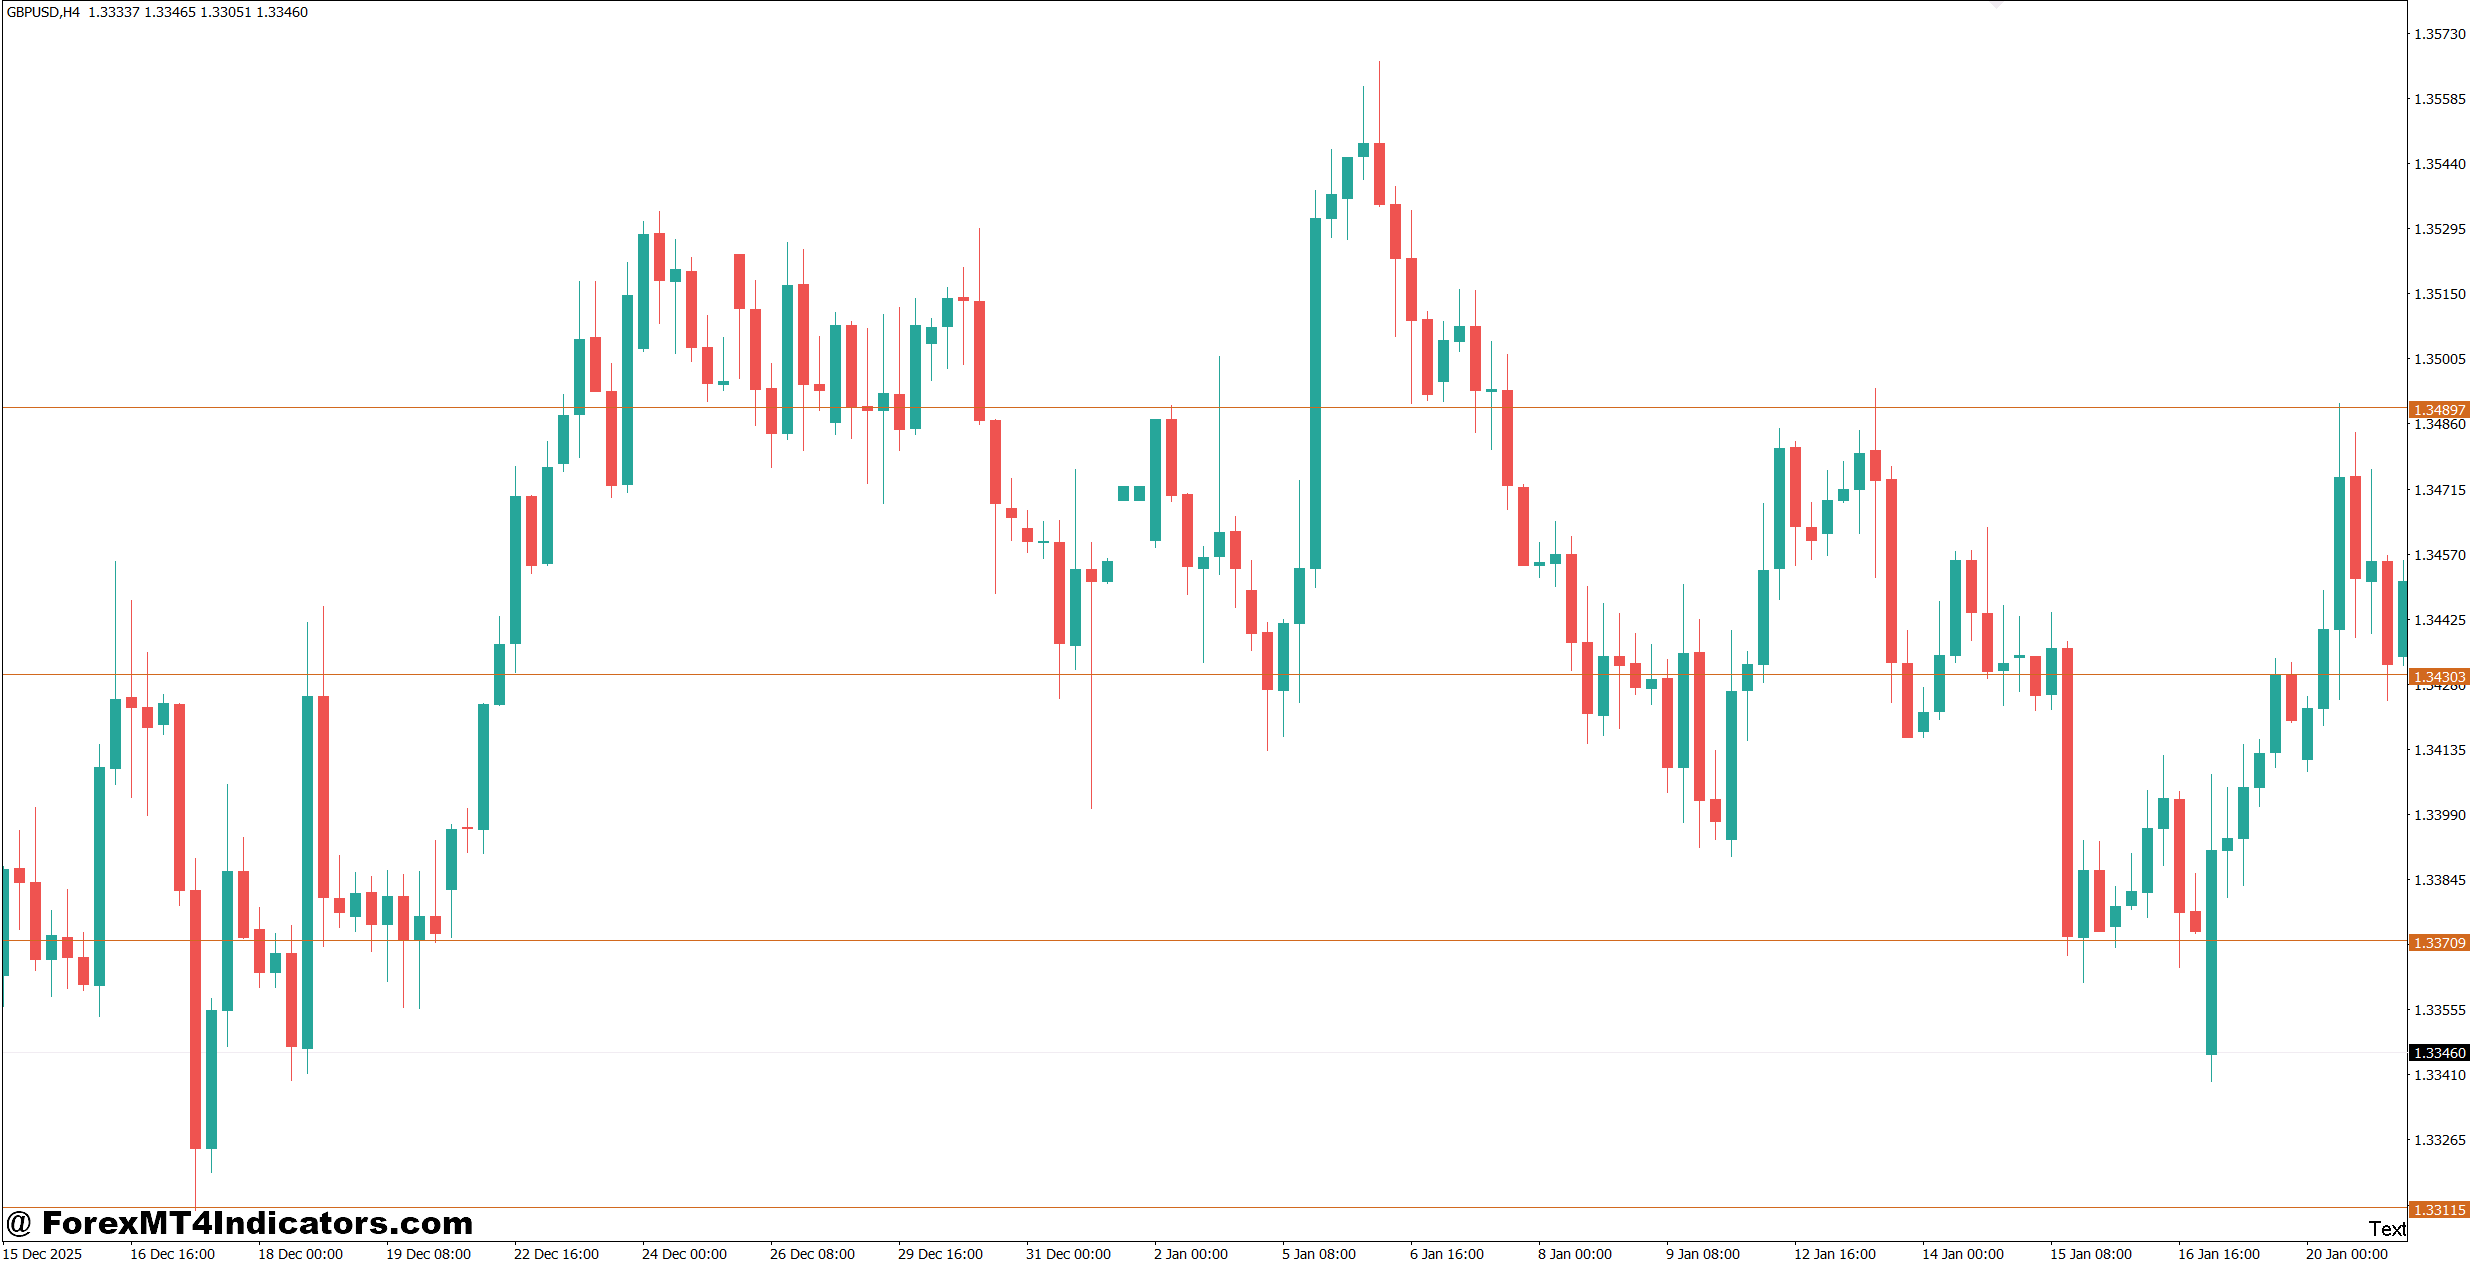
There isn’t one perfect setting for every currency pair. The starting point and range should reflect the market being analyzed.
On the M15 chart, traders may use a recent swing covering 100–300 pips and around 30–80 candles. This can help with intraday planning, but lower-timeframe signals produce more noise.
On the H1 chart, a 300–600 pip price range with 50–150 candles can provide a broader structure for major forex pairs. EUR/USD and USD/JPY often provide cleaner readings when the box begins from a clear swing point.
On the H4 chart, traders can work with major weekly or multi-day swings. A 500–1,000 pip range may be reasonable for some volatile pairs, although the correct scale depends heavily on the instrument.
Gold requires extra caution. XAU/USD can move $20, $30, or more during major economic events. A box that works reasonably on EUR/USD may be poorly scaled for gold.
One practical approach is to begin with a clear swing high or low, then adjust the box until the major divisions align with meaningful historical price reactions. Traders should avoid constantly moving the box simply to make past trades look better. That creates hindsight bias.
Advantages and Limitations of the Gann Box
The biggest advantage is structure. Traders can see potential price and time relationships without relying entirely on subjective drawing.
It can also help with trade planning. A trader who knows a potential resistance zone is 60 pips above the current price can calculate the stop-loss and target before entering. That encourages better risk management.
But the indicator has limitations.
Different Gann Box versions can calculate and display levels differently. Some require manual positioning, while others automatically identify swings. Two traders may therefore produce different boxes from the same chart.
Another issue is false precision. A line at 1.0875 doesn’t mean price must reverse at exactly 1.0875. Forex markets are driven by orders, liquidity, economic data, and changing sentiment. Price can overshoot a level before reversing.
For that reason, a Gann Box should not replace fundamental awareness or normal technical analysis. It is better treated as a framework for identifying areas where traders should pay attention.
Gann Box vs. Fibonacci and Standard Support/Resistance
Gann Box analysis differs from common Fibonacci retracement because it considers price and time together. Fibonacci tools mainly measure proportional price retracements, such as 38.2%, 50%, and 61.8%.
Standard support and resistance is simpler. Traders mark areas where price previously reacted strongly. This method is easy to understand, but it doesn’t inherently provide the same price-time grid.
A practical trader can combine all three.
For example, suppose USD/JPY pulls back into a 61.8% Fibonacci retracement near 147.20. A Gann Box support division sits around 147.15, while a previous H4 swing low is at 147.10. Instead of treating any one level as a guaranteed reversal point, the trader can view 147.10–147.20 as a confluence zone.
If bullish price action appears there, the setup becomes more interesting. If price slices through the zone with strong momentum, the trader stays out or reassesses the market.
That combination is often more useful than searching for a single perfect indicator.
Trading forex carries substantial risk. No indicator guarantees profits. Traders should test Gann Box settings on historical data and a demo account before risking real capital. Risking around 0.5%–1% of account equity per trade can also help limit the damage from a series of losing setups, although the appropriate amount depends on the trader’s circumstances.
How to Trade with Gann Box Indicator MT4
Buy Entry
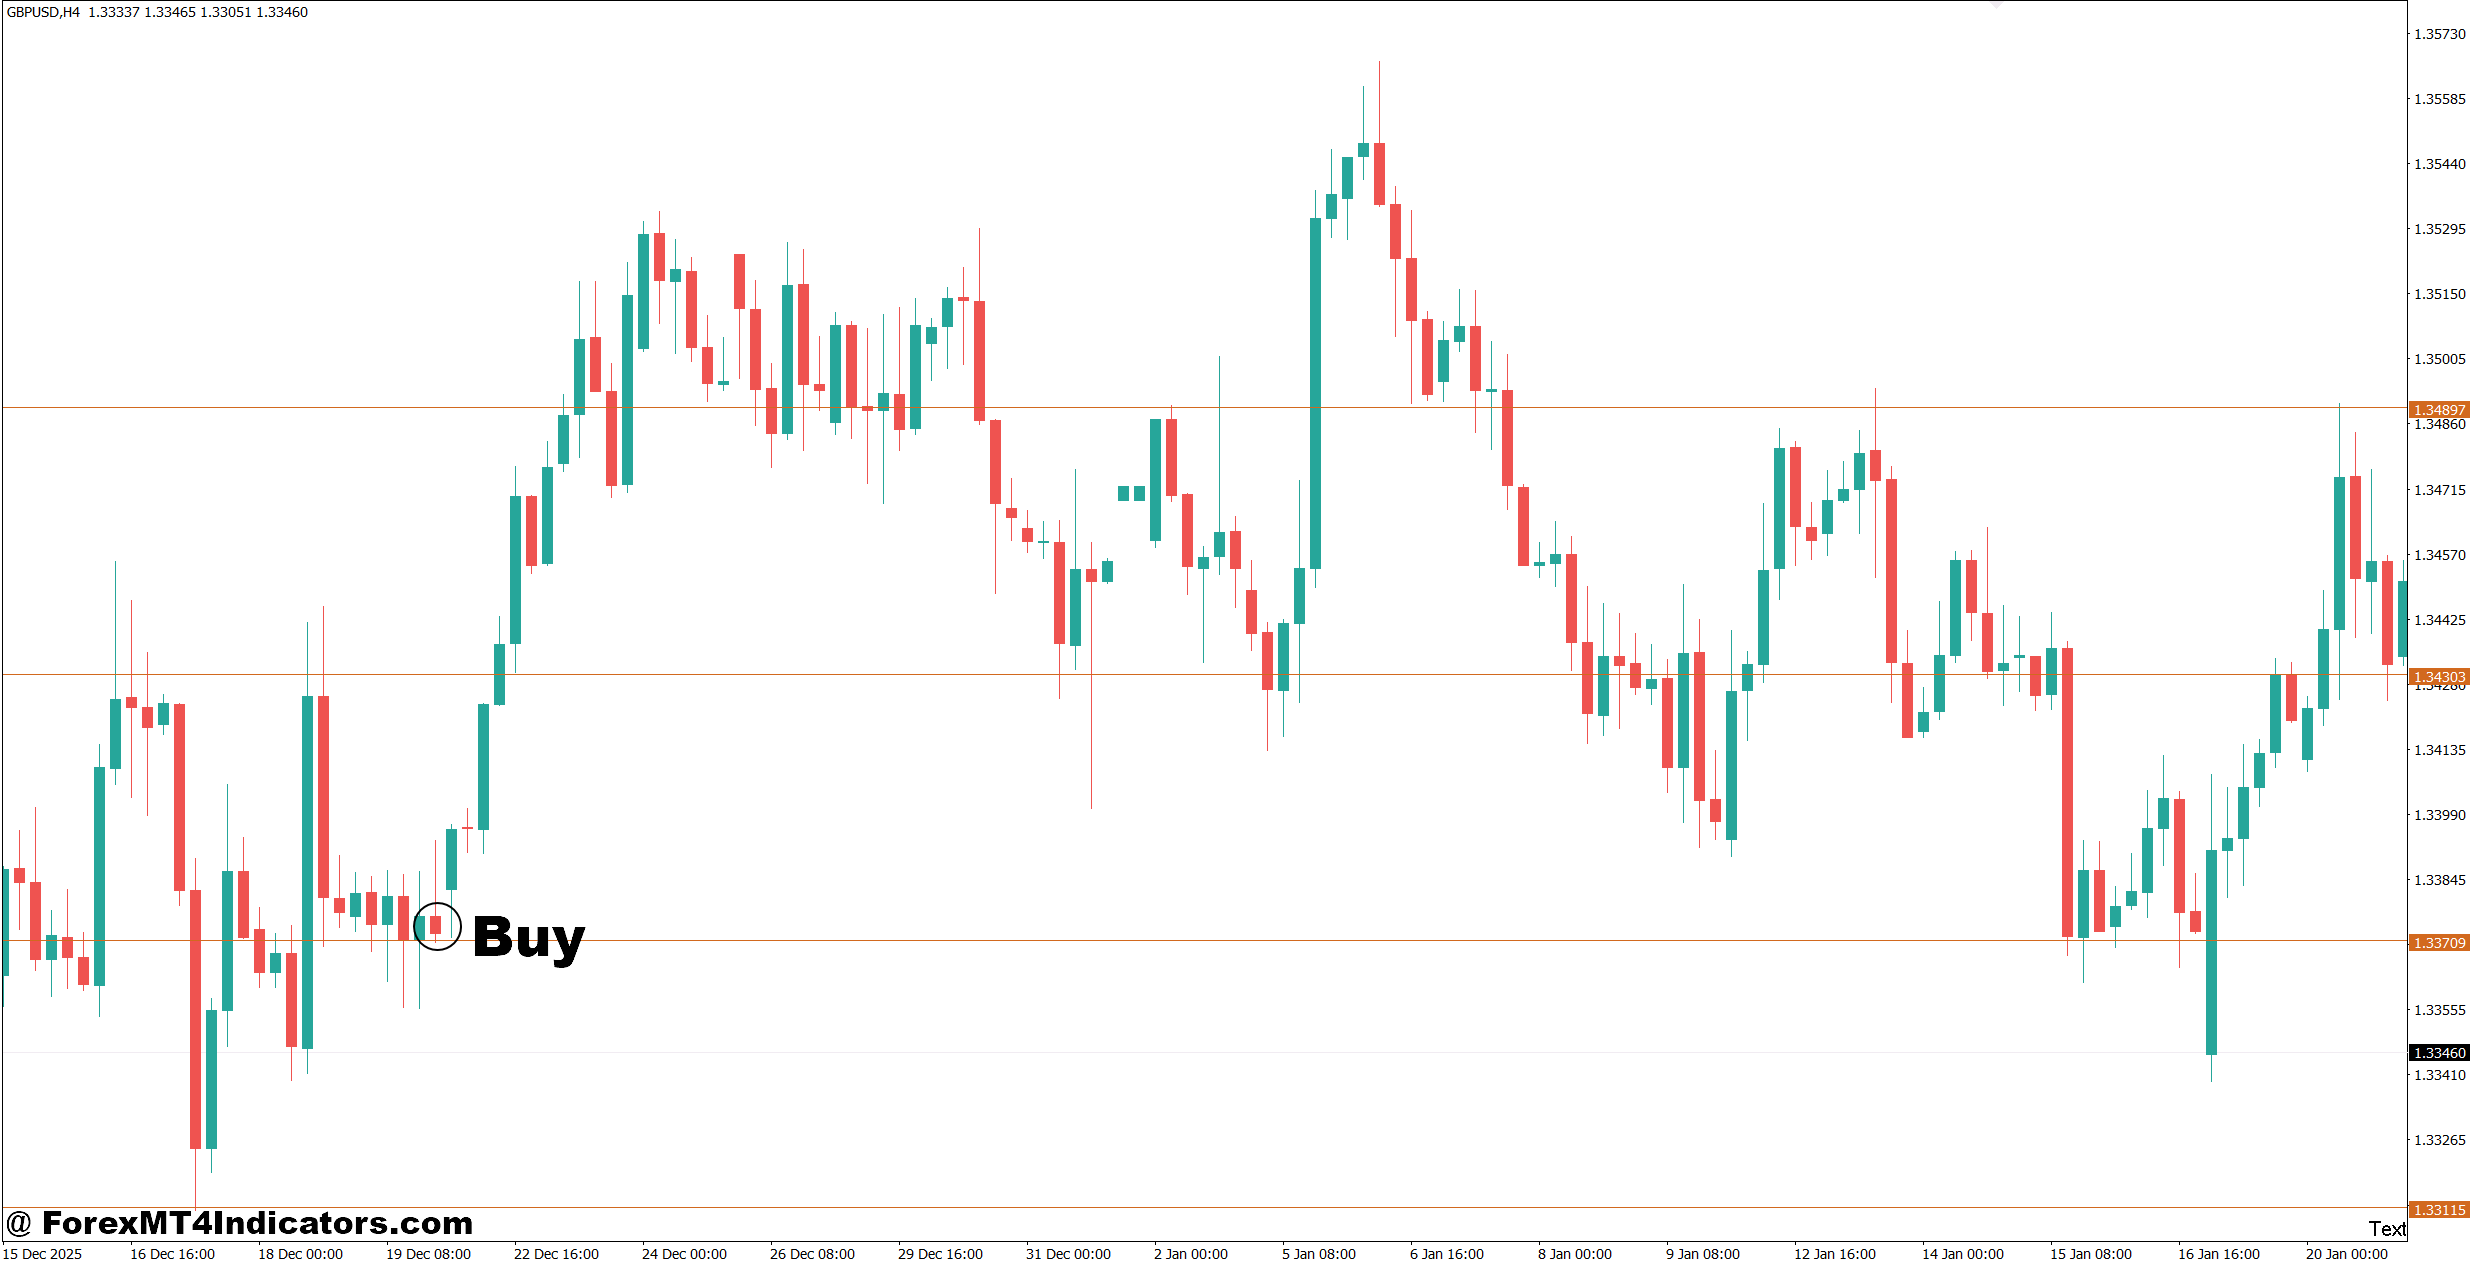
- Buy at Gann support – Enter EUR/USD after a bullish rejection from a Gann support zone on the 1-hour chart, preferably with a 10–20 pip confirmation move.
- Confirm the H1 trend – Take BUY signals when price forms higher highs and higher lows above the Gann midline; avoid buying during clear bearish structure.
- Wait for a breakout – Buy GBP/USD after an H1 candle closes 15–20 pips above a Gann resistance level and the next candle holds above it.
- Use H4 confirmation – On the 4-hour chart, favor BUY setups when price remains above a major Gann support level and momentum stays bullish.
- Check daily direction – Prefer BUY trades when the daily chart shows higher highs and price trades above a major Gann support area.
- Set controlled risk – Place the stop-loss 20–40 pips below the Gann support zone, risking no more than 1% of account equity.
- Target the next level – Aim for the next Gann resistance with at least a 1:2 risk-to-reward ratio; for 30 pips of risk, target 60 pips or more.
- Skip weak setups – Do not BUY when price breaks Gann support by 20–30 pips with strong bearish candles or during extreme news volatility.
Sell Entry
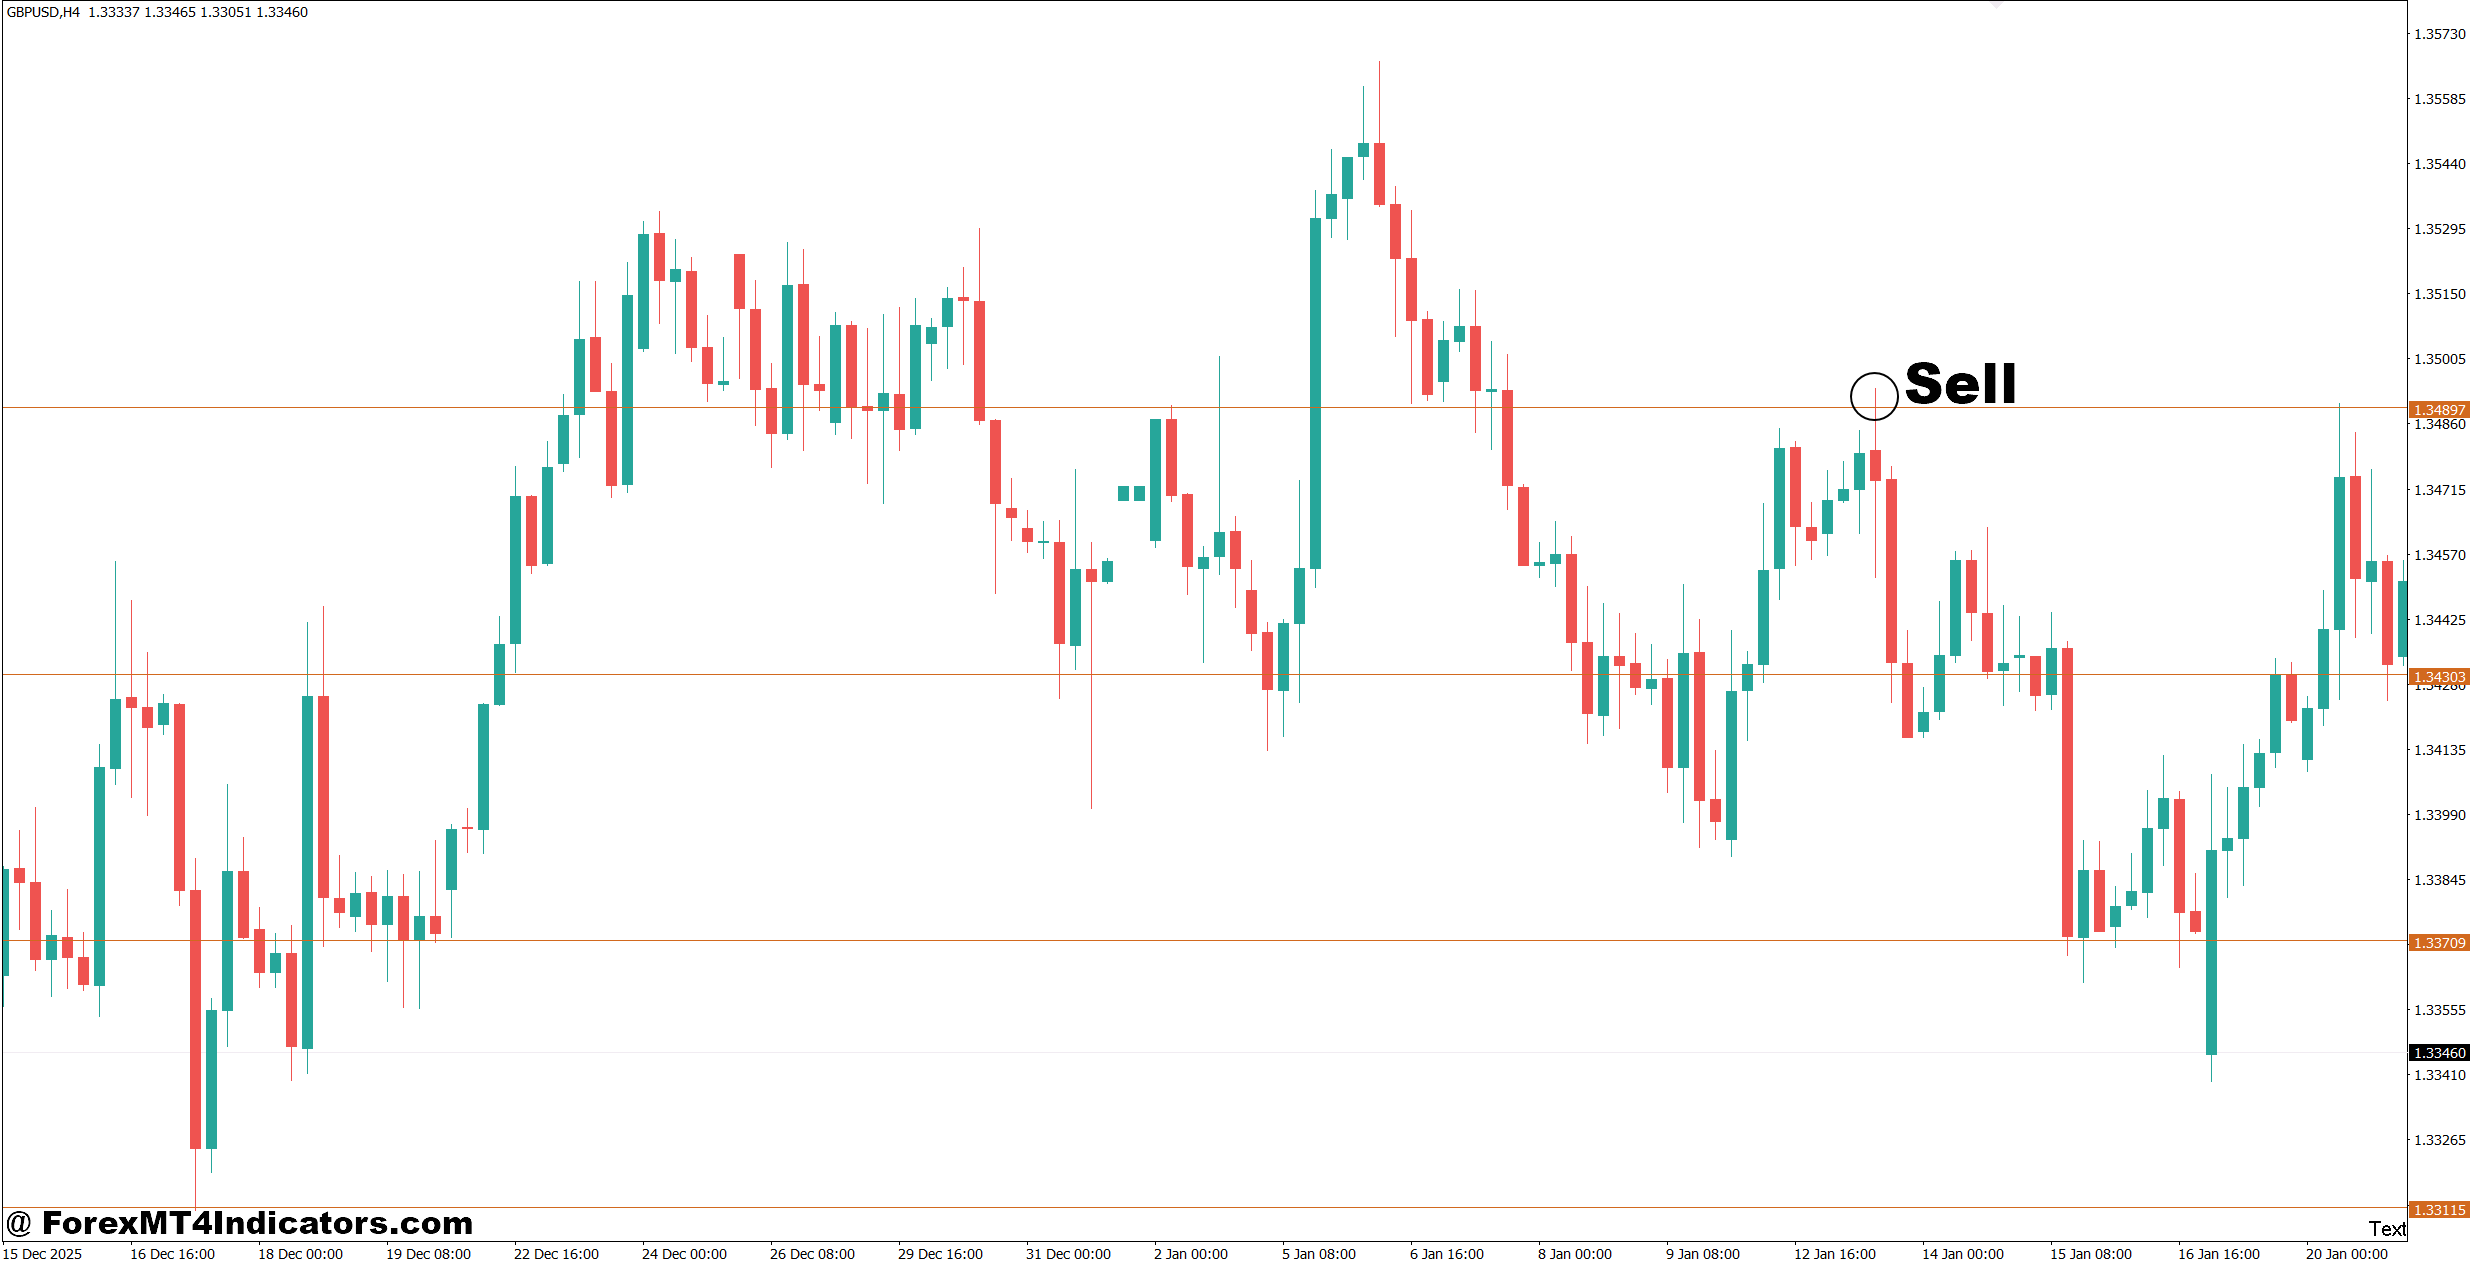
- Sell at Gann resistance – Enter EUR/USD after bearish rejection from a Gann resistance zone on the 1-hour chart, ideally after a 10–20 pip downward confirmation.
- Confirm bearish structure – Look for lower highs and lower lows below the Gann midline before taking a SELL position.
- Trade confirmed breakdowns – Sell GBP/USD after an H1 candle closes 15–20 pips below Gann support and price fails to reclaim the level.
- Use H4 resistance – Favor SELL setups when the 4-hour chart rejects a major Gann resistance level and bearish momentum increases.
- Check daily trend – Give more weight to SELL signals when the daily chart shows lower highs and price remains below major resistance.
- Control the stop-loss – Place the stop 20–40 pips above Gann resistance and keep total trade risk near 0.5%–1%.
- Target the next support – Aim for the next Gann support level while maintaining at least a 1:2 risk-to-reward ratio.
- Avoid late entries – Do not SELL after a sudden 50–70 pip drop because chasing the move can leave poor reward-to-risk conditions.
Final Thoughts on the Gann Box Indicator MT4
The Gann Box Indicator MT4 can give forex traders a different way to study price levels and market timing. Its main value comes from creating a structured chart rather than producing automatic buy or sell decisions. The best results come when projected levels agree with market structure, previous support or resistance, and clear price action.
Three points stand out: use higher timeframes to establish context, wait for confirmation around important levels, and calculate risk before entering. Traders should also test settings separately for EUR/USD, GBP/USD, USD/JPY, gold, and other instruments because their volatility differs.
Used with discipline, the Gann Box can become a useful part of a technical analysis routine. The real test is simple: does it improve the trader’s planning and risk control over a meaningful sample of trades?
Level up your trading
Learn to read the chart — not just the indicator
eBook · Instant PDF
Video Course · 12 modules
Recommended MT4/MT5 Brokers
- ✓ *FREE *$50 to start (withdrawable)
- ✓ Deposit bonus up to $5,000
- ✓ Negative balance protection
Trading forex and CFDs carries a significant risk of loss and is not suitable for everyone. Broker links are affiliate links — we may earn a commission at no cost to you.
Free MT4 Indicator Download

Enter Your Email Address below, download link will be sent to you.