

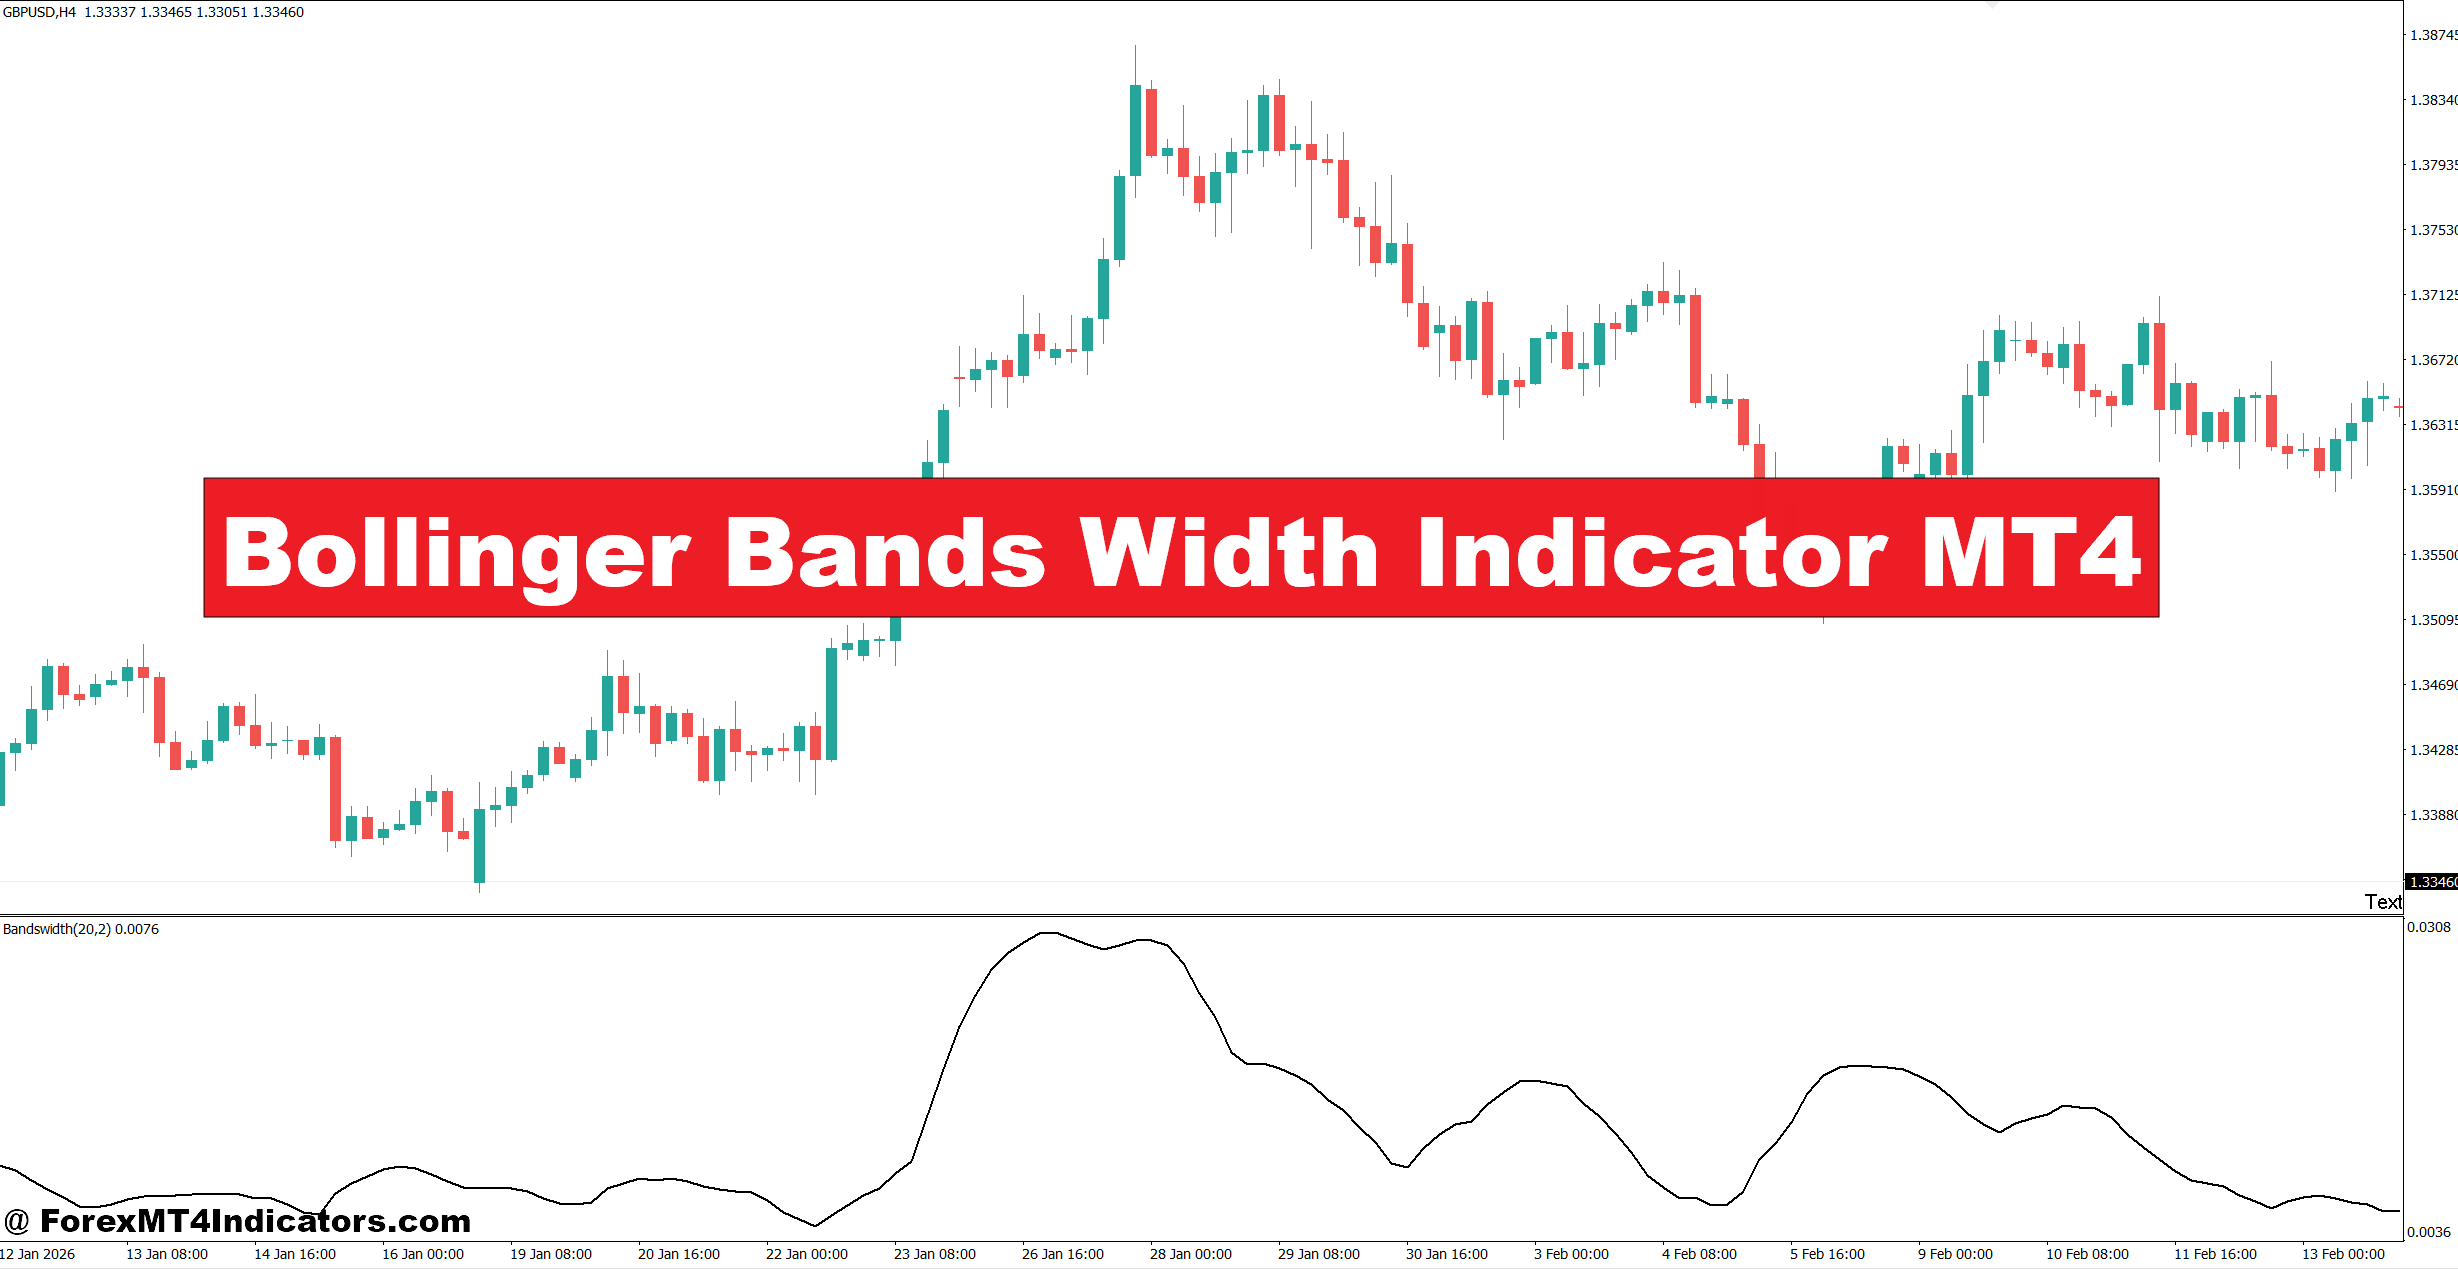
The Bollinger Bands Width Indicator MT4 is a volatility tool that measures how far the upper and lower Bollinger Bands are separated. When the bands move closer together, width falls and the market is showing reduced volatility. When the bands spread apart, width rises as price movement becomes stronger.
The calculation is based on the standard Bollinger Band formula. A common setup uses a 20-period simple moving average with a 2.0 standard deviation multiplier.
The basic relationship is: Band Width = Upper Band − Lower Band
The upper band is generally calculated as: SMA(20) + 2 × Standard Deviation(20)
The lower band is: SMA(20) − 2 × Standard Deviation(20)
Some MT4 versions normalize this distance by the middle band, often producing a percentage-style reading: Width % = (Upper Band − Lower Band) ÷ Middle Band × 100
The exact display can vary between indicator versions, so traders should check the settings and calculation used by their specific MT4 file.
The key idea remains simple: rising width means volatility is expanding, while falling width means volatility is contracting.
How Traders Use Bollinger Band Width for Entries
The most useful feature is the change in width, not a single number taken in isolation. A width reading that looks high on GBP/JPY may be normal for that pair, while the same reading could represent extreme volatility on EUR/USD.
Watch for volatility compression
A prolonged decline in band width often shows that price has entered a tight range. For example, EUR/USD on the 1-hour chart might see its width fall steadily while price trades between 1.0840 and 1.0852.
That 12-pip range doesn’t automatically mean a breakout is coming. It simply tells traders that volatility has contracted. A trader can then mark the range high and low and wait for price confirmation.
If EUR/USD closes above 1.0852 with increasing width and strong bullish price action, a long setup becomes more interesting. A stop might sit around 8–12 pips below the breakout structure, depending on the pair’s current volatility.
Look for expansion after a squeeze
The stronger signal often comes when low width is followed by a sharp expansion. Suppose GBP/USD spends six hours in a narrow 18-pip range. The width indicator remains near its recent lows.
Then London trading begins, price breaks above resistance, and the width starts climbing. That combination is more useful than simply seeing price touch the upper Bollinger Band.
Still, traders should watch for fake-outs. A breakout candle that quickly closes back inside the range can produce a classic whipsaw.
Combine width with market structure
Bollinger Band Width doesn’t tell traders whether to buy or sell. It tells them that volatility is changing.
For that reason, support and resistance remain useful filters. If XAU/USD breaks above a clearly tested resistance level while band width expands, the setup has more context than a width expansion occurring in the middle of an unclear range.
A trader testing this approach might require a breakout candle to close beyond resistance and then wait for a retest before entering. This can reduce the number of entries taken during random spikes.
Settings for Different Forex Timeframes
The default 20-period setting works as a starting point, but traders can adjust it based on the market and timeframe.
On a 15-minute chart, a 20-period setting covers roughly the previous five hours of candles. Traders looking for short intraday moves may keep the standard setting but use a wider stop during active sessions.
On the 1-hour chart, 20 periods represent approximately 20 hours of price data. This can provide a useful view of recent volatility without reacting to every small price fluctuation.
On the 4-hour chart, traders may experiment with 20 or 30 periods. A longer period can smooth the width reading and reduce reactions to short-lived volatility bursts.
For example, GBP/JPY can produce much larger hourly moves than EUR/USD. A trader shouldn’t use the same fixed 10-pip breakout expectation for both pairs. Instead, recent average range and nearby market structure should guide the entry, stop, and target.
A practical approach is to test settings over at least 50–100 historical setups before changing them aggressively. Constantly optimizing the period after every losing trade usually creates more problems than it solves.
Strengths, Limitations, and Useful Combinations
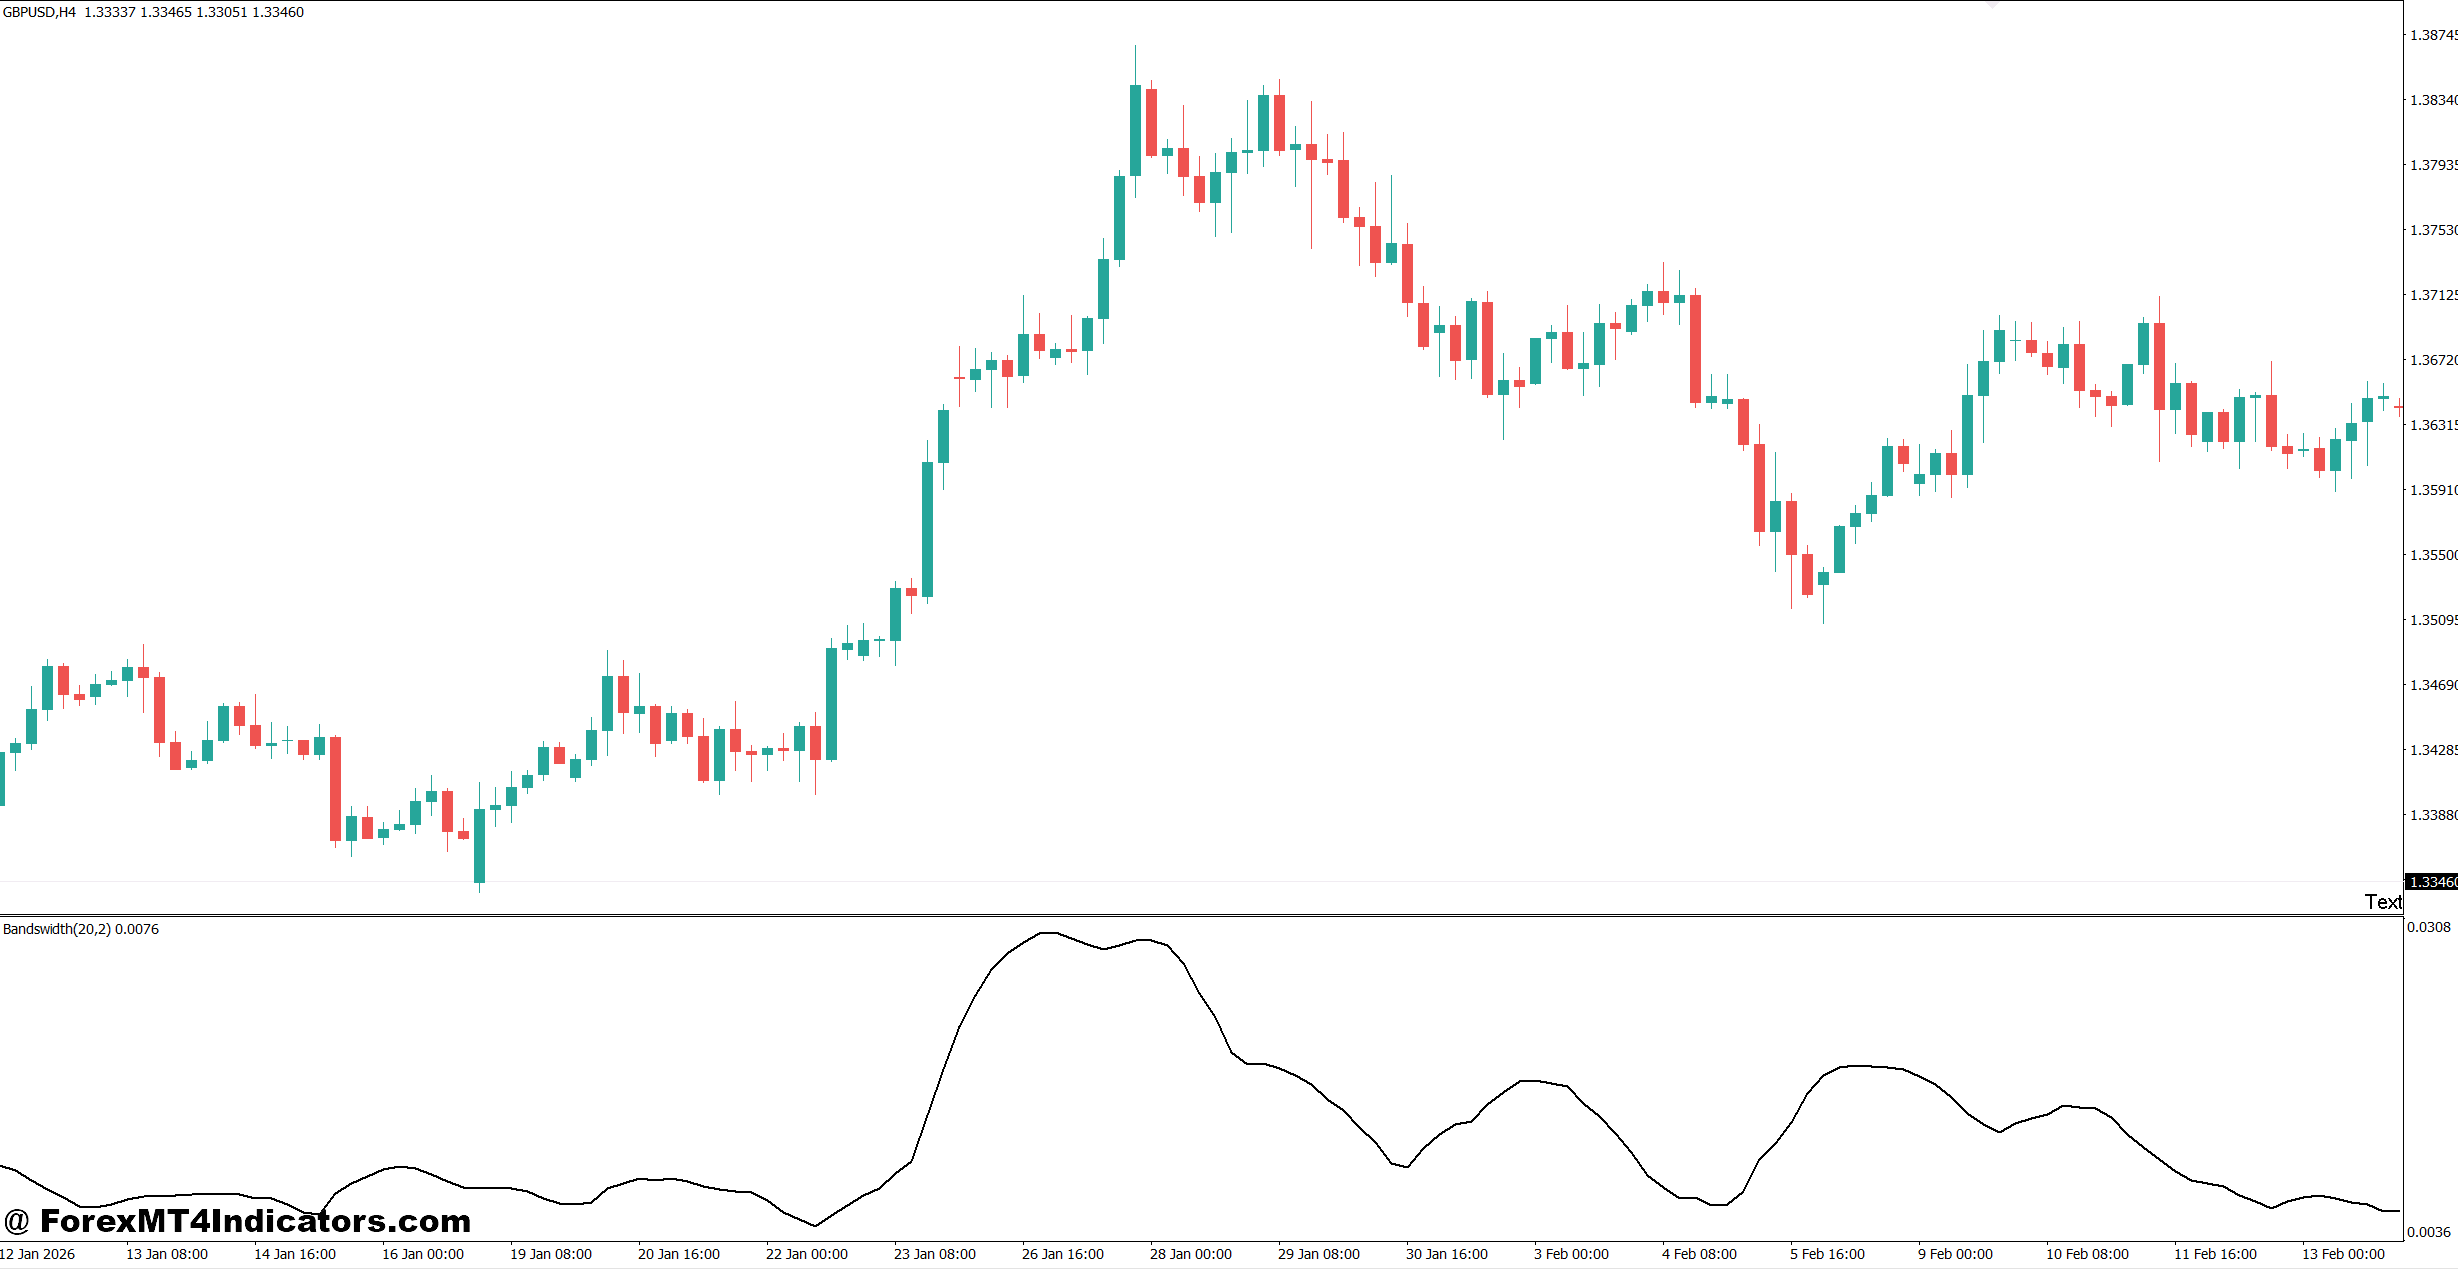
One major advantage of the indicator is simplicity. It turns Bollinger Band expansion and contraction into a dedicated visual reading, making volatility changes easier to spot.
It also works well with other technical tools. A trader might combine it with a 14-period RSI, a 20-period moving average, or clearly defined support and resistance.
For instance, if EUR/USD breaks resistance while width rises and the 14-period RSI moves from 52 to 64, the three readings support the idea of stronger bullish momentum. None of them guarantees that the move will continue, but the setup has better confirmation.
Compared with Average True Range (ATR), Bollinger Band Width focuses specifically on the relative separation of Bollinger Bands. ATR measures average true range and is often more useful for calculating stop distances.
Compared with the standard Bollinger Bands, the Width indicator provides a cleaner view of volatility contraction and expansion rather than making the trader visually estimate the distance between the bands.
Its main limitation is direction. Width can rise during both strong bullish and bearish moves. It can also expand during a news spike that quickly reverses.
During volatile NFP releases, for example, a trader may see width jump sharply within one or two candles. Entering purely because volatility expanded can be dangerous. Spread widening, slippage, and rapid reversals can make an otherwise attractive setup difficult to trade.
The better approach is to treat width as a context tool. Price structure, momentum, session timing, and risk management still matter.
Practical Trading Example
Consider EUR/USD on the 1-hour chart. Price has spent the previous eight candles between 1.0880 and 1.0900, while Bollinger Band Width falls toward its lowest level of the past 30 candles.
A trader marks 1.0900 as resistance and waits.
The next candle closes at 1.0912 with noticeably stronger momentum. At the same time, band width begins rising from its compressed level. Instead of entering blindly at the first tick above 1.0900, the trader could wait for a retest near 1.0900–1.0905.
If the retest holds, a possible entry could be around 1.0905, with a stop near 1.0888. A 35-pip target would provide roughly a 2:1 reward-to-risk ratio.
But if price falls back below 1.0900 and width expands while the candle closes bearish, the setup should be reconsidered. The same volatility expansion that supported the original trade can also confirm that the breakout failed.
That distinction matters. Traders shouldn’t treat rising width as an automatic buy or sell signal.
How to Trade with Bollinger Bands Width Indicator MT4
Buy Entry
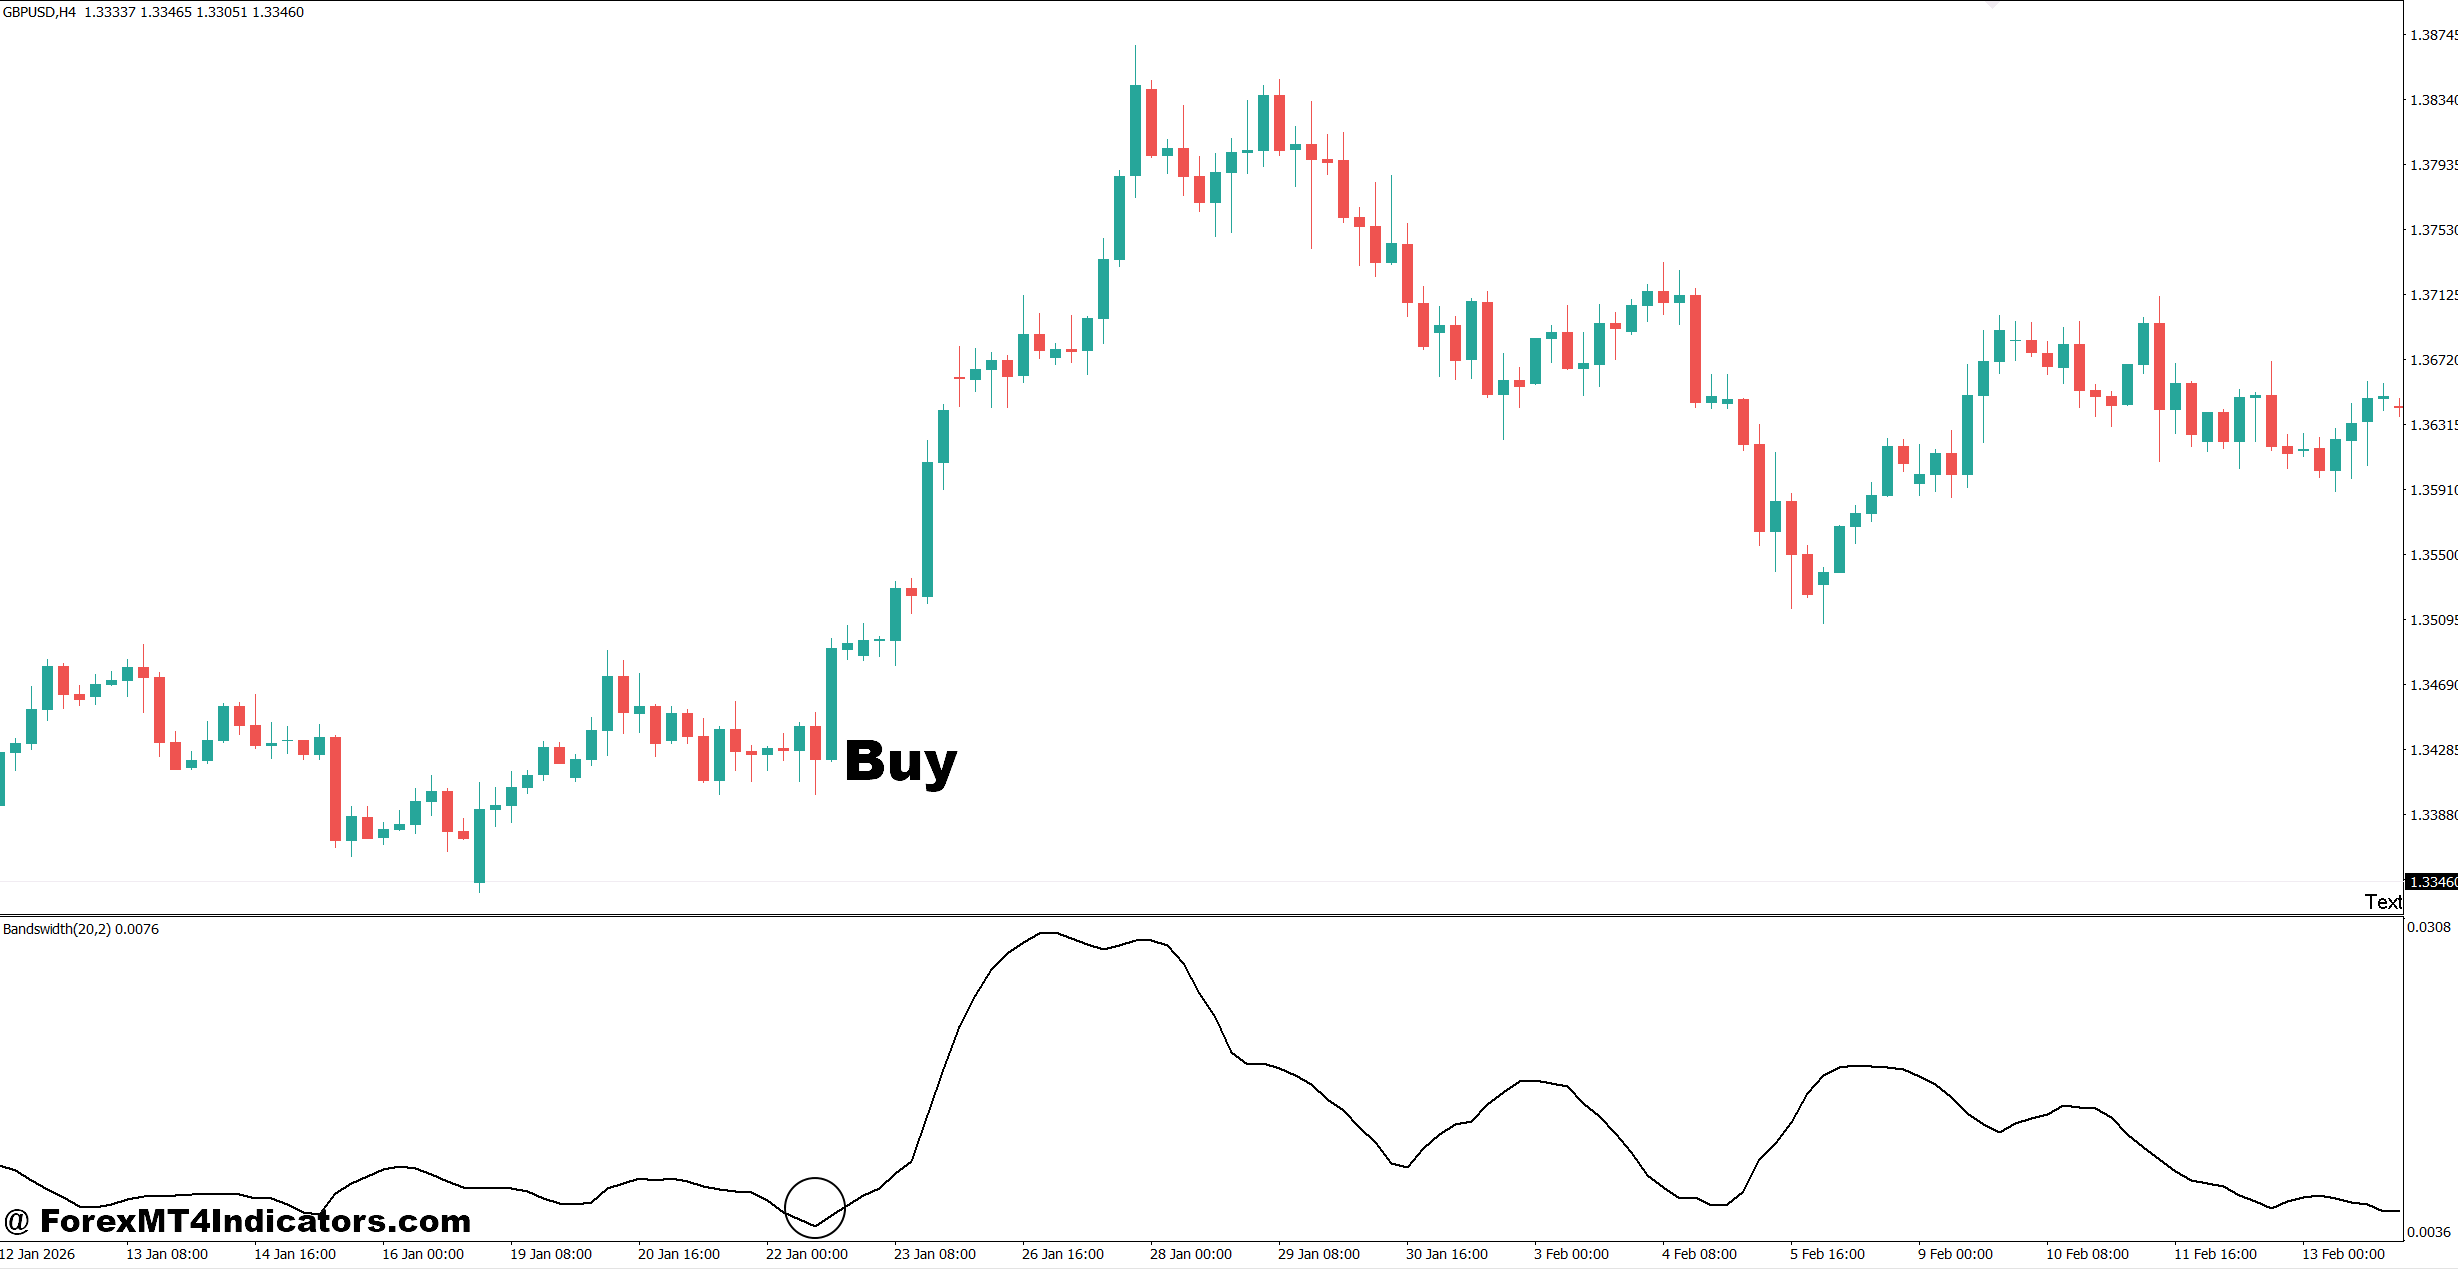
- Wait for Width Compression – Look for Bollinger Band Width near its 20–30 candle low on the 1-hour chart before expecting a breakout.
- Buy Above Resistance – Enter EUR/USD after a 1-hour candle closes 5–10 pips above a clear resistance level with rising band width.
- Confirm Width Expansion – Prefer buy signals when width increases by around 15–25% from its recent low.
- Check Trend Direction – On GBP/USD 4-hour charts, favor buys when price stays above the 20-period moving average.
- Use a Retest Entry – After a breakout, consider buying the retest within 3–8 pips of the broken resistance instead of chasing price.
- Set a Logical Stop – Place the stop 10–20 pips below the breakout structure, adjusting for the pair’s current volatility.
- Target 1.5–2R – Aim for at least 1.5 times the initial risk; a 20-pip stop can target 30–40 pips.
- Avoid Weak Breakouts – Don’t buy when width expands but the candle closes back below resistance or spreads become unusually wide.
Sell Entry
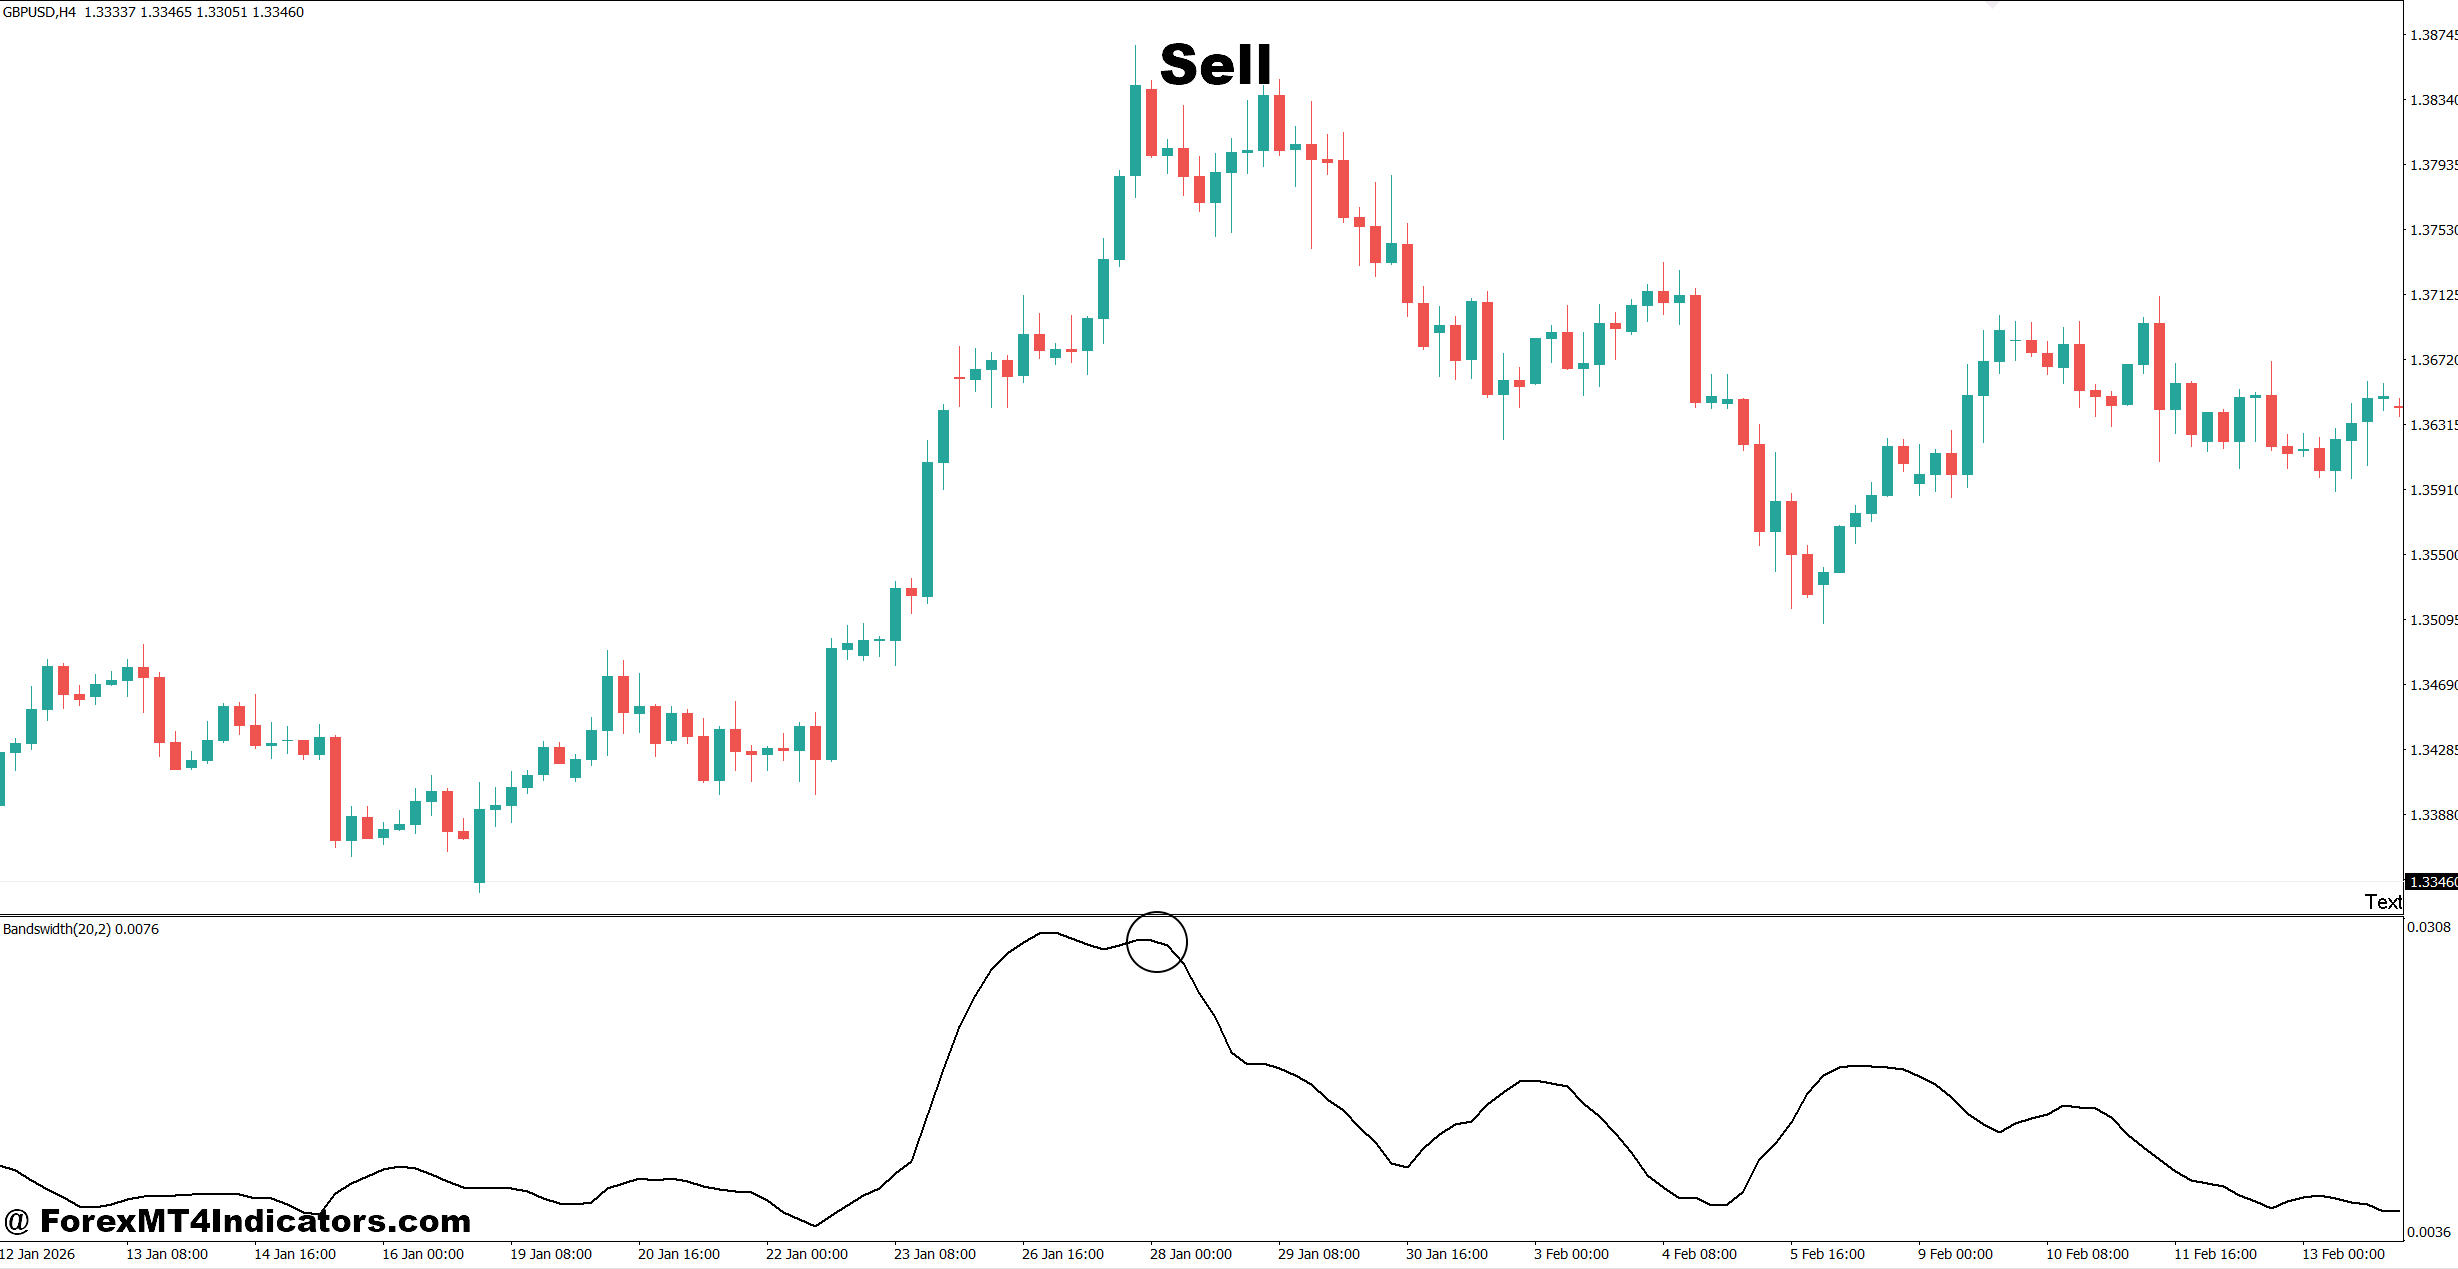
- Watch for Volatility Compression – Look for width reaching a 20–30 candle low before a potential bearish expansion.
- Sell Below Support – On EUR/USD 1-hour, consider selling after a candle closes 5–10 pips below established support.
- Confirm Width Expansion – Prefer shorts when band width rises at least 15–25% from its recent compressed level.
- Check the Downtrend – On GBP/USD 4-hour, favor sells when price remains below the 20-period moving average.
- Wait for a Retest – Consider entering after price retests broken support within roughly 3–8 pips and rejects it.
- Control Stop Distance – Place the stop 10–20 pips above the broken support or recent swing high.
- Protect the Risk – Target 30–40 pips when risking 20 pips, giving the trade approximately a 1.5–2:1 reward-to-risk ratio.
- Skip News-Driven Signals – Avoid new sell entries during major releases such as NFP when width suddenly jumps 30–50% and price becomes erratic.
Final Takeaway
The Bollinger Bands Width Indicator MT4 gives traders a practical way to monitor changing volatility. Its strongest use is often around compression and expansion, especially when those changes occur near important support or resistance levels.
- Measure volatility: Falling width can identify quiet market conditions, while rising width highlights expansion.
- Confirm the breakout: Price should provide directional evidence rather than relying on width alone.
- Adjust to the pair: EUR/USD, GBP/JPY, and XAU/USD can behave very differently, so fixed pip expectations can be misleading.
- Control the downside: Stops and position size should reflect current volatility and account risk.
The indicator won’t predict every breakout, and it can react sharply during news events. Traders who combine it with market structure and disciplined risk management are more likely to use its information effectively.
Trading forex carries substantial risk. No indicator guarantees profits. A sensible next step is to test the Bollinger Bands Width Indicator MT4 across 50–100 historical setups and record which conditions produced the cleanest moves.
Level up your trading
Learn to read the chart — not just the indicator
eBook · Instant PDF
Video Course · 12 modules
Recommended MT4/MT5 Brokers
- ✓ *FREE *$50 to start (withdrawable)
- ✓ Deposit bonus up to $5,000
- ✓ Negative balance protection
Trading forex and CFDs carries a significant risk of loss and is not suitable for everyone. Broker links are affiliate links — we may earn a commission at no cost to you.
Free MT4 Indicator Download

Enter Your Email Address below, download link will be sent to you.