

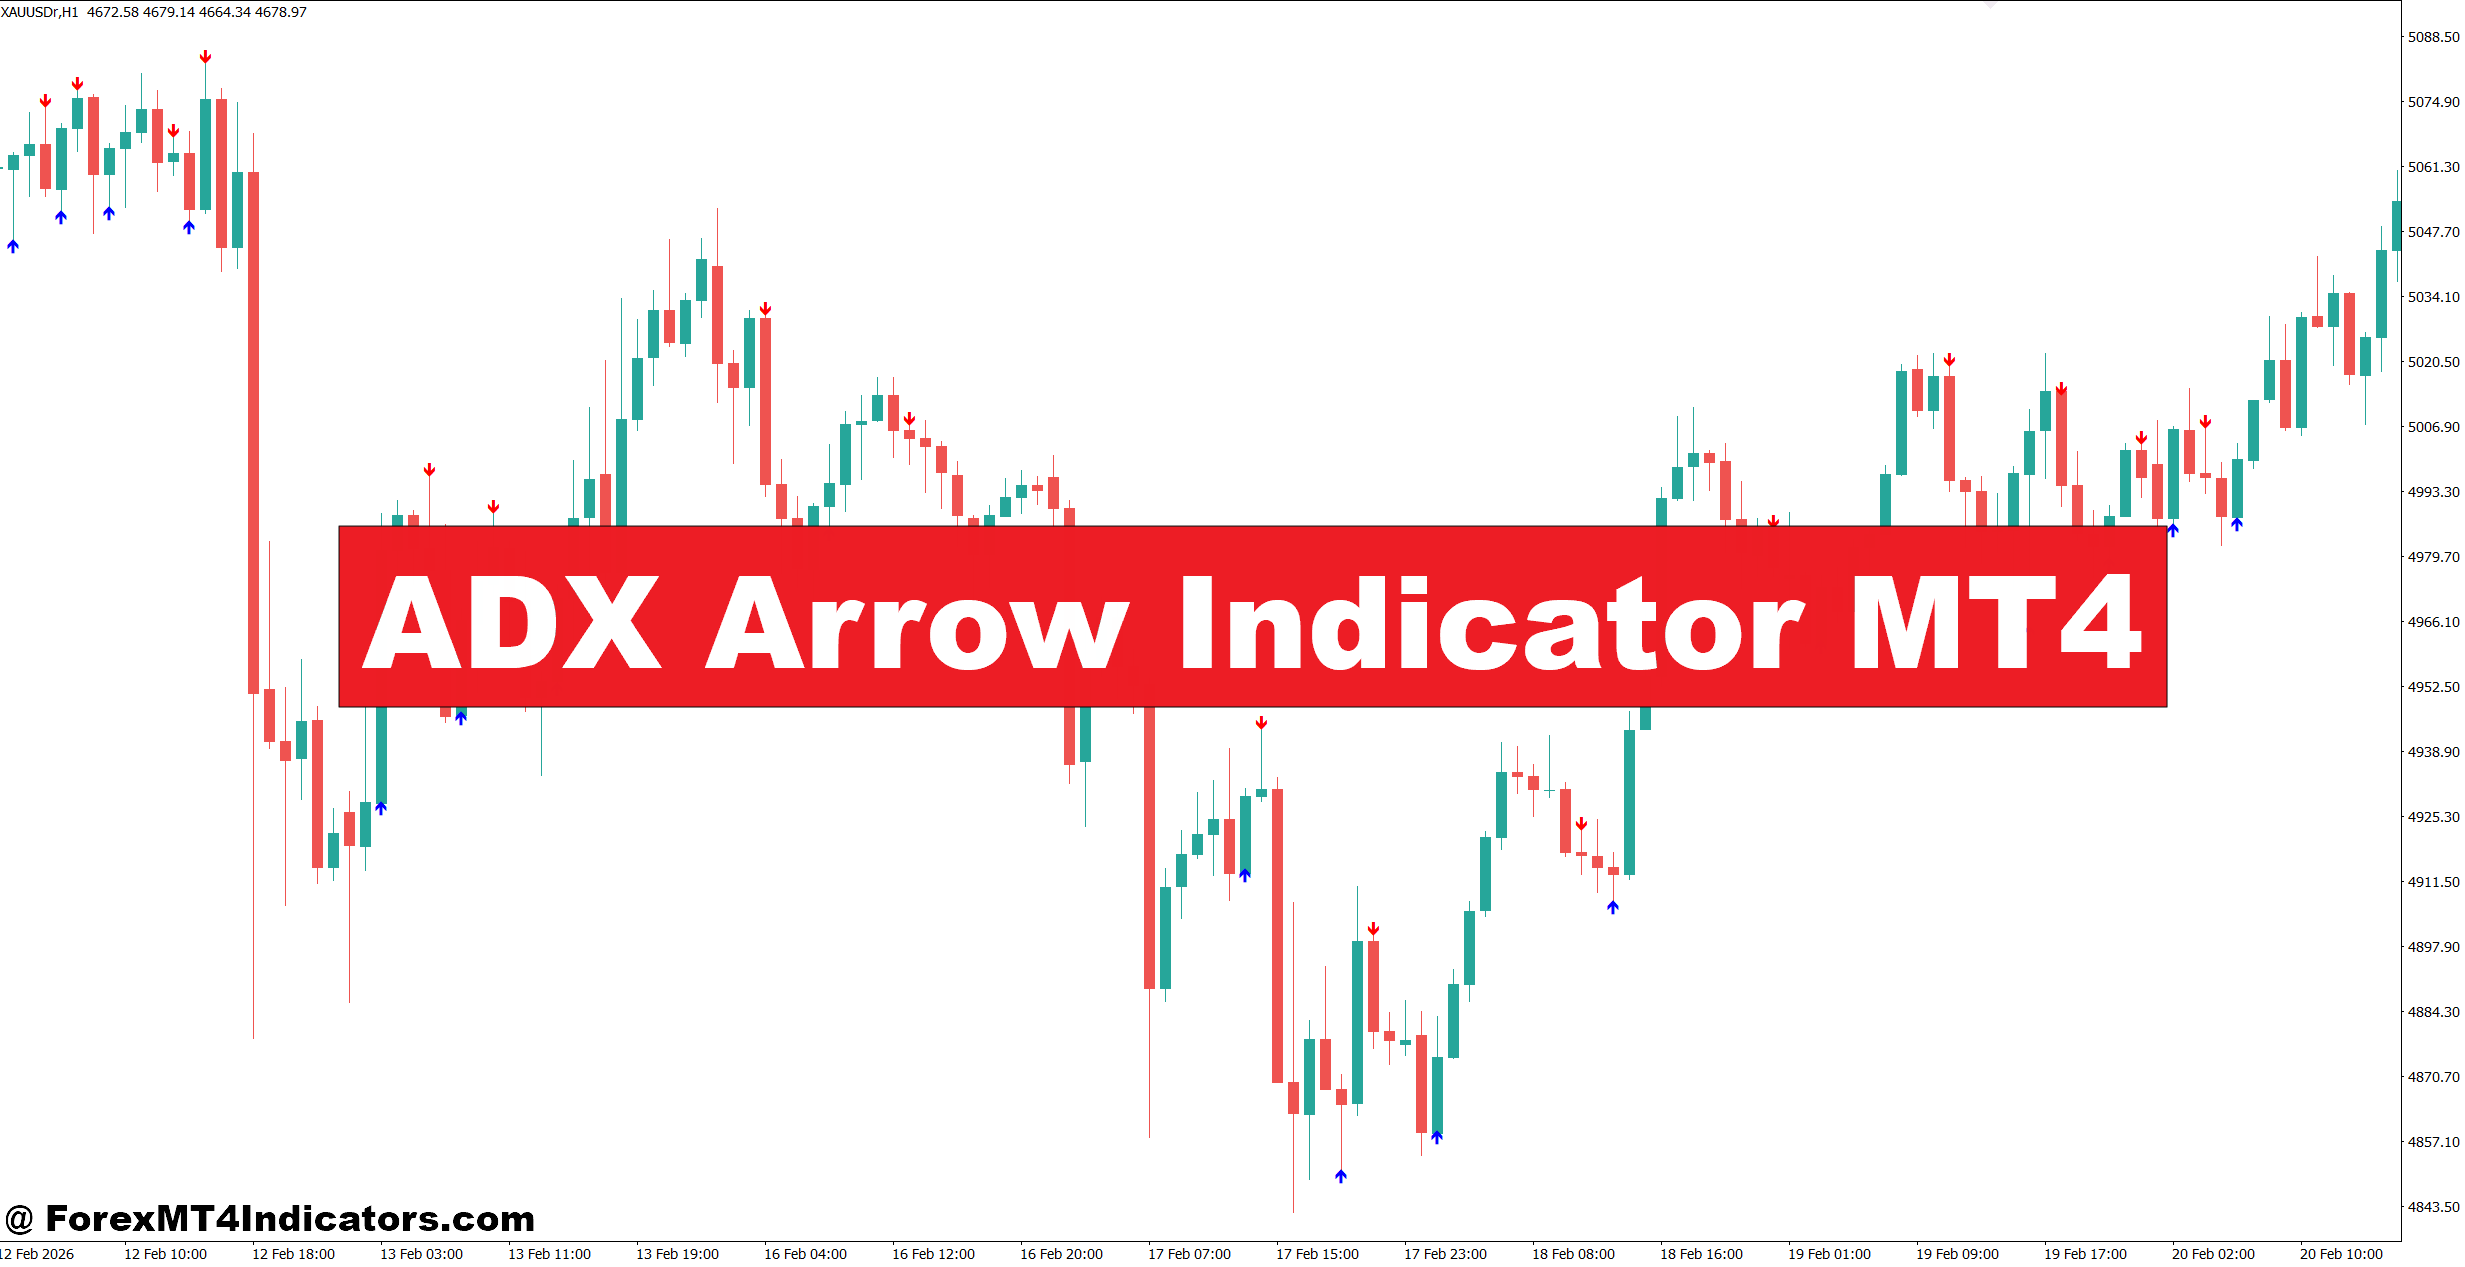
The ADX Arrow Indicator MT4 often catches a trader’s attention after a frustrating week of missed trends. A common situation happens when price starts moving strongly, but the entry comes too late because the trend wasn’t obvious at first. On the other hand, entering too early during a weak market can lead to repeated stop-losses and unnecessary losses.
Those false starts create more than financial damage. They also make traders second-guess every setup, hesitate before pulling the trigger, or chase price after the move has already happened. Over time, that cycle can affect confidence and trading discipline.
The ADX Arrow Indicator MT4 is designed to reduce that uncertainty by combining trend strength with visual arrow signals. Instead of forcing traders to interpret several indicators at once, it highlights potential buying and selling opportunities when market momentum starts to build. The tool doesn’t replace sound analysis, but it can simplify decision-making when used alongside price action. Understanding how it works is the first step toward using it effectively in real market conditions.
What Is the ADX Arrow Indicator MT4?
The ADX Arrow Indicator MT4 is a trend-following indicator built around the Average Directional Index (ADX) and the Directional Movement Index (DMI). It places arrows directly on the chart whenever predefined trend conditions are met, making it easier to identify possible entry points without watching multiple indicator windows.
Unlike the standard ADX, which mainly measures trend strength, this version converts the underlying calculations into visual trading signals. The indicator typically evaluates the relationship between the +DI and -DI lines while checking whether the ADX value confirms increasing momentum.
For example, if the +DI crosses above the -DI and the ADX rises above 25, the indicator may print a buy arrow. When the opposite happens, it generates a sell arrow.
Many traders apply it to EUR/USD, GBP/USD, USD/JPY, and Gold because these markets often develop sustained trends during active trading sessions.
How the Indicator Generates Signals
The logic behind the ADX Arrow Indicator MT4 is based on directional movement.
The ADX itself doesn’t indicate whether price is moving up or down. Instead, it measures the strength of the current trend on a scale from 0 to 100. Most traders consider readings below 20 to represent a ranging market, while values above 25 suggest that momentum is increasing.
The indicator usually follows this sequence:
- It calculates positive and negative directional movement.
- It compares the +DI and -DI values.
- It measures overall trend strength through the ADX calculation.
- It displays an arrow only after all conditions align.
This extra confirmation helps reduce random signals during sideways markets. Still, no indicator can eliminate every fake-out.
In practice, a trader watching EUR/USD on the 1-hour chart might see a buy arrow after ADX climbs from 18 to 28 while price breaks above recent resistance. That combination often provides more confidence than relying on an arrow alone.
Using the ADX Arrow Indicator in Real Trading
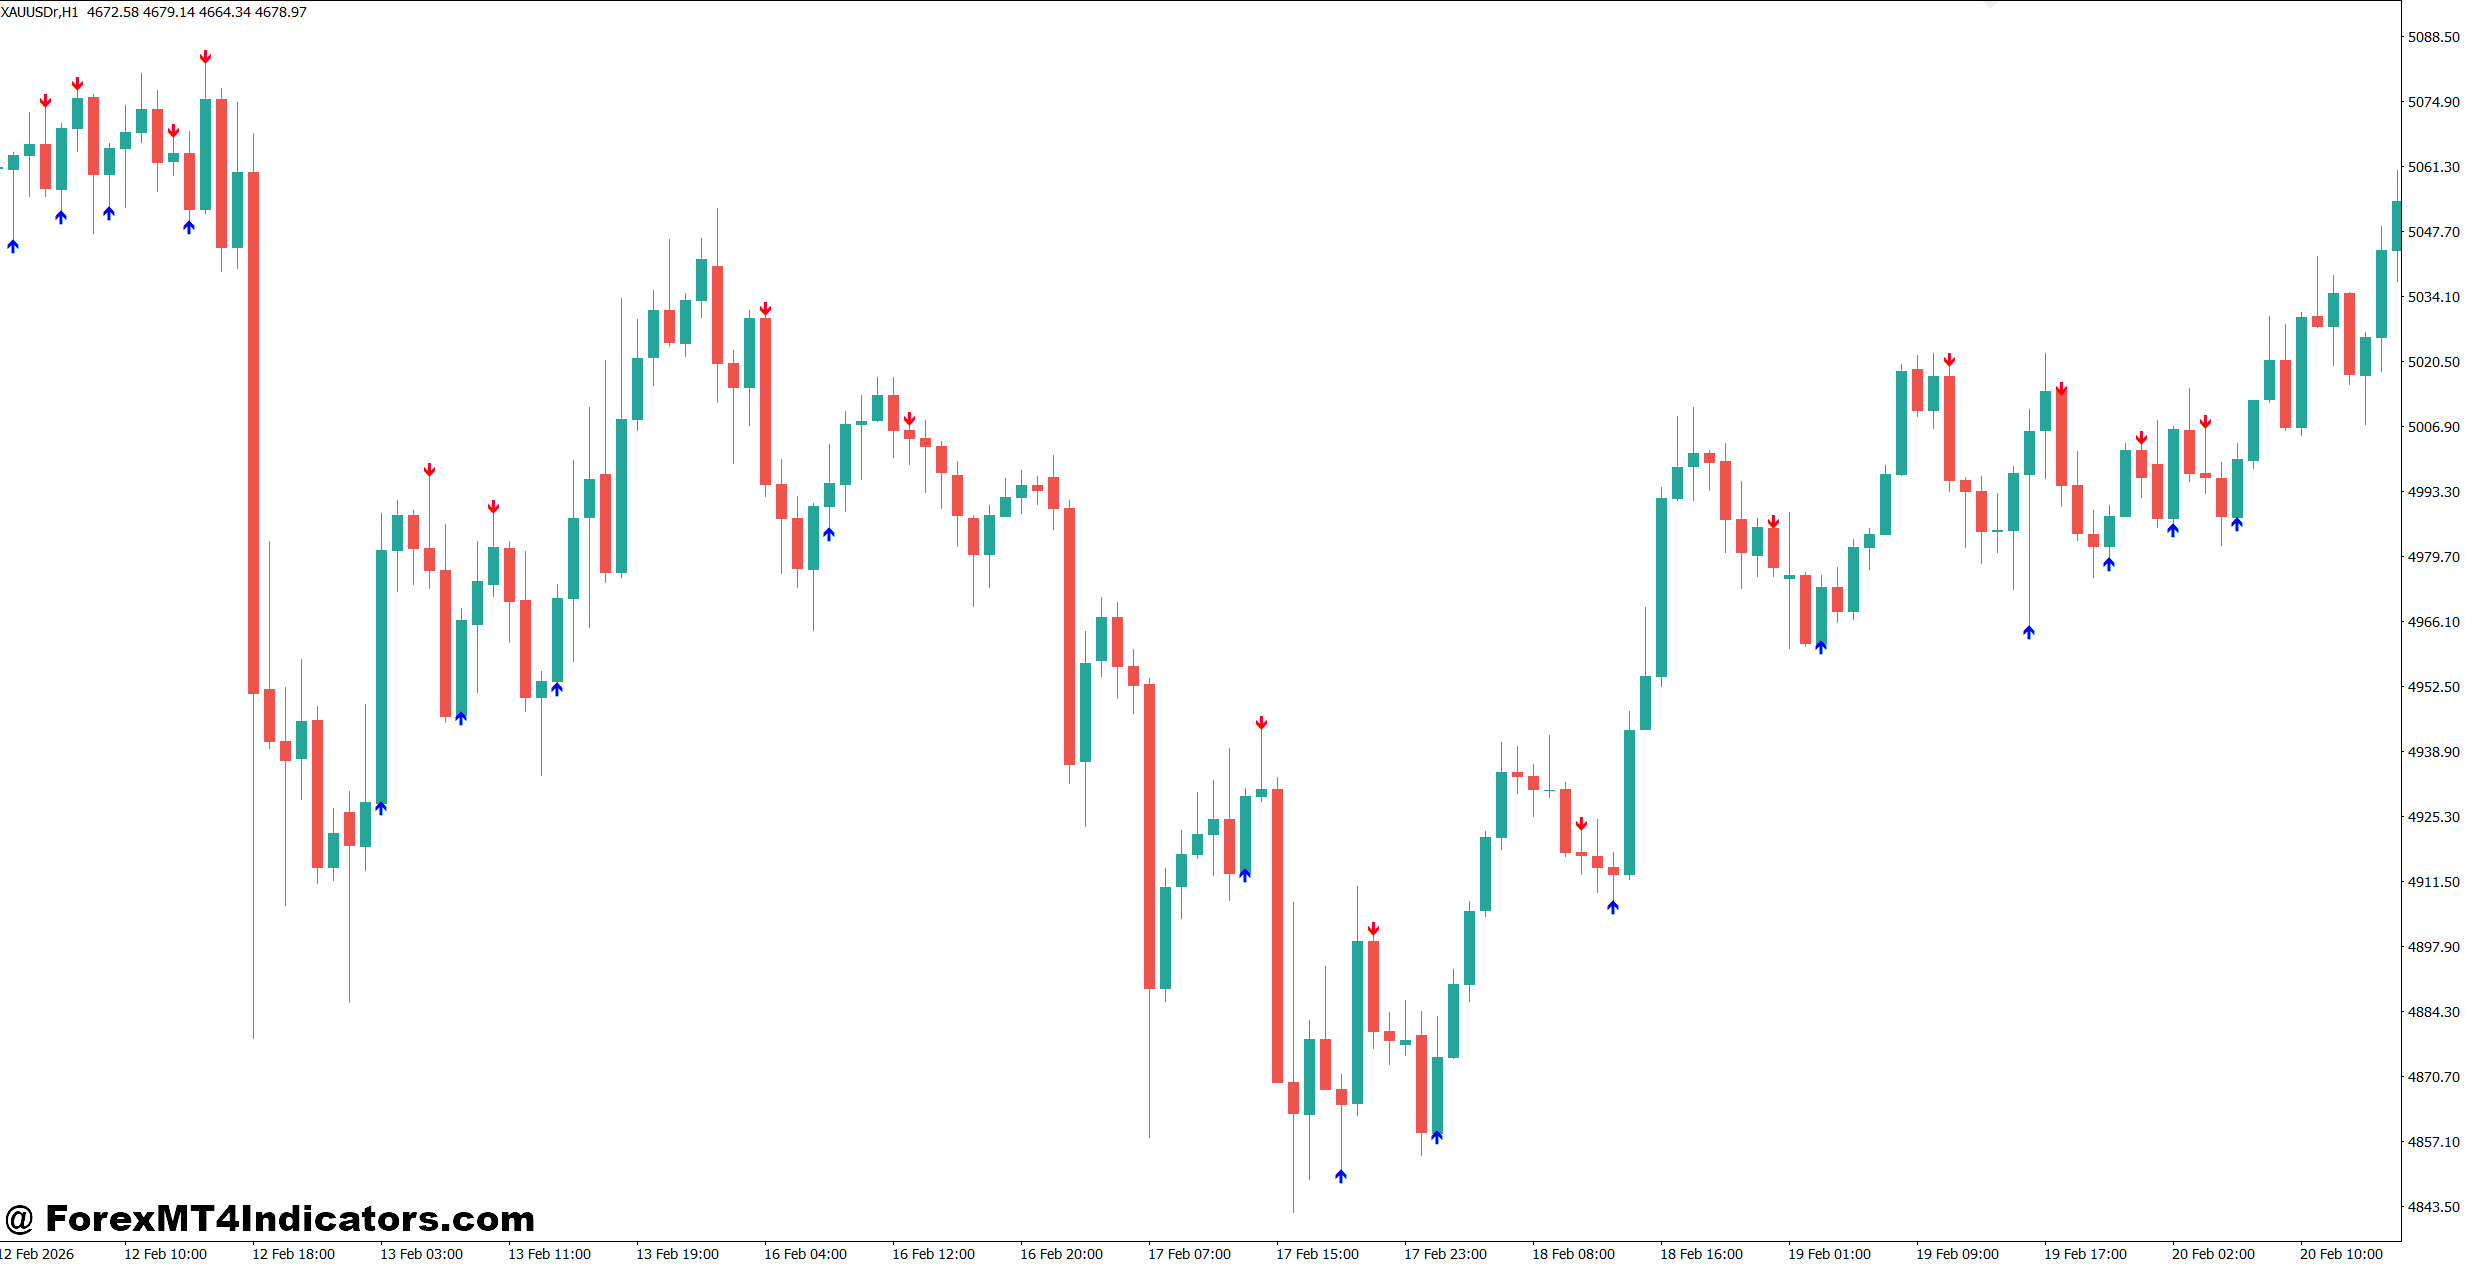
Many experienced traders don’t treat the arrow as an automatic entry signal. Instead, they wait for price confirmation.
Suppose GBP/USD forms a bullish engulfing candle near a support level on the 4-hour chart. Shortly afterward, the ADX Arrow Indicator prints a buy signal while ADX continues rising above 30. That setup carries more weight because several technical factors agree with each other.
The opposite also applies.
Imagine USD/CHF trading inside a narrow range during the Asian session. Even if an arrow appears, the market may lack enough momentum for a sustained move. Waiting until London or New York opens often improves the quality of trend signals.
When testing this indicator during volatile Non-Farm Payroll (NFP) releases, many traders notice that arrows can appear several times within minutes as price swings sharply. Waiting for the first candle after the news to close usually filters out many false entries.
Stop-loss placement remains critical. Some traders position stops 20 to 35 pips below the recent swing low for buy trades or above the swing high for sell trades. Others prefer using the Average True Range (ATR) to account for changing market volatility.
Trading forex carries substantial risk. No indicator guarantees profits.
Best Settings and Customization
Most versions of the ADX Arrow Indicator MT4 use a default ADX period of 14, which works well across many currency pairs.
Still, adjustments can improve performance depending on market conditions.
Scalping
Lower timeframes like M5 or M15 often benefit from slightly shorter ADX periods between 10 and 12. These settings react faster but may generate more false signals during choppy sessions.
Intraday Trading
For M30 and H1 charts, the standard 14-period setting remains a popular choice. It balances responsiveness with signal quality.
Swing Trading
Daily and 4-hour charts often perform well with ADX periods between 14 and 20. Longer settings smooth market noise and focus on stronger trends.
Some traders also combine the indicator with:
- 50 EMA for trend direction.
- Support and resistance zones.
- RSI (14) to avoid buying overextended moves.
- ATR for dynamic stop-loss placement.
What makes this combination useful? The arrow identifies possible entries, while the additional tools help confirm whether the setup fits the broader market structure.
Advantages and Limitations Compared with Similar Indicators
The ADX Arrow Indicator MT4 stands out because it simplifies trend analysis. Instead of constantly checking ADX, +DI, and -DI values separately, traders receive straightforward visual alerts.
Another advantage is that it encourages trading in stronger market conditions rather than forcing entries during low volatility.
That said, the indicator has limits.
Like many trend-following tools, it reacts after momentum begins. Some entries arrive later than breakout traders would prefer. During sideways markets, multiple arrows may appear without producing meaningful price movement.
Compared with a Moving Average crossover, the ADX Arrow Indicator usually filters weak trends more effectively because it considers momentum instead of price direction alone.
Compared with MACD, the indicator often produces cleaner visual entries but provides less information about momentum divergence.
Against Supertrend indicators, ADX Arrow signals generally appear less frequently, yet they often avoid some of the whipsaw conditions seen during ranging markets.
Many traders find the best results by combining the indicator with market structure instead of relying on it as a complete trading system.
The strongest trades often occur when a fresh arrow aligns with higher highs in an uptrend or lower lows in a downtrend.
How to Trade with ADX Arrow Indicator MT4
Buy Entry
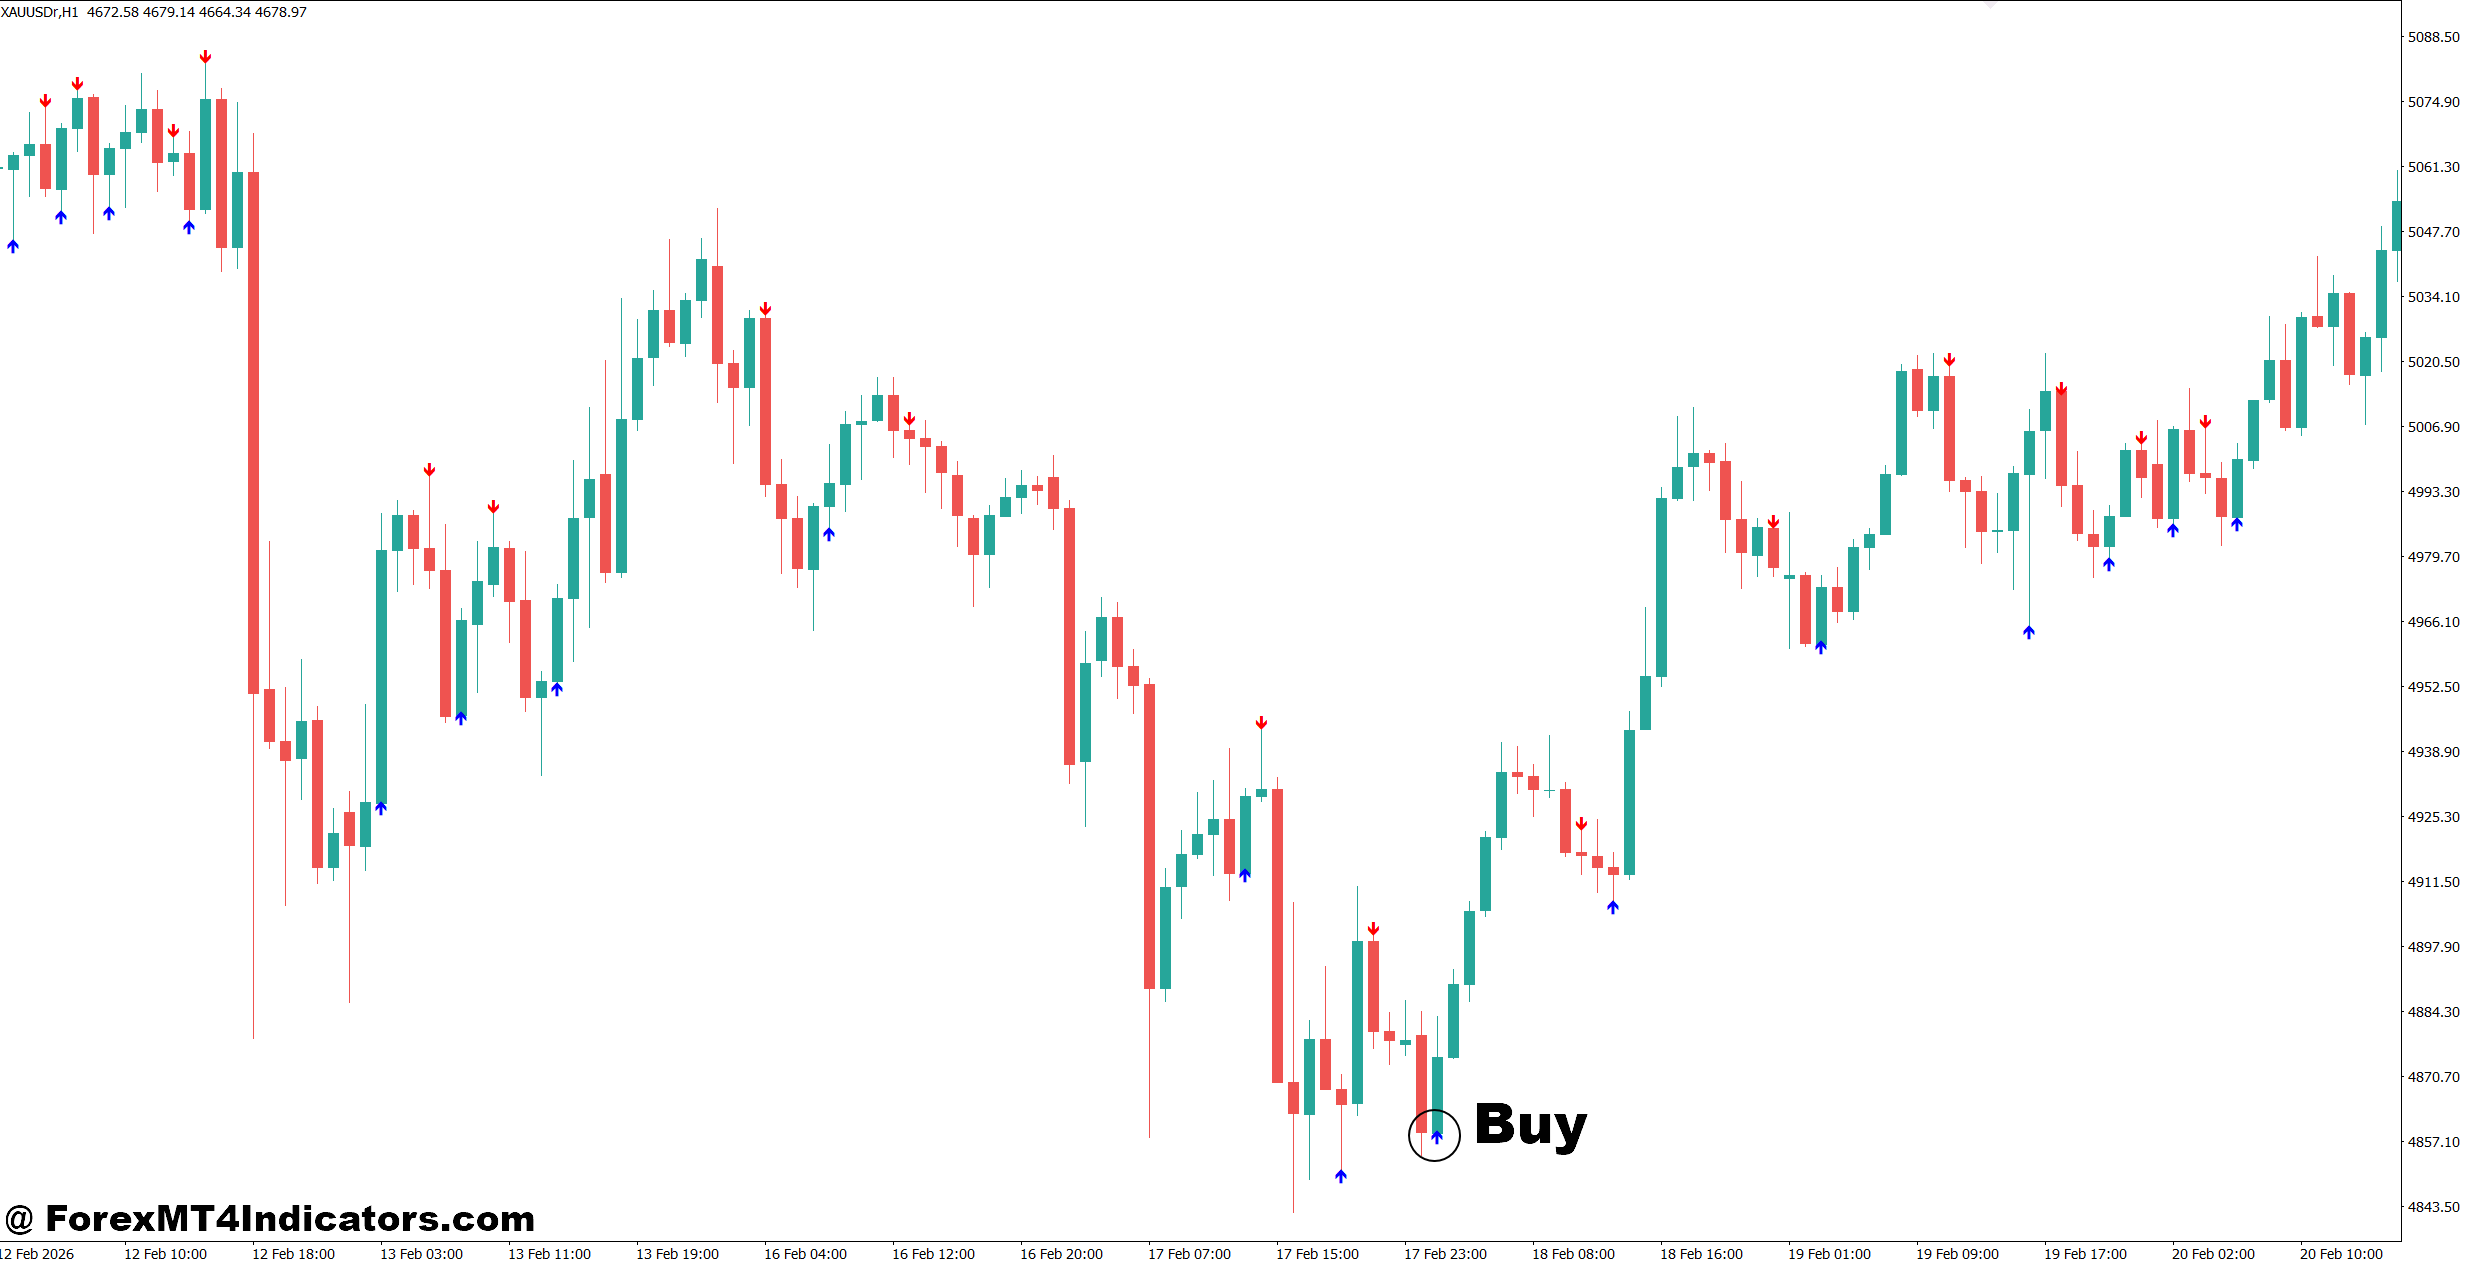
- Wait for a Buy Arrow – Enter when a buy arrow appears and ADX is above 25 on the 1-hour EUR/USD chart.
- Confirm with Trend – Buy only if price stays above the 50 EMA to trade with the main trend.
- Trade Strong Breakouts – Enter after a candle closes 10-15 pips above resistance with a fresh buy arrow.
- Place Stop-Loss Smartly – Keep the stop-loss 20-30 pips below the recent swing low.
- Aim for Better Reward – Use at least a 1:2 risk-to-reward ratio or target 40-60 pips.
- Check Higher Timeframe – Confirm the 4-hour trend matches the 1-hour buy signal.
- Avoid Weak Markets – Skip buy trades if ADX is below 20 or price is moving sideways.
- Manage Trade Risk – Risk only 1-2% of account balance on each position.
Sell Entry
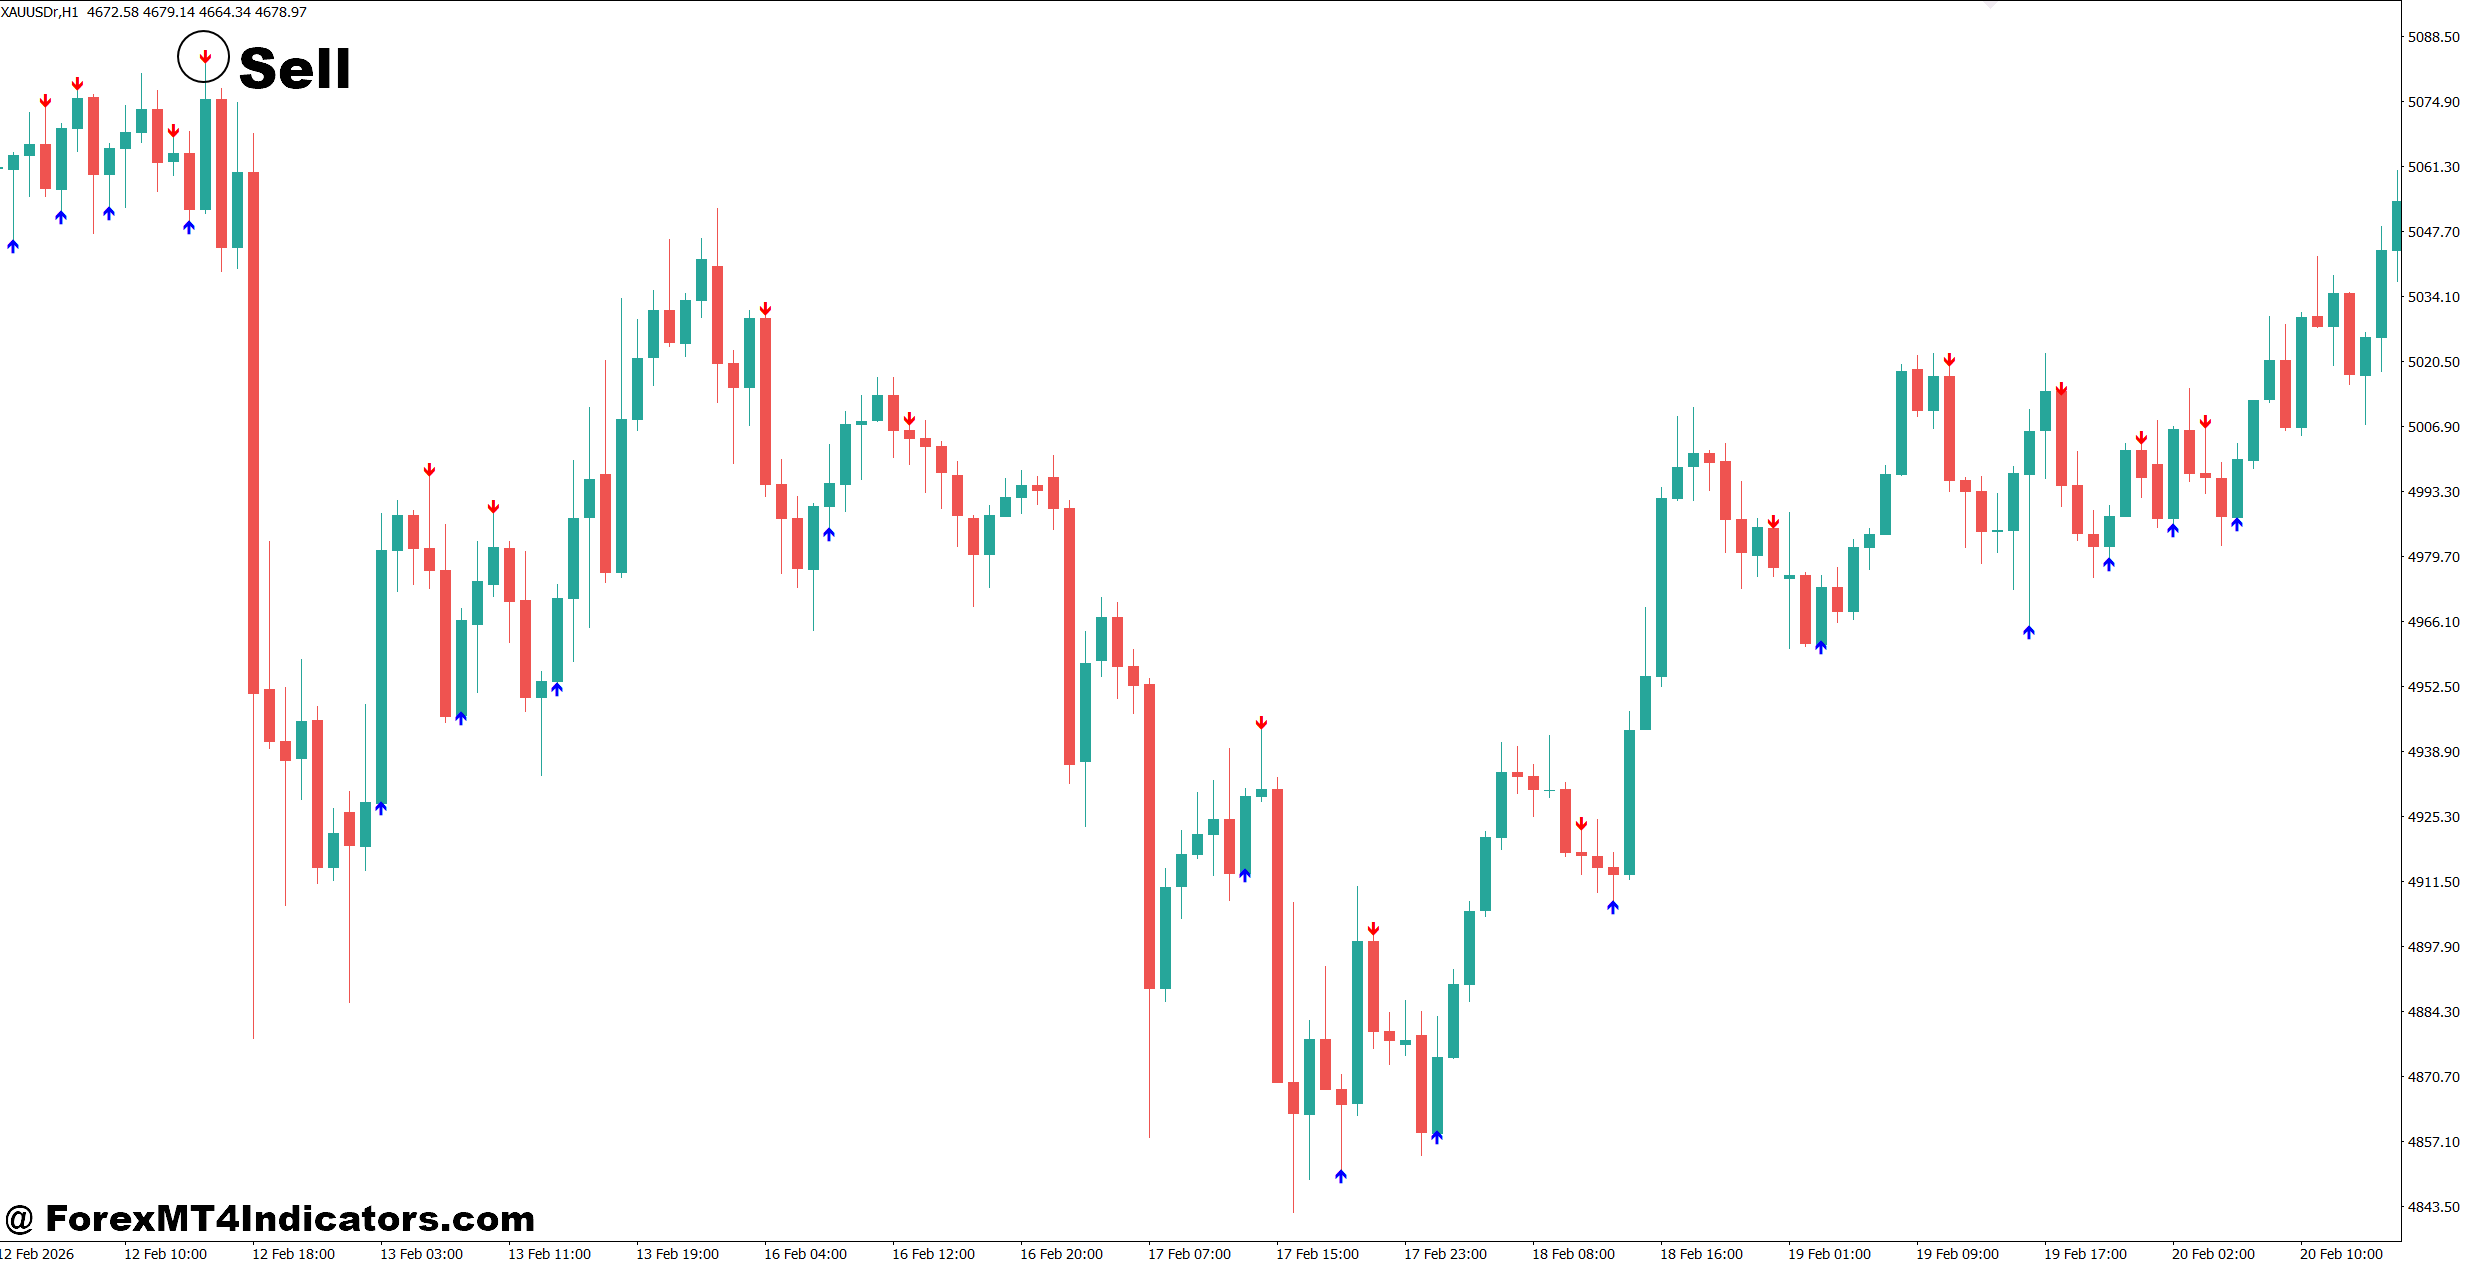
- Wait for a Sell Arrow – Enter when a sell arrow appears and ADX rises above 25 on the 1-hour GBP/USD chart.
- Follow the Downtrend – Sell only if price remains below the 50 EMA for stronger confirmation.
- Trade Support Breaks – Enter after price closes 10-15 pips below support with a sell arrow.
- Set Stop-Loss Properly – Place the stop-loss 20-30 pips above the latest swing high.
- Secure Profits – Target 40-60 pips or maintain a 1:2 risk-to-reward ratio.
- Use Multi-Timeframe Confirmation – Check that the 4-hour or daily trend is also bearish.
- Avoid Choppy Conditions – Ignore sell arrows when ADX stays below 20 or before major news releases.
- Protect Your Capital – Move the stop-loss to breakeven after 25-30 pips of profit.
The ADX Arrow Indicator MT4 offers a practical way to spot developing trends while reducing some of the guesswork involved in technical analysis. Traders benefit most when they combine its signals with support and resistance, price action, and sensible risk management. Strong ADX readings can improve confidence, visual arrows simplify chart analysis, and flexible settings allow adaptation across different trading styles. At the same time, delayed entries and occasional false signals remind traders that no technical tool is perfect. Used with patience and disciplined trade management, the ADX Arrow Indicator MT4 can become a valuable part of a well-rounded trading plan rather than the sole reason for entering a position.
Level up your trading
Learn to read the chart — not just the indicator
eBook · Instant PDF
Video Course · 12 modules
Recommended MT4/MT5 Brokers
- ✓ *FREE *$50 to start (withdrawable)
- ✓ Deposit bonus up to $5,000
- ✓ Negative balance protection
Trading forex and CFDs carries a significant risk of loss and is not suitable for everyone. Broker links are affiliate links — we may earn a commission at no cost to you.
Free MT4 Indicator Download

Enter Your Email Address below, download link will be sent to you.