

Last updated: August 31, 2026 · By: Tim Morris
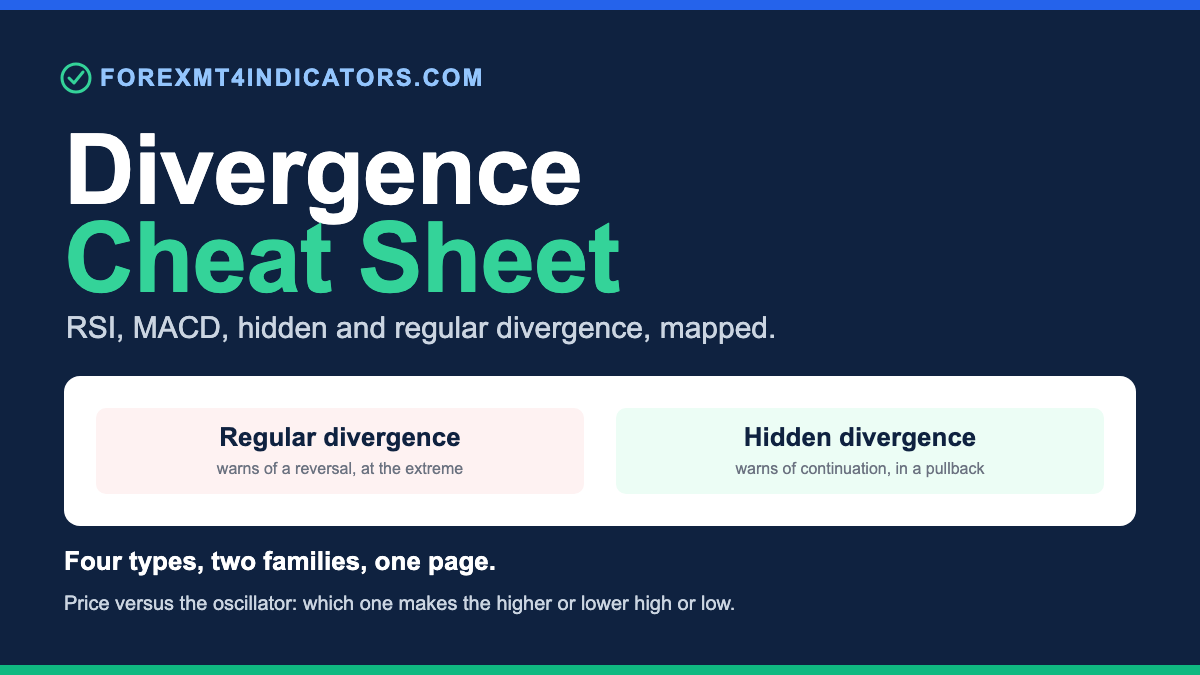
A divergence cheat sheet is a quick-reference map of the four ways price and a momentum oscillator (RSI, MACD, Stochastic) disagree. Regular divergence warns of a reversal; hidden divergence warns of a continuation. Each has a bullish and bearish form, defined by whether price and the oscillator make higher or lower highs and lows.
What is divergence in trading?
Divergence happens when price and a momentum oscillator point in different directions. Price makes a new high, but the oscillator makes a lower one. That gap between what price does and what momentum confirms is the whole idea.
The logic is that momentum leads price at turns. When a fresh high prints on weaker momentum, fewer buyers are pushing each new tick, and the move may be tiring. Divergence reads that fatigue before the candle chart shows it plainly.
Two families exist, and traders mix them up constantly. Regular divergence hints that the current trend is running out of fuel and could reverse. Hidden divergence hints the opposite: a pullback is ending and the trend is about to resume.
The oscillator you read this on matters less than reading it correctly. We use RSI 14, MACD 12/26/9, or a slow Stochastic, and the four-type map below is identical across all of them. Get the map wrong and you will fade a trend that is about to continue, or hold through a reversal you were warned about.
Regular divergence (the reversal signal)
Regular divergence appears at the end of a trend and warns that a reversal may be near. It shows up when price pushes to a new extreme but the oscillator refuses to follow. That refusal is the tell.
Bullish regular divergence forms at a bottom. Price prints a lower low, but the oscillator prints a higher low. Sellers drove price to a fresh floor, yet downside momentum was weaker on that second push, which hints the move down is exhausting and price may turn up.
Bearish regular divergence forms at a top. Price prints a higher high, but the oscillator prints a lower high. Buyers reached a new ceiling on thinner momentum, a warning the uptrend could roll over.
Regular divergence tends to work, not always, when it lines up with a level that already matters: a prior swing, a round number, a session high. On its own it is a heads-up, not a trade.
The failure mode to respect: strong trends print regular divergence repeatedly and keep going. A trending pair can show three bearish divergences on the way up and reverse on none of them. This is why counting on regular divergence in a hard trend, with no confirmation, empties accounts.
Hidden divergence (the continuation signal)
Hidden divergence appears during a pullback inside an existing trend and hints the trend will resume. It is the mirror image of regular divergence, and it is the one most retail traders never learn.
Bullish hidden divergence forms in an uptrend pullback. Price makes a higher low, but the oscillator makes a lower low. The trend structure is still up (higher low), while the oscillator’s deeper dip shows the pullback flushed out momentum, often setting up the next leg higher.
Bearish hidden divergence forms in a downtrend pullback. Price makes a lower high, but the oscillator makes a higher high. Price structure is still down (lower high), and the oscillator’s push suggests the bounce is a pause, not a bottom.
The plain way to keep them apart: regular divergence is read at the trend’s extremes and points at a reversal; hidden divergence is read during a retracement and points at continuation. If you know whether price is at a fresh extreme or inside a pullback, you already know which family you are looking at.
Hidden divergence pairs naturally with trend-following. In an uptrend you wait for a pullback, watch for a higher low in price against a lower low in the oscillator, then look to join the trend rather than fight it.
The divergence cheat sheet
Here is the four-row reference. Every cell below is the definition, not a suggestion, so read the price column and the oscillator column together.
| Type | Price makes | Oscillator makes | Signal |
|---|---|---|---|
| Bullish regular | Lower low | Higher low | Possible reversal up (at a bottom) |
| Bearish regular | Higher high | Lower high | Possible reversal down (at a top) |
| Bullish hidden | Higher low | Lower low | Trend continuation up (uptrend pullback) |
| Bearish hidden | Lower high | Higher high | Trend continuation down (downtrend pullback) |
Notice the symmetry. Regular and hidden are exact swaps: in bullish regular, price makes the lower low; in bullish hidden, the oscillator makes the lower low. The word that flips between the price and oscillator columns tells you which family you are in.
We keep a printable version of this table taped near the desk while the pattern is still becoming second nature. A clean one-page PDF of this cheat sheet is available by email request if you want the same reference for your own screen.
Which oscillator should you use?
Any bounded or centered momentum oscillator can show divergence. The three we reach for are RSI, MACD, and Stochastic, and each reads slightly differently.
RSI 14 is the default for divergence and the easiest to read. On H1 and H4 the period-14 setting gives clean swing highs and lows to compare against price. Dropping to period 9 makes RSI whip around and fire far more questionable divergences on intraday noise, so we leave it at 14.
MACD 12/26/9 shows divergence on either the MACD line or the histogram. The histogram reacts faster and is the usual choice for spotting momentum fading into a high. Our MACD divergence indicator for MT4 marks these automatically so you are comparing the right swings.
Stochastic (a slow 14/3/3, say) tends to fire the most signals of the three because it swings fast and hits its extremes often. That sensitivity means more false divergences, so we treat Stochastic divergence as a lower-conviction read unless structure agrees. The related stochastic momentum index smooths some of that noise.
None of the three is more accurate in a way that survives testing. Pick one, learn how it prints divergence on your pairs and timeframes, and stay consistent instead of switching every time a signal disappoints.
How to trade a divergence
Divergence is a warning, not a trigger. It tells you a move may be tiring or a pullback may be ending; it does not tell you to click buy or sell on the spot. Acting on the divergence alone, before price confirms, is the most common way it loses money.
Wait for confirmation from the candles or structure. After bullish regular divergence at a bottom, we want a reversal candle (an engulfing or a clean rejection wick) or a break of the most recent minor lower high before entering. Price agreeing is the trigger; the divergence was only the setup.
Timeframe changes reliability. Divergence on H1 and H4 filters out most of the noise and gives swings worth comparing. On M5, the oscillator makes so many small highs and lows that “divergence” prints constantly and most of it means nothing.
Place the stop where the idea is wrong, not at an arbitrary distance. For bullish regular divergence, that is below the price low that formed the divergence: if price takes out that low, the reversal read has failed and you want out.
The strongest divergences stack confluence. A bullish regular divergence that also sits at a prior support level, on an oversold RSI, with the higher timeframe already turning up, is worth far more than the same divergence floating in open space. One divergence is a hint; three reasons pointing the same way is a setup you can size.
On gold (XAU/USD), lean on the higher timeframes. Gold’s large intraday range throws off oscillators badly on lower charts, so we read divergence on H4 or the daily and confirm with structure before acting. Size positions for gold’s range, not a major pair’s, and give the trade room in price terms per ounce rather than borrowing a pip-based stop from EUR/USD.
Common mistakes traders make
- Trading divergence as a trigger. The single biggest error. Divergence is a condition, not an entry. Without a confirming candle or structure break you are guessing at the turn and will get run over in trends.
- Ignoring the trend. Fading a strong trend on regular divergence, over and over, is how accounts bleed out. In a persistent trend, favour hidden divergence (continuation) and be slow to call reversals.
- Using it on M5 noise. Lower timeframes spray false divergences. If you are learning, work H1 and H4 first, where a divergence actually means momentum is shifting.
- Confusing regular and hidden. Reading a continuation setup as a reversal (or the reverse) puts you on the wrong side entirely. Check first whether price is at a fresh extreme (regular) or inside a pullback (hidden).
- Demanding no confirmation. “The oscillator diverged” is not a reason to be in a trade by itself. No confirmation, no position.
- Switching oscillators to find a signal. Flipping from RSI to Stochastic to MACD until one shows the divergence you want is curve-fitting your own bias. Pick one and hold it.
Indicators that mark divergence automatically
Spotting divergence by eye is a skill, and marking it by hand across dozens of pairs is slow. Automated divergence tools scan for the higher/lower highs and lows on price against the oscillator and draw the connecting lines for you.
Our MT4 divergence indicator flags regular and hidden divergence on the RSI and MACD directly on the chart, so you are not squinting at two panels trying to line up swings. The MT5 divergence indicator does the same on MetaTrader 5.
Treat these as a scanner, not an oracle. They mark where the price-versus-oscillator disagreement exists; you still decide whether the trend, the level, and the confirming candle justify a trade.
Watch for repainting. Some divergence indicators redraw their lines after the fact once a swing completes, which makes their history look far cleaner than what you would have traded live. Before trusting any of them, replay the chart bar by bar and check whether a signal that shows now was actually there when that candle closed.
Frequently asked questions
What is the difference between regular and hidden divergence?
Regular divergence signals a possible reversal and is read at the trend’s extremes: price makes a new high or low that the oscillator does not confirm. Hidden divergence signals continuation and is read during a pullback: price holds its trend structure while the oscillator overshoots. Same tool, opposite meaning.
Which is the best oscillator for spotting divergence?
RSI 14 is the most common and the easiest to read cleanly on H1 and H4. MACD 12/26/9 works well on its histogram, and Stochastic fires more often but with more false signals. None tests as reliably more accurate; consistency with one beats switching between all three.
Can I trade divergence on the 5-minute chart?
You can, but the noise is heavy. On M5 the oscillator prints so many minor swings that false divergences appear constantly. We get far cleaner setups on H1 and H4, where a divergence more often reflects a genuine shift in momentum rather than intraday chop.
Does divergence work on gold (XAU/USD)?
It does, on higher timeframes. Gold’s large daily range distorts oscillators on lower charts, so we read divergence on H4 or the daily and always confirm with structure first. Size for gold’s range and think in price distance per ounce, not a pip stop copied from a major.
Why did price keep trending after a clear divergence?
Because divergence is a warning, not a guarantee, and strong trends print it repeatedly while continuing. A trend can show several regular divergences and reverse on none of them. That is exactly why you wait for a confirming candle or structure break before acting, and keep a stop where the idea is wrong.
Do divergence indicators repaint?
Some do. An indicator that redraws its divergence lines after a swing completes will show a tidier history than you could have traded live. Do not trust a “no repaint” label without checking. Replay the chart bar by bar and confirm the signal existed at the candle’s close.
Trading forex and CFDs carries a high level of risk and is not suitable for everyone. Most retail traders lose money. Nothing here is financial advice; it is educational content only. Always do your own analysis and never risk money you cannot afford to lose.
Ready to put this into practice?
Open an account with a regulated broker and apply what you have learned. These are the three brokers we recommend:
Trading forex and CFDs carries a significant risk of loss and is not suitable for everyone. Broker links are affiliate links — we may earn a commission at no cost to you.