

The Future Volume Indicator MT4 helps traders look beyond price by displaying market activity through volume analysis. While forex brokers provide tick volume instead of centralized exchange volume, many traders still use it to judge buying and selling pressure. When combined with trend analysis and support or resistance, the indicator can improve trade timing and filter weak setups.
Here’s where this tool becomes useful. Instead of reacting to every price movement, traders can compare volume changes with market structure before making a trading decision.
Understanding the Future Volume Indicator MT4
The Future Volume Indicator MT4 is a technical analysis tool designed to display changes in trading activity using tick volume data. Since the forex market has no centralized exchange, MT4 measures the number of price updates rather than actual traded contracts. Even so, experienced traders often find that tick volume closely reflects market participation during active sessions.
The indicator usually appears as a histogram beneath the price chart. Taller bars suggest increased market activity, while shorter bars indicate slower trading conditions. Some versions also change colors to highlight buying or selling pressure, making it easier to identify momentum shifts.
What makes this indicator different? It doesn’t predict the future despite its name. Instead, it helps traders estimate whether current price movement has enough participation to continue or if the move may lose strength.
How the Indicator Works in Live Market Conditions
The indicator compares current tick volume with previous bars and displays the difference visually. Rising volume during a breakout often shows that more traders are participating, which increases the chance that the move has real momentum. Falling volume after a sharp rally can signal that buyers are becoming less active.
For example, EUR/USD on the 1-hour chart breaks above resistance at 1.1080. During the breakout candle, the volume histogram rises nearly 35% above its average over the previous 20 candles. A trader waits for the next candle to close above resistance before entering long. The trade reaches a 55-pip target while volume remains elevated throughout the move.
The opposite situation can also occur. GBP/USD may push above resistance during the Asian session with very low volume. That often leads to a fake-out because fewer market participants are involved. Waiting for stronger volume during the London open can reduce unnecessary entries.
When testing this on volatile NFP days, many traders notice sudden spikes in volume during the news release. But those spikes can also produce rapid whipsaws. Waiting for the first 15 to 30 minutes after the announcement often provides a cleaner setup.
Trading forex carries substantial risk. No indicator guarantees profits.
Using the Future Volume Indicator MT4 in Trading
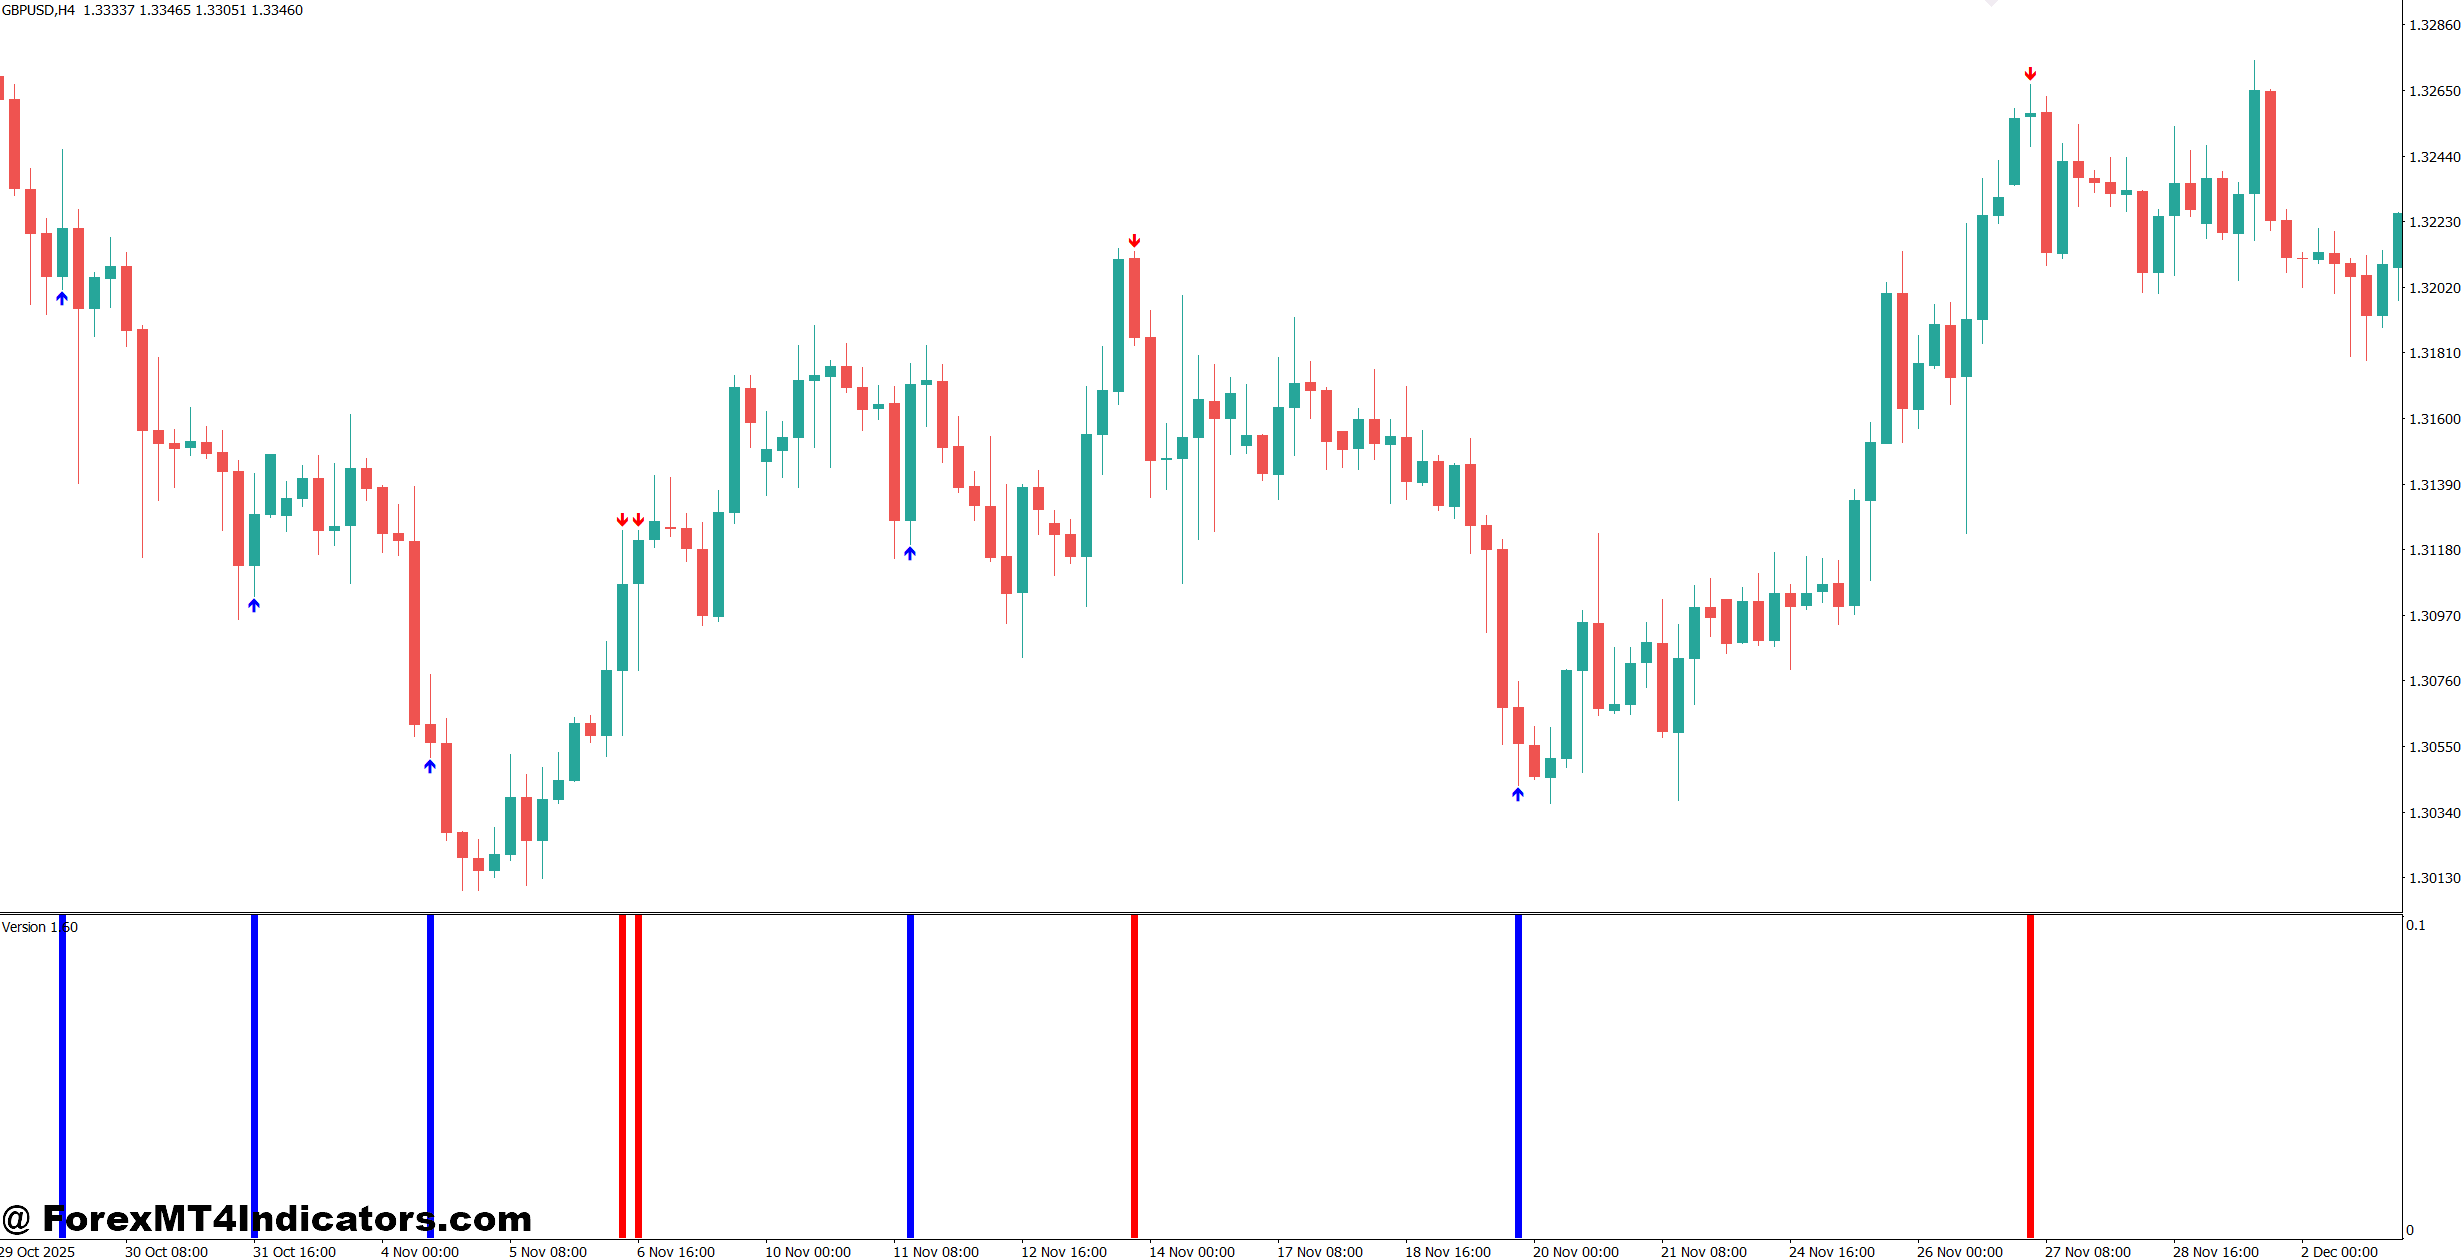
Trend Confirmation
Many traders combine the indicator with moving averages. If the 50-period EMA points upward and volume increases during bullish pullbacks, buyers usually have stronger control of the market. This creates a higher-quality setup than price movement alone.
Breakout Validation
Breakouts work better when supported by increased volume.
Imagine USD/JPY trading inside a 45-pip range for several hours. Once price closes above resistance with volume rising at least 25% above recent average activity, traders gain extra confidence that the breakout has genuine momentum instead of being another fake-out.
Reversal Analysis
Volume can also expose weakening trends.
Suppose AUD/USD forms higher highs while the volume histogram gradually declines. That doesn’t automatically mean price will reverse, but it warns that buying pressure is slowing. Traders often wait for bearish candlestick confirmation before considering short positions.
Best Trading Sessions
The indicator generally performs better during high-liquidity sessions.
The London and New York sessions usually produce stronger volume readings than the quieter Asian session. During low-volume periods, price often moves sideways, making volume signals less reliable.
Settings, Customization, and Comparison with Other Indicators
Most versions of the Future Volume Indicator MT4 require very little adjustment, although traders can customize smoothing periods, histogram colors, or alert settings depending on the indicator version.
A practical starting point includes:
- Scalping (M5-M15): shorter smoothing period between 10 and 14.
- Intraday trading (M30-H1): default settings usually perform well.
- Swing trading (H4-Daily): smoothing between 20 and 30 can reduce market noise.
The indicator works well on major currency pairs such as EUR/USD, GBP/USD, USD/JPY, and XAU/USD because these markets generally produce more consistent trading activity.
Compared with the standard MT4 Volumes indicator, the Future Volume Indicator often presents volume shifts more clearly, helping traders recognize changes in momentum faster. Unlike the On Balance Volume (OBV) indicator, which combines price direction with cumulative volume, this tool focuses mainly on current trading activity. It also differs from the Money Flow Index because it doesn’t calculate overbought or oversold conditions.
That said, no volume indicator should replace price action analysis. Support and resistance levels, trend direction, and risk management still carry more weight than volume alone.
Strengths and Limitations
The Future Volume Indicator MT4 offers several practical advantages. It helps confirm breakouts, highlights periods of strong market participation, and gives traders another way to measure momentum. It also works well alongside moving averages, trendlines, and candlestick patterns instead of competing with them.
Still, traders should understand its limits. Forex volume is based on tick activity rather than centralized exchange transactions. During holidays or low-liquidity sessions, volume readings may not accurately reflect broader market interest. Strong economic news can also create temporary spikes that disappear within minutes.
Experienced traders rarely enter a position based only on volume. They look for agreement between market structure, trend direction, support or resistance, and volume before committing capital.
How to Trade with Future Volume Indicator MT4
Buy Entry
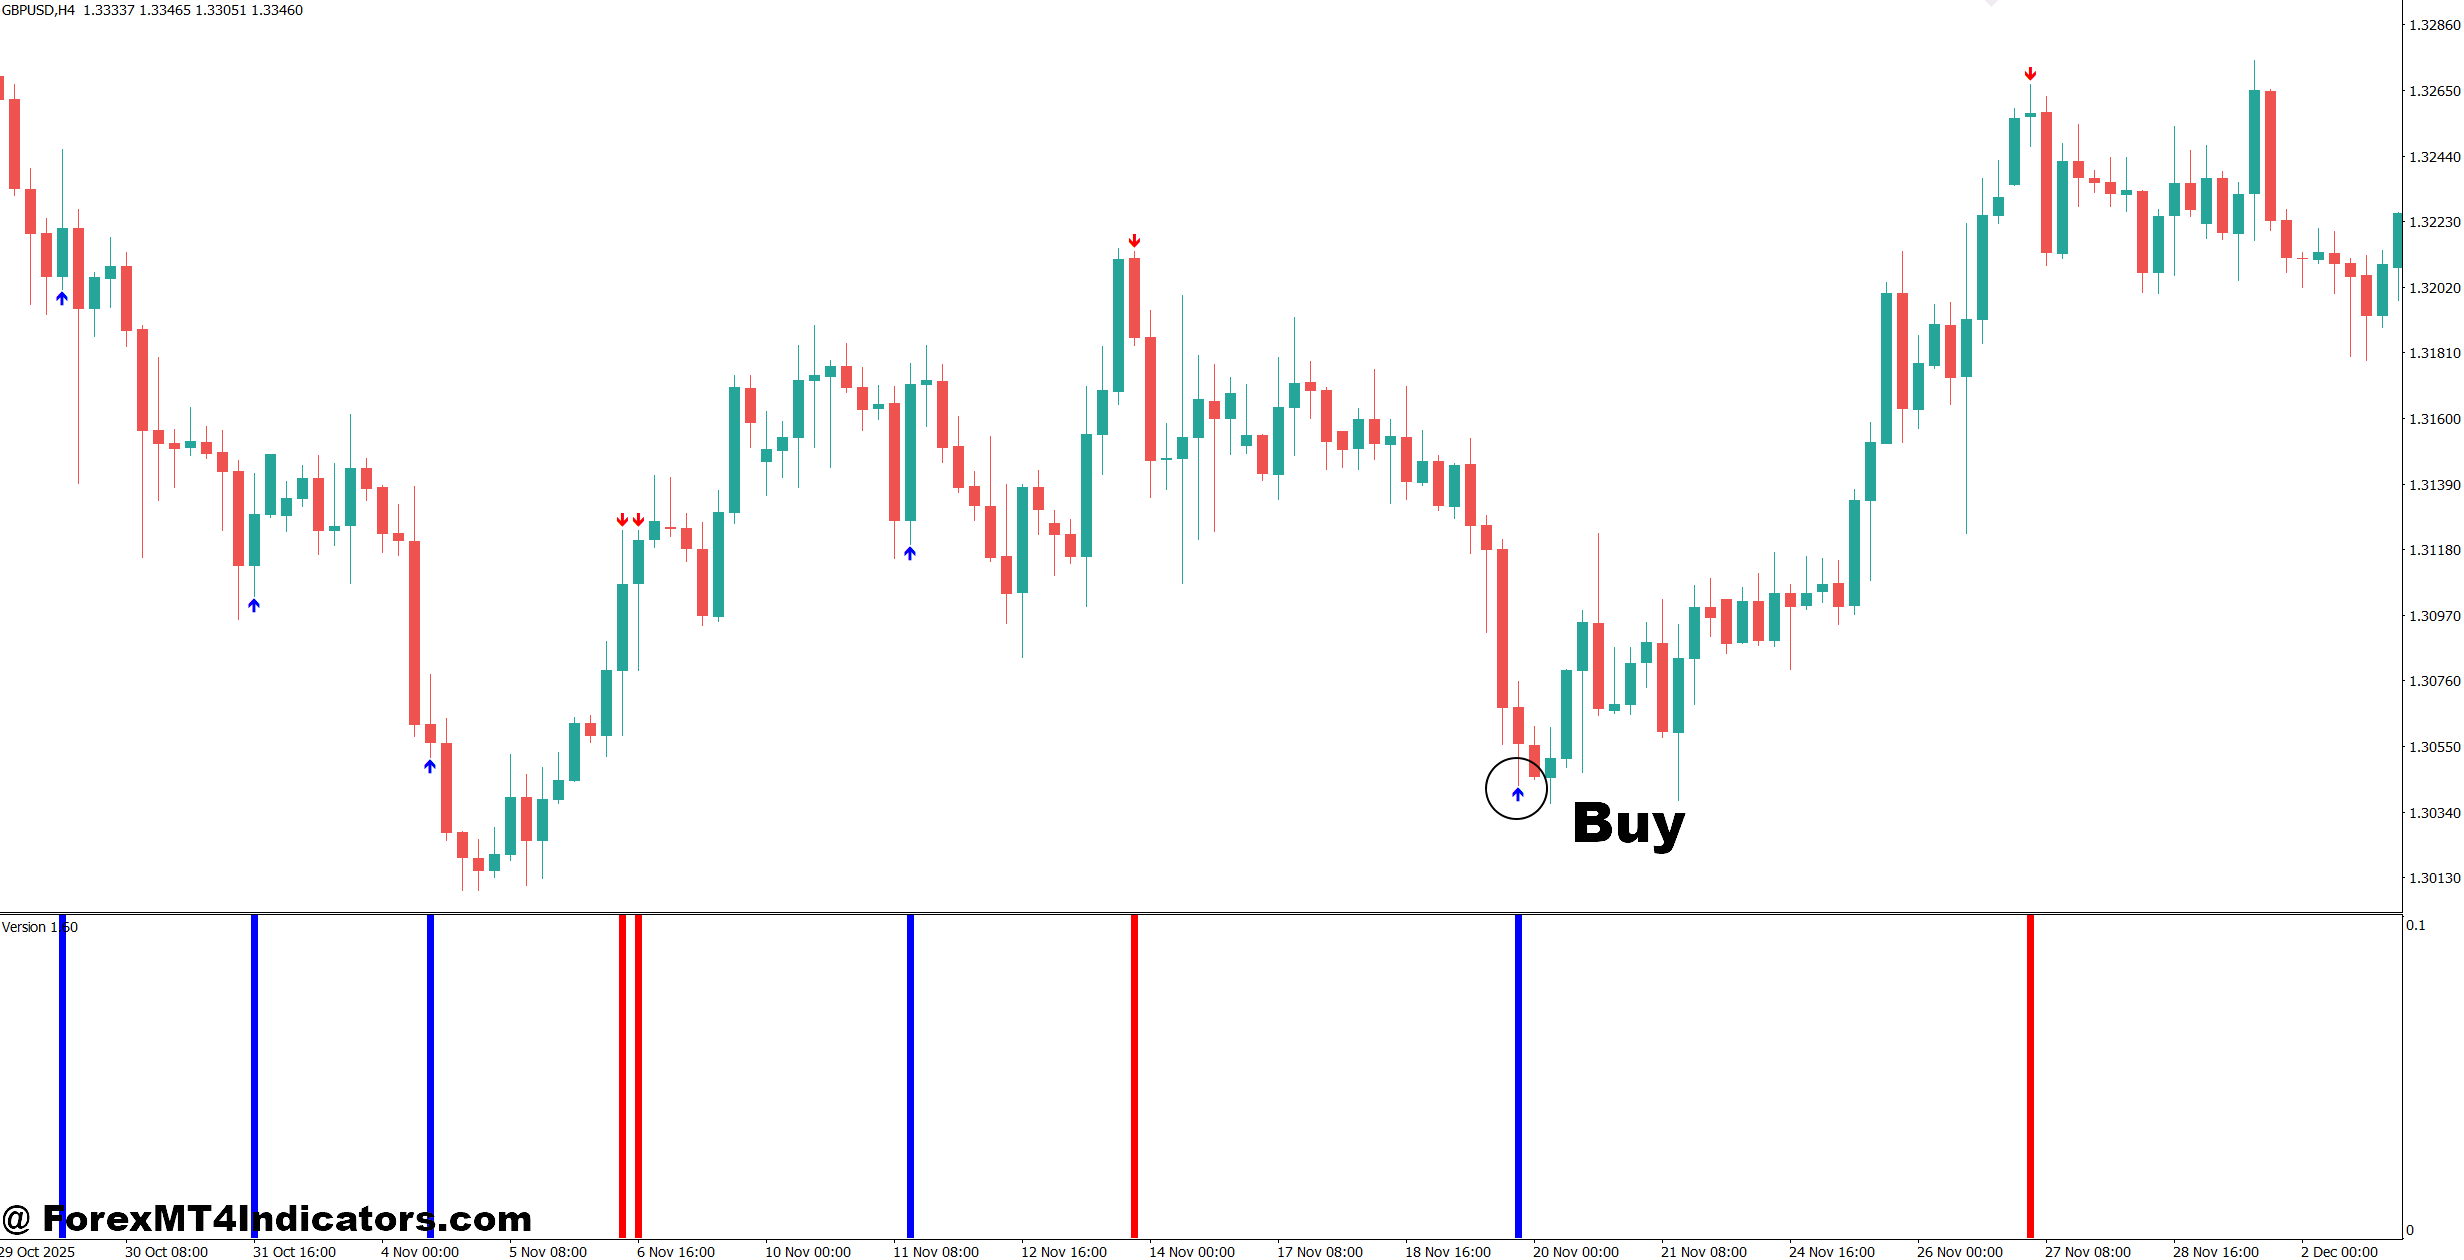
- Buy on volume breakout – Enter when volume rises 25%+ above average and EUR/USD (1-hour) closes above resistance. Target 40-60 pips.
- Trade bullish pullbacks – Buy after a retracement to the 20 EMA if volume starts increasing again. Place a 20-30 pip stop-loss.
- Confirm with higher timeframe – Take buy trades only when the 4-hour trend is bullish and the 1-hour shows rising volume.
- Enter after strong support bounce – Buy when GBP/USD rejects support with higher volume. Aim for 50 pips.
- Wait for candle close – Enter only after the breakout candle closes with strong volume to avoid fake-outs.
- Risk only 1-2% per trade – Keep position size small even when volume signals look strong.
- Avoid low-volume sessions – Skip buy entries during quiet market hours when volume stays below recent average.
- Ignore news spikes – Don’t buy immediately after major news if volume jumps without a confirmed trend.
Sell Entry
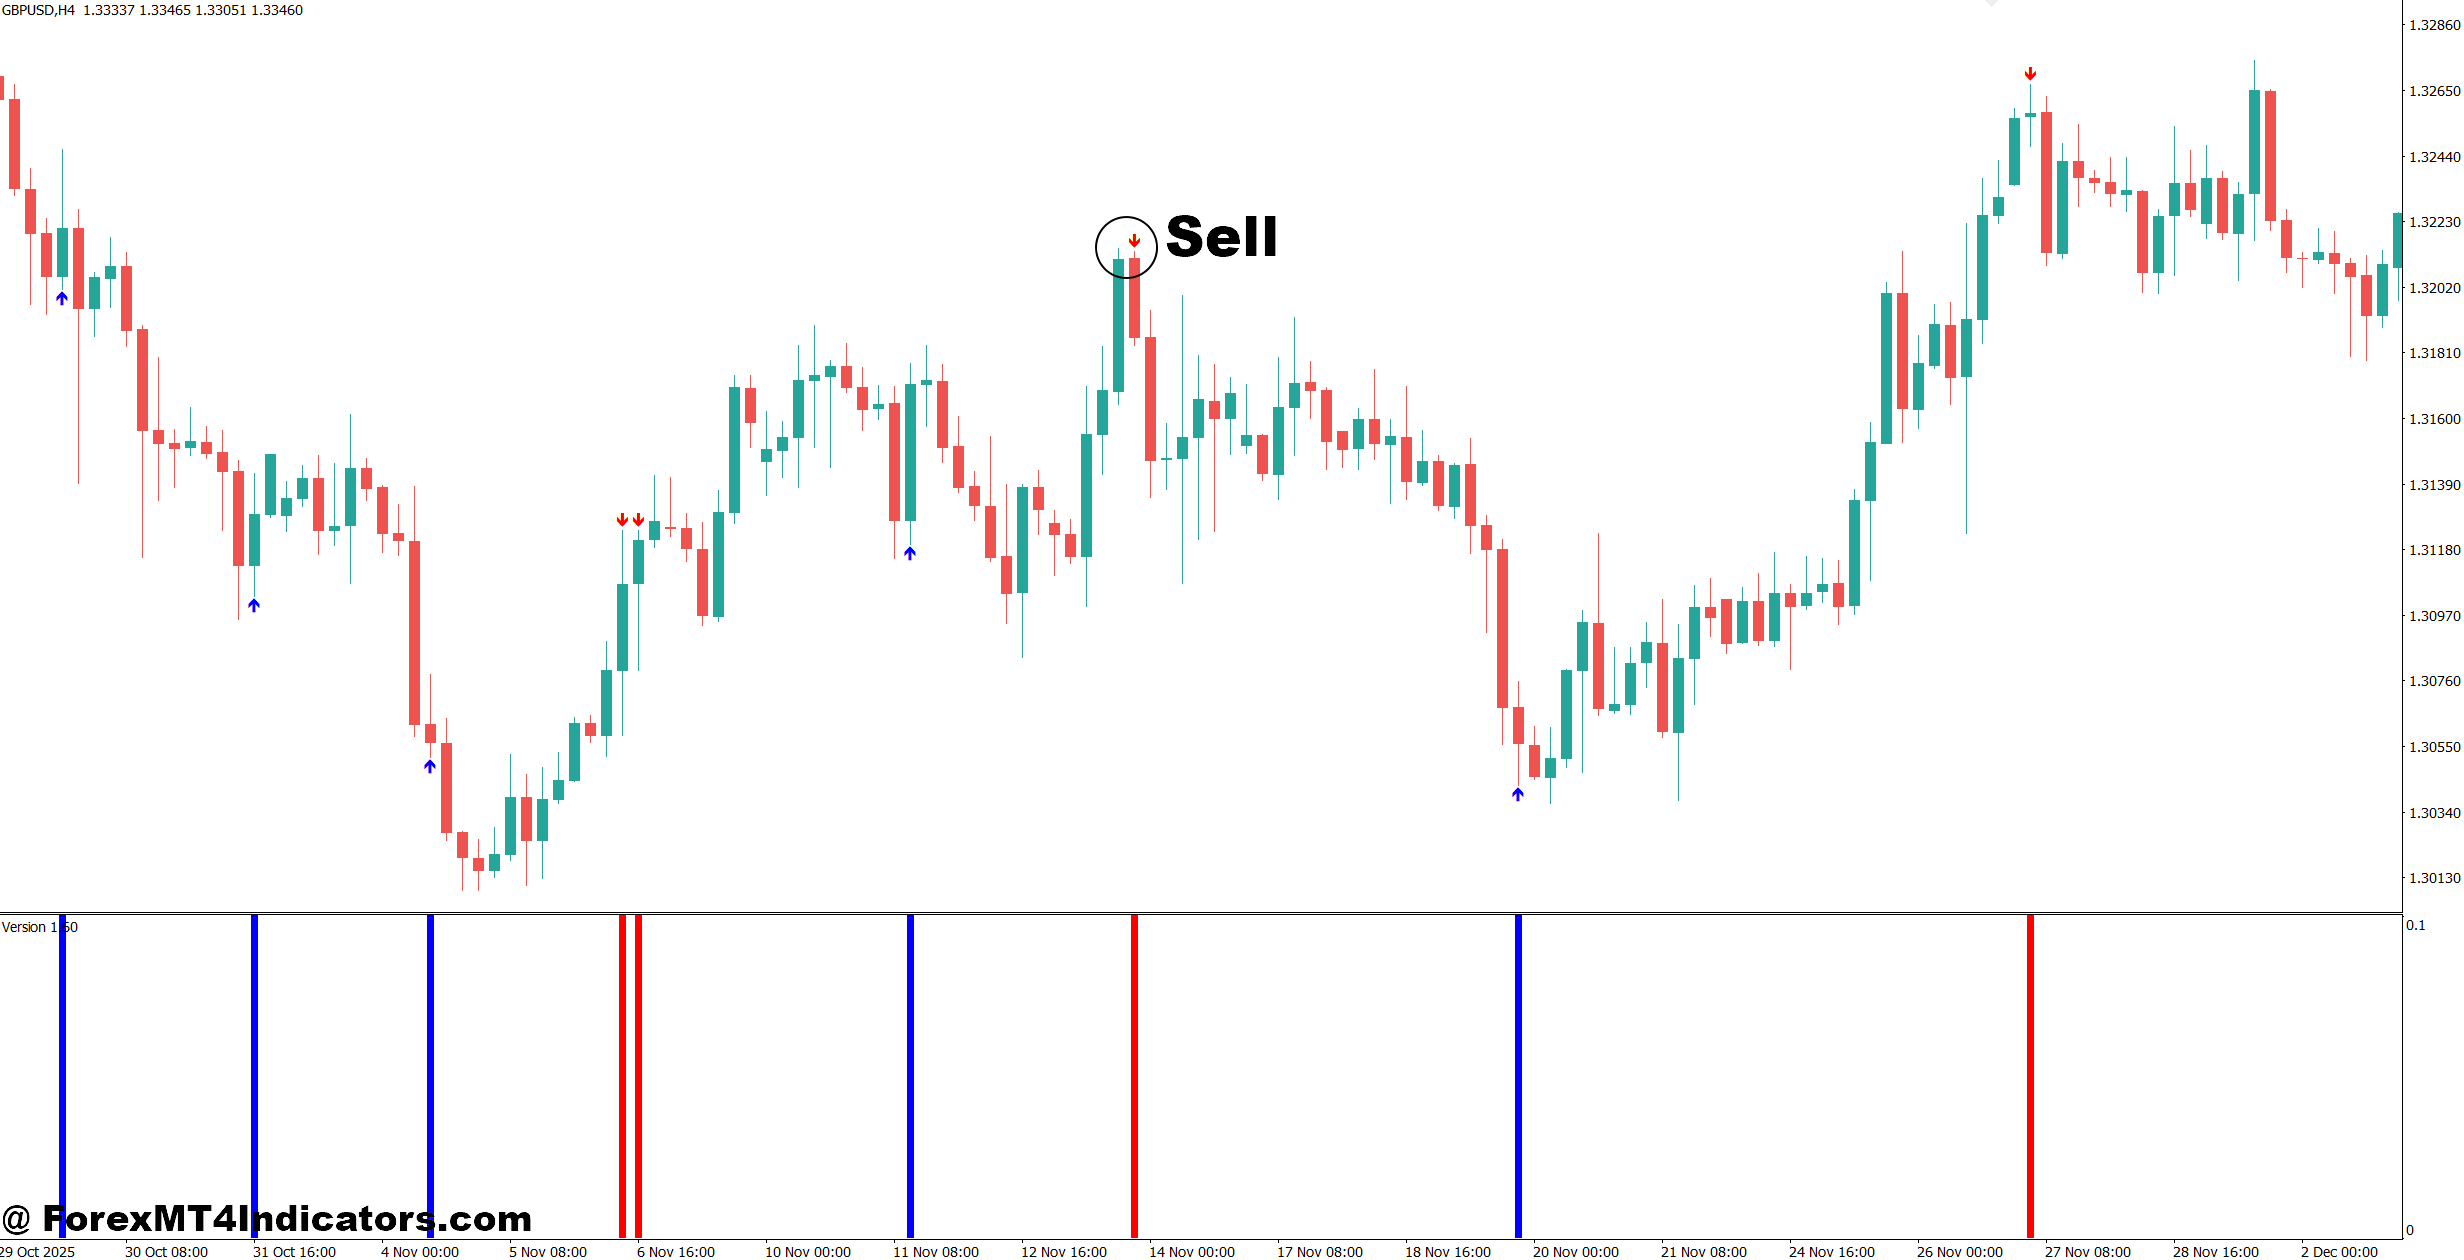
- Sell on high-volume breakdown – Enter when volume increases 25%+ as EUR/USD (1-hour) closes below support. Target 40-60 pips.
- Trade bearish pullbacks – Sell after price retests the 20 EMA while volume rises on bearish candles. Use a 20-30 pip stop-loss.
- Follow the higher timeframe – Take sell trades only if the 4-hour chart remains in a downtrend.
- Sell from resistance rejection – Enter on GBP/USD after a bearish rejection candle with above-average volume. Target 50 pips.
- Wait for breakout confirmation – Avoid selling before the candle closes below support with strong volume.
- Limit risk to 1-2% – Protect trading capital by keeping every trade within proper risk limits.
- Skip weak volume signals – Don’t sell if price breaks support but volume remains below average.
- Avoid choppy markets – Stay out when the daily chart moves sideways and volume shows no clear increase.
The Future Volume Indicator MT4 gives traders another layer of information that price charts alone cannot provide. It helps identify stronger breakouts, confirms trend momentum, and warns when market participation begins to fade. The biggest lessons are simple: combine volume with price action instead of using it alone, pay close attention during active trading sessions, and always manage risk with stop-loss orders and sensible position sizing. No single indicator can predict every market move, but this tool can improve decision-making when used with a disciplined trading plan. Traders who spend time testing it on a demo account across different currency pairs and timeframes will better understand where it performs well and where extra caution is needed.
Level up your trading
Learn to read the chart — not just the indicator
eBook · Instant PDF
Video Course · 12 modules
Recommended MT4/MT5 Brokers
- ✓ *FREE *$50 to start (withdrawable)
- ✓ Deposit bonus up to $5,000
- ✓ Negative balance protection
Trading forex and CFDs carries a significant risk of loss and is not suitable for everyone. Broker links are affiliate links — we may earn a commission at no cost to you.
Free MT4 Indicator Download

Enter Your Email Address below, download link will be sent to you.