

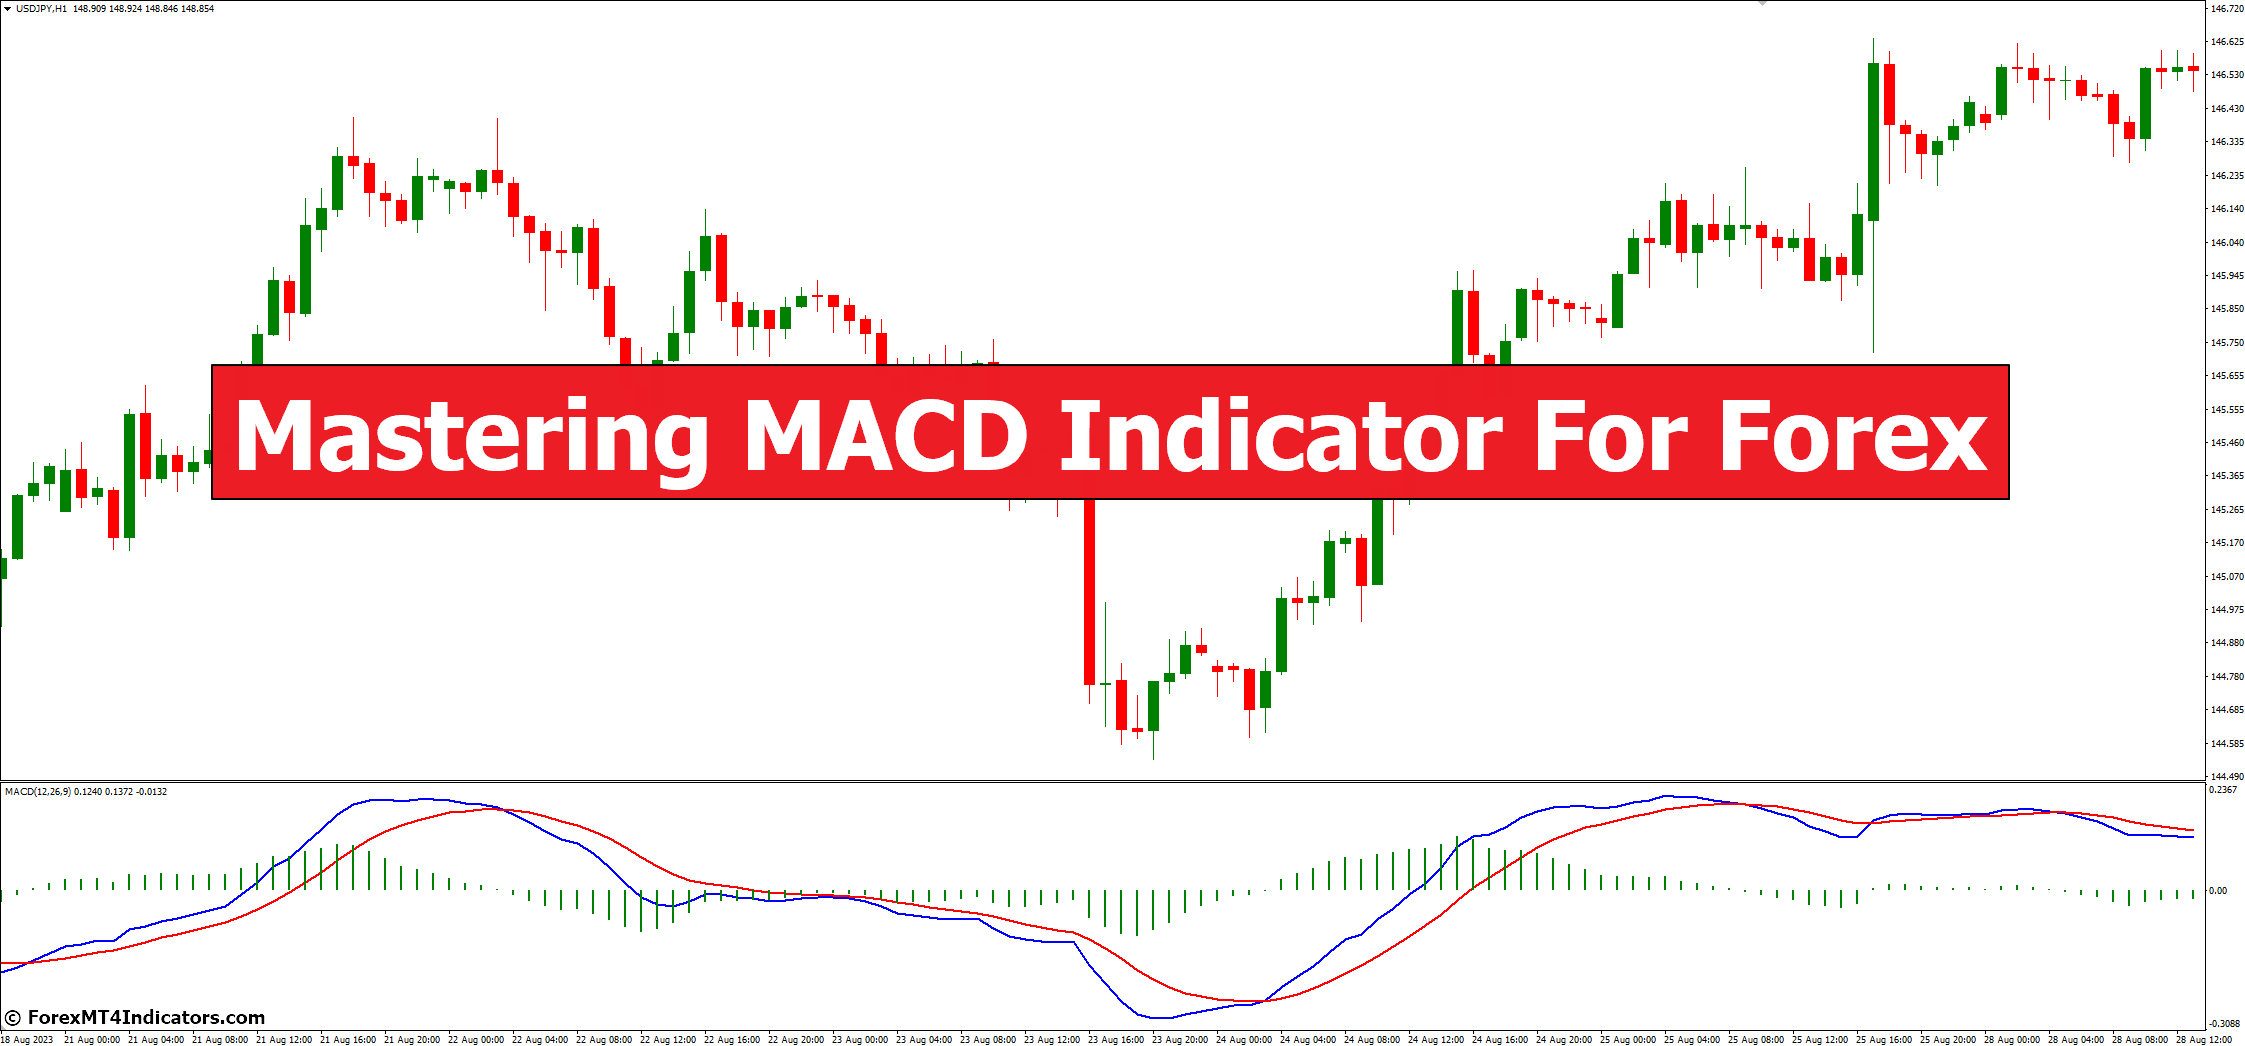
Last updated:
The MACD (Moving Average Convergence Divergence) is a trend-following momentum indicator built from three parts: the MACD line (12-period EMA minus 26-period EMA), the signal line (a 9-period EMA of the MACD line), and the histogram (MACD line minus signal line). Developed by Gerald Appel in the late 1970s, it reads momentum from crossovers, the zero line, and divergence.
Key takeaways
- MACD has exactly three components. The MACD line, the signal line, and the histogram. Everything you read on a MACD chart comes from those three, and each is derived from the same 12/26/9 moving averages.
- The default settings are 12, 26, 9. That is the fast EMA, the slow EMA, and the signal-line EMA. They have been the standard since Appel designed them, and there is little reason to change them on H1 or H4.
- MACD is lagging, not predictive. It averages past prices, so it confirms momentum after a move begins. Treat a crossover as confirmation, not a forecast of the next candle.
- The histogram is momentum’s early warning. It shrinks before a crossover happens, so a fading histogram often signals a slowing move earlier than the lines crossing do.
- MACD pairs best with a trend filter, not with another oscillator. On its own it whipsaws in ranges. Combined with structure or a moving average, it becomes a clean momentum confirmation.
What is the MACD indicator?
MACD stands for Moving Average Convergence Divergence, and the name describes exactly what it does: it tracks how two moving averages converge (move together) and diverge (pull apart). When they pull apart, momentum is building. When they converge, momentum is fading.
It is classed as a trend-following momentum indicator — a hybrid. It borrows direction from moving averages and reads momentum from how fast those averages separate. That dual nature is why it sits on so many charts across forex, gold, and indices.
Gerald Appel created MACD in the late 1970s for the stock market. The design has barely changed since, which tells you something: a 40-plus-year-old tool that still ships as a default on every MT4 and MT5 install is not a fad. It is one of a handful of indicators worth learning first.
MACD is one of the most-used momentum tools in retail forex, alongside RSI. Both measure momentum, but they read it differently — more on that below.
The 3 parts of the MACD indicator
Every MACD reading comes from three components. Understand how each is calculated and the whole indicator stops being a mystery.
The MACD line
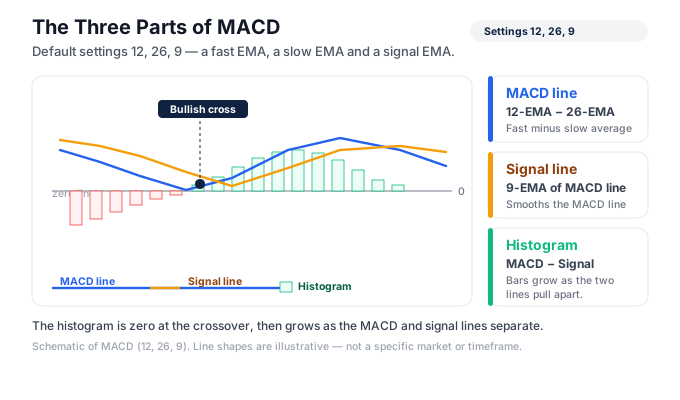
The MACD line is the 12-period EMA minus the 26-period EMA. (An EMA, or Exponential Moving Average, is a moving average that weights recent prices more heavily.) When the fast 12-EMA is above the slow 26-EMA, the MACD line is positive; when it is below, the line is negative.
This line is the fast-moving part of the indicator. It reacts first because the 12-EMA responds quickly to new price. Think of it as the momentum reading itself — how far, and in which direction, the short-term average has pulled away from the long-term one.
The signal line
The signal line is a 9-period EMA of the MACD line — a moving average of a moving-average difference. Because it smooths the MACD line, it lags slightly behind it. That lag is the whole point: it gives you a reference the faster MACD line can cross.
When the MACD line crosses above the signal line, momentum is turning up. When it crosses below, momentum is turning down. These crossovers are the most common MACD trade trigger, and they exist only because the signal line trails the MACD line.
The histogram
The histogram is the MACD line minus the signal line, drawn as bars around a zero baseline. When the two lines are far apart, the bars are tall. When they converge toward a crossover, the bars shrink toward zero.
The histogram is the most useful early-warning part of the indicator. Because it measures the distance between the lines, it starts shrinking before they actually cross. A histogram that is still positive but getting shorter every bar is momentum fading — often your first hint that a crossover is coming.
How to read MACD
MACD gives three readable signals: crossovers, the zero line, and divergence. Each answers a slightly different question.
Signal-line crossovers. The MACD line crossing above the signal line is a bullish signal; crossing below is bearish. This is the classic entry trigger. It works cleanly in trending conditions and whipsaws badly in flat, ranging markets, so it needs a trend filter.
The zero line. When the MACD line crosses above zero, the 12-EMA has moved above the 26-EMA — the short-term trend has flipped up. Below zero, the opposite. Zero-line crosses are slower than signal-line crosses but carry more weight, because they reflect an actual trend change rather than a momentary momentum wobble.
Divergence. Divergence is when price makes a new high (or low) but MACD does not. If price prints a higher high while the MACD histogram prints a lower high, momentum is not confirming the move — a possible reversal warning. Divergence is MACD’s highest-value signal and also its most abused; it flags potential exhaustion — never a certain reversal.
One honest caveat: MACD is a lagging indicator. It is built from moving averages, so it always confirms after price has already moved. That is fine — use it to confirm, never to predict the next candle.
Best MACD settings
The default MACD settings are 12, 26, 9: a 12-period fast EMA, a 26-period slow EMA, and a 9-period signal line. These are Appel’s original values and they remain the standard on H1 and H4 for good reason — they balance responsiveness against false signals.
Resist the urge to optimise. Traders spend hours tweaking MACD to 10/22/7 or 15/30/9 chasing a cleaner backtest, and almost always curve-fit to noise. The 12/26/9 default has survived four decades of use because it holds up across instruments, not because nobody tried to beat it.
If you scalp on M5 or M1, a faster setting (such as 5/13/6) reacts sooner, but it fires far more false crossovers, so the spread cost eats the extra signals. For most retail traders on H1 and H4, leave the settings alone and put your energy into risk management instead.
On XAU/USD (gold), the 12/26/9 default still works, but gold’s larger daily range and frequent wicks produce more histogram noise than EUR/USD. Many gold traders treat MACD crossovers as confirmation only after price also breaks structure, rather than acting on the crossover alone — gold’s volatility keeps momentum readings jumpy.
MACD trading strategies (in brief)
MACD is a confirmation tool, not a complete system on its own. The reliable way to use it is to let a trend filter set direction, then use MACD to time entries in that direction.
The simplest approach: trade signal-line crossovers only in the direction of the higher-timeframe trend. In an uptrend, take bullish crossovers and ignore bearish ones. In a downtrend, the reverse. This one rule removes most of the whipsaw that ruins MACD for beginners.
Divergence is the other core MACD play — spotting momentum fading against price before a reversal. It rewards patience and punishes traders who act on every divergence, because many divergences resolve by continuing the trend, not reversing it.
For the full setup — entry rules, stop placement, and how to filter out the false divergences — see our dedicated MACD trading strategy guide. This page is the explainer; that page is the system.
MACD vs RSI
MACD and RSI are the two most common momentum indicators, and traders constantly ask which to use. They measure momentum differently, so they answer different questions.
RSI (Relative Strength Index) is a bounded oscillator on a 0-100 scale. It tells you whether a market is overbought (above 70) or oversold (below 30) — a relative momentum reading. It is best for judging whether a move is stretched. Our RSI guide covers its settings in depth.
MACD is unbounded and trend-aware. It tells you the direction and strength of momentum relative to the recent trend, through crossovers and the zero line. It is better for confirming a trend and timing entries within it.
The practical answer: they are not rivals. RSI answers “is this move overextended?” and MACD answers “is momentum turning with the trend?” Many traders run both — but if you must pick one, use MACD when you trade with the trend and RSI when you trade pullbacks and ranges. You can download the MACD indicator and dozens of others free to test both on your own charts.
Frequently asked questions
What is the MACD indicator?
MACD (Moving Average Convergence Divergence) is a trend-following momentum indicator that tracks the relationship between two exponential moving averages. It has three parts: the MACD line (12-EMA minus 26-EMA), the signal line (9-EMA of the MACD line), and the histogram (the gap between them). Developed by Gerald Appel in the late 1970s, it reads momentum through crossovers, the zero line, and divergence.
What is the difference between the MACD line and the signal line?
The MACD line is the 12-period EMA minus the 26-period EMA — the fast-moving part that reacts first to price. The signal line is a 9-period EMA of the MACD line, so it is a smoothed, slower version that trails behind. When the faster MACD line crosses the slower signal line, you get the classic MACD crossover signal.
What is the MACD histogram?
The histogram is the MACD line minus the signal line, drawn as bars around a zero baseline. Tall bars mean the two lines are far apart (strong momentum); short bars mean they are converging toward a crossover. Because it measures the distance between the lines, the histogram shrinks before a crossover, giving you an early warning that momentum is fading.
What is the best MACD setting?
The default 12, 26, 9 is the best setting for most traders on H1 and H4 — a 12-period fast EMA, 26-period slow EMA, and 9-period signal line. These are Gerald Appel’s original values and they balance responsiveness against false signals. Scalpers on M5 sometimes use faster settings like 5/13/6, but they produce more false crossovers.
What is a MACD crossover?
A MACD crossover happens when the MACD line crosses the signal line. When it crosses above, momentum is turning bullish; when it crosses below, momentum is turning bearish. It is the most common MACD trade trigger. Crossovers work best in trending markets and give frequent false signals in flat, ranging conditions, so pair them with a trend filter.
Is MACD good for beginners?
Yes. MACD is one of the more beginner-friendly indicators because its signals are visual and simple — a crossover, a zero-line cross, or a fading histogram. The main beginner mistake is trading every crossover regardless of trend. Take crossovers only in the direction of the higher-timeframe trend and MACD becomes far more reliable.
What is the difference between MACD and RSI?
RSI is a bounded 0-100 oscillator that flags overbought (above 70) and oversold (below 30) conditions — good for spotting stretched moves. MACD is unbounded and trend-aware, showing momentum direction and strength through crossovers and the zero line — good for confirming trends and timing entries. Use MACD to trade with the trend and RSI to judge pullbacks and ranges.
What are the default MACD periods?
The default MACD periods are 12, 26, and 9: a 12-period exponential moving average (fast), a 26-period exponential moving average (slow), and a 9-period exponential moving average applied to the MACD line (the signal line). These have been the standard settings since Gerald Appel designed the indicator in the late 1970s.
Does MACD work on gold (XAU/USD)?
Yes, the standard 12/26/9 MACD works on gold, but XAU/USD’s larger daily range and frequent wicks create more histogram noise than forex pairs. Many gold traders treat MACD crossovers as confirmation only after price also breaks a structural level, rather than acting on the crossover alone, because gold’s volatility keeps momentum readings jumpy.
MACD is not a crystal ball — it is a clean, three-part reading of momentum built from the 12/26/9 moving averages. Learn what the MACD line, signal line, and histogram each measure, read the crossovers, zero line, and divergence for what they are, and pair the indicator with a trend filter instead of a second oscillator. Used that way, a 40-year-old default indicator still earns its place on the chart. Start with the forex basics if you are new, then layer MACD on top.
Forex and CFD trading carries a high level of risk and may not be suitable for all traders. The strategies and indicators described here are educational. Past performance does not guarantee future results. Always test on a demo account before risking real capital.
Ready to put this into practice?
Open an account with a regulated broker and apply what you have learned. These are the three brokers we recommend:
Trading forex and CFDs carries a significant risk of loss and is not suitable for everyone. Broker links are affiliate links — we may earn a commission at no cost to you.