

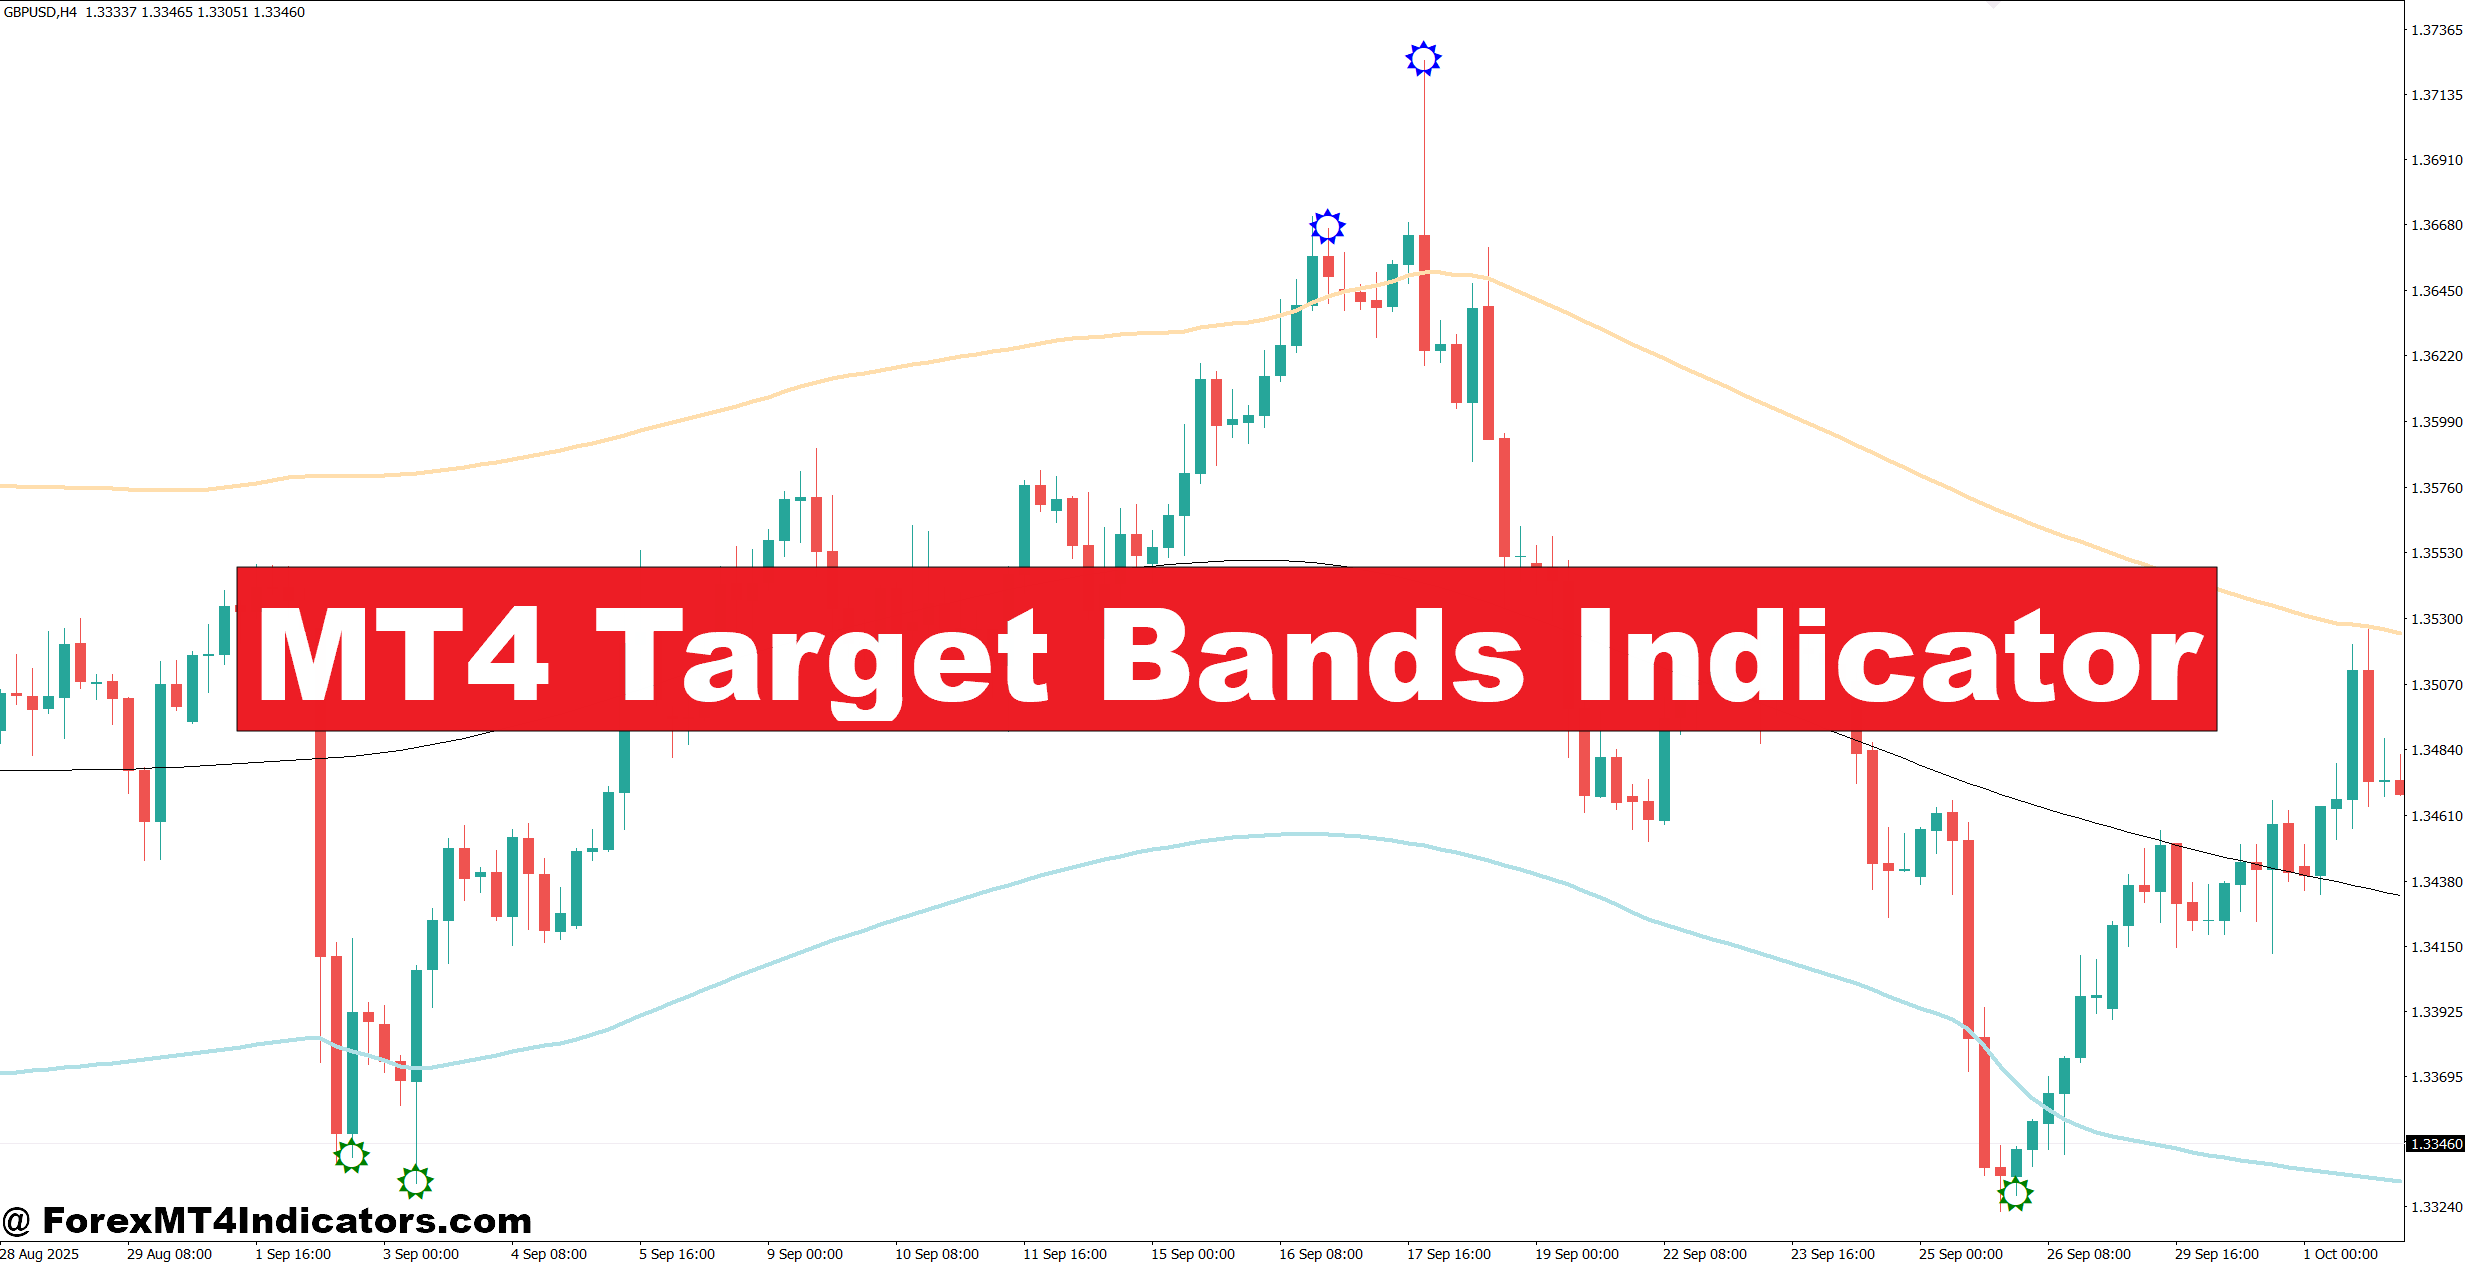
The MT4 Target Bands Indicator helps solve this problem by giving traders dynamic price bands that highlight potential profit targets and reversal zones. Instead of relying on guesswork, traders can use these projected levels to plan exits, manage trades, and understand where price may slow down. While no indicator predicts the future, Target Bands provide a structured approach that works well alongside trend analysis and support and resistance.
The sections below explain how this indicator works, when it performs best, and how traders can use it effectively in real market conditions.
What Is the MT4 Target Bands Indicator?
The MT4 Target Bands Indicator is a technical analysis tool that plots upper and lower price bands around current market action. These bands represent projected price zones based on recent volatility, trend strength, and historical price movement. Traders often use them to estimate where price could pause, reverse, or reach a reasonable profit target.
Unlike fixed support and resistance levels, the bands adjust as new price data forms. This makes them useful during trending markets where price continues making higher highs or lower lows.
Many traders combine Target Bands with moving averages or trend filters to improve trade selection. For example, if EUR/USD is trading above the 200-period Exponential Moving Average on the 1-hour chart, buying near the middle band while aiming for the upper target band can provide a logical trade plan.
The indicator works on nearly every currency pair, although major pairs like EUR/USD, GBP/USD, USD/JPY, and AUD/USD usually produce cleaner signals because of their higher liquidity.
How the MT4 Target Bands Indicator Works
The exact calculation depends on the version of the indicator, but most Target Bands use market volatility together with recent price ranges to create dynamic upper and lower boundaries.
As volatility increases, the bands widen. During quiet sessions, they move closer together. This simple adjustment helps traders recognize when the market is expanding or slowing down.
Here’s a practical example.
Suppose EUR/USD is trading around 1.1250 on the 1-hour timeframe. The indicator plots:
- Upper Target Band: 1.1295
- Middle Reference Line: 1.1252
- Lower Target Band: 1.1208
After a pullback toward the middle line, buyers enter the market. Price climbs steadily and reaches the upper band nearly four hours later, delivering around 45 pips. Many experienced traders would either secure profits at that level or tighten their stop-loss because price often reacts when it reaches projected targets.
During major news releases such as Non-Farm Payrolls, the bands can expand quickly as volatility spikes. When testing this on several NFP sessions, many traders notice that price may briefly push outside the outer band before returning inside. Waiting for the candle to close before entering often reduces fake-outs during these highly volatile periods.
Using Target Bands in Real Trading
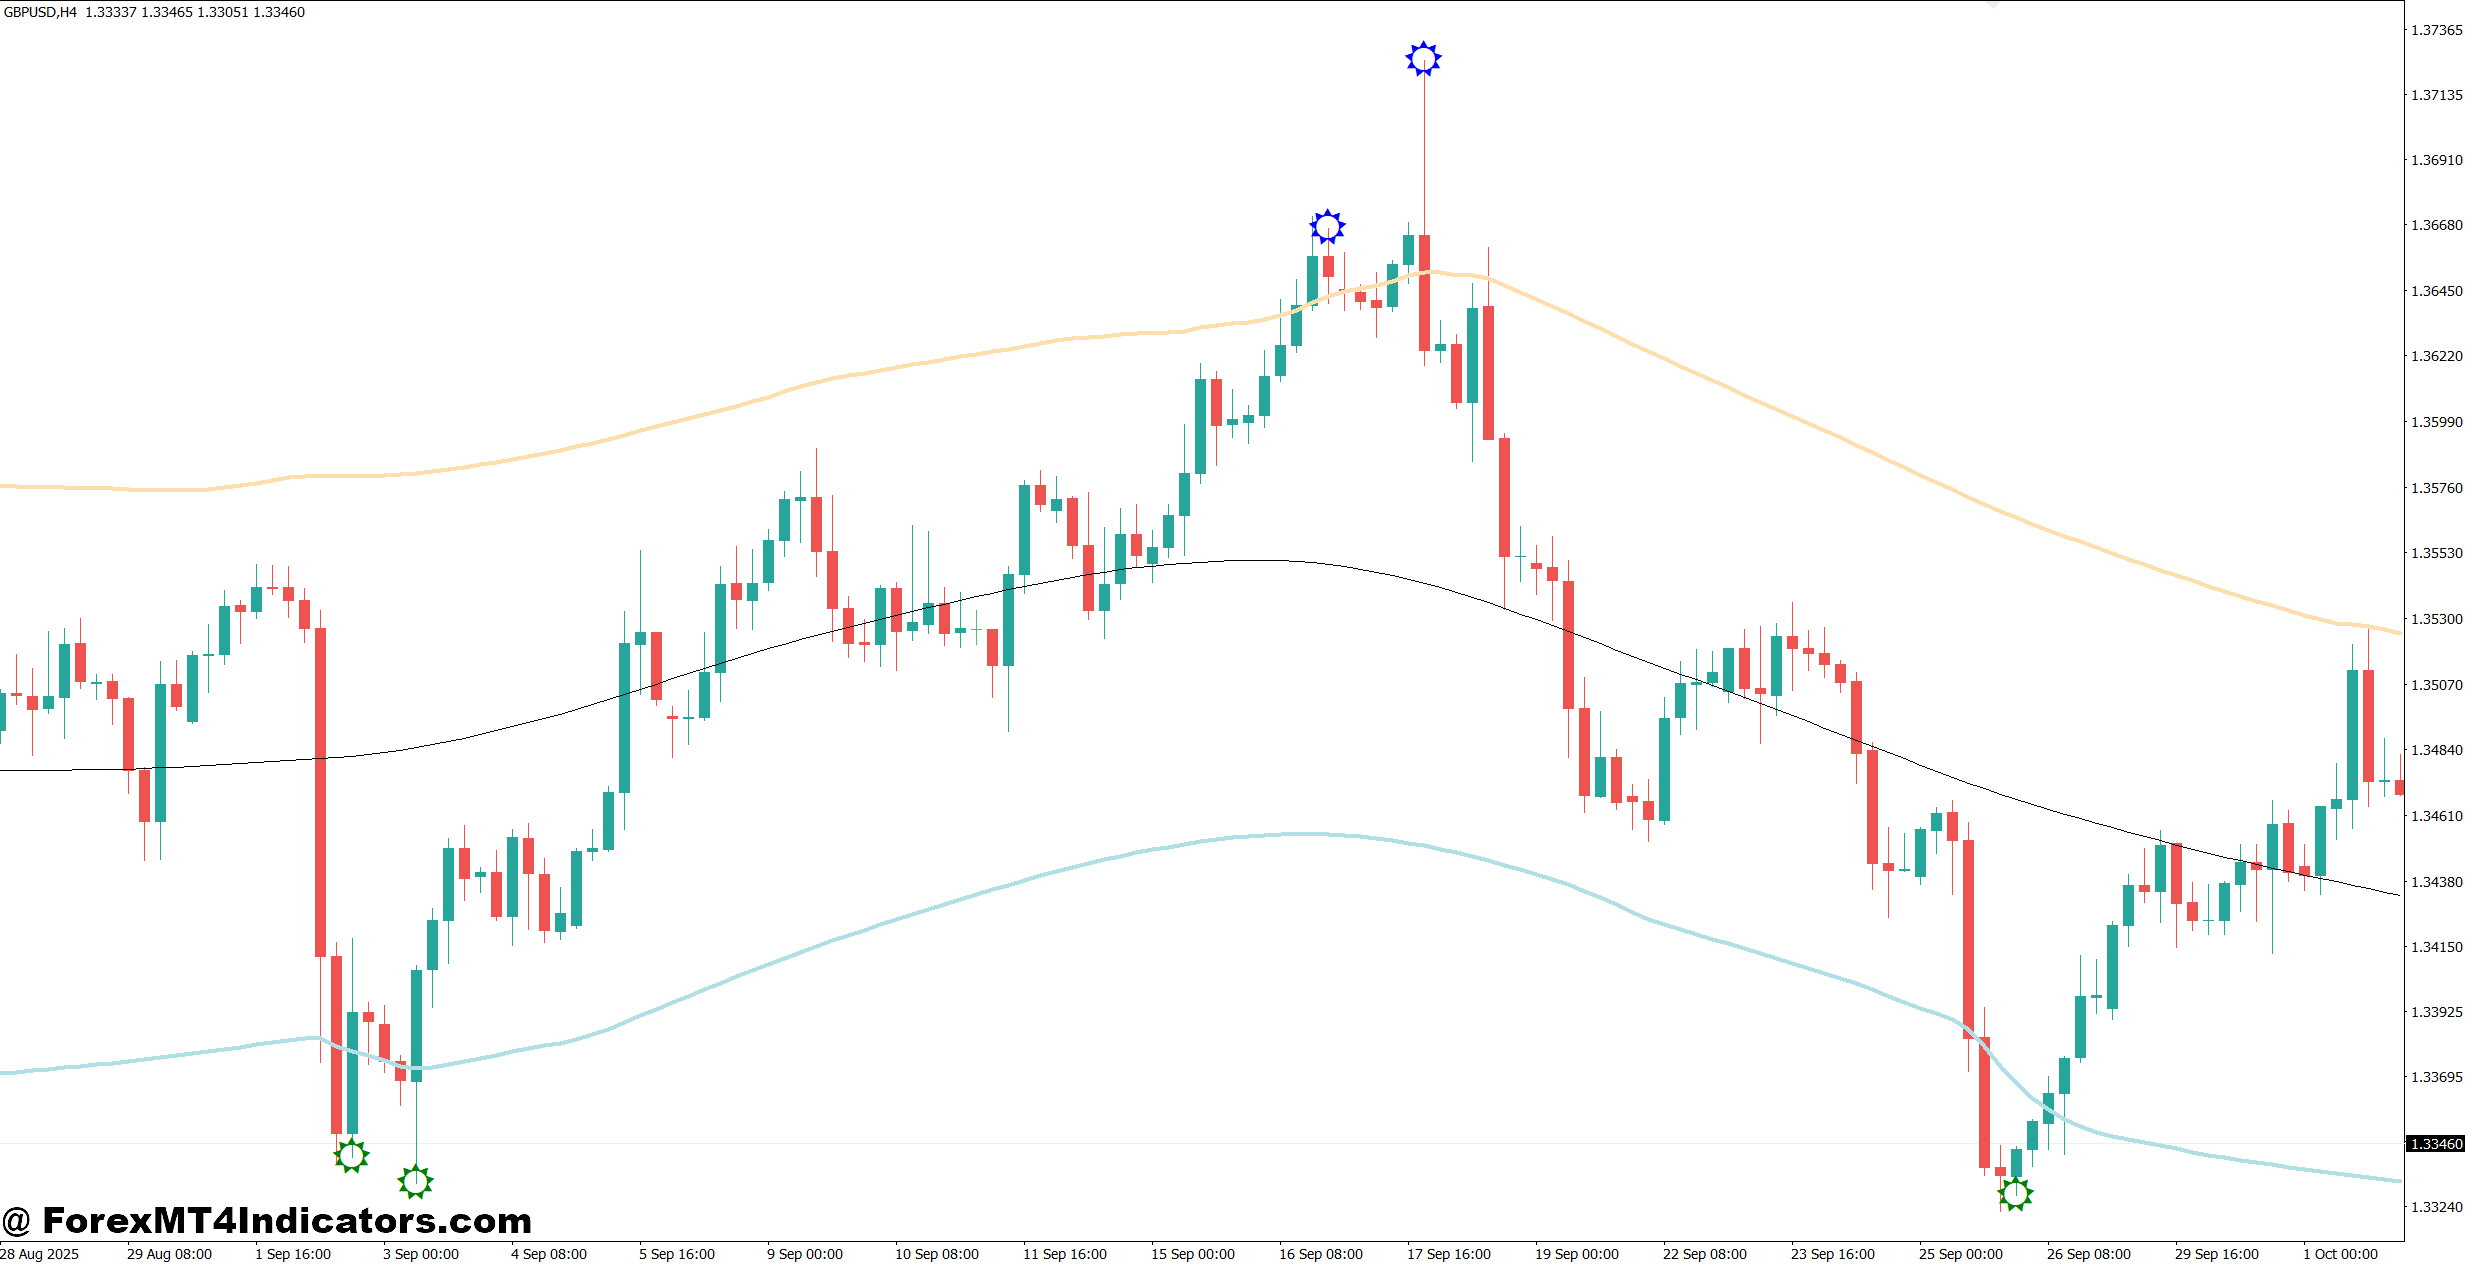
The indicator becomes much more useful when combined with market structure instead of trading every touch of a band.
Trading With the Trend
One common approach is to trade only in the direction of the prevailing trend.
Imagine GBP/USD trading above its 50-period EMA on the 4-hour chart. Price pulls back toward the middle Target Band while the overall trend remains bullish. After a bullish engulfing candle forms, a buy trade is opened with a stop-loss 30 pips below the recent swing low. The upper Target Band becomes the first profit objective, producing a reward-to-risk ratio close to 2:1.
This method avoids chasing price after large moves.
Spotting Possible Reversals
Target Bands can also highlight areas where momentum may fade.
Suppose USD/JPY rallies almost 90 pips during the London session and reaches the upper band while RSI rises above 70. Instead of buying into an extended move, traders may wait for bearish confirmation before considering a short-term sell trade.
The key is confirmation. The band alone isn’t enough to justify entering a trade.
Managing Existing Positions
Many traders overlook exit planning. That’s where Target Bands often provide the most value.
A trader holding a long EUR/USD position can scale out half the trade once price reaches the first upper band while leaving the remaining position open if momentum stays strong. This approach locks in profits without closing the entire trade too early.
Best Settings and Customization
There isn’t a single setting that fits every trading style. Small adjustments can improve performance depending on the market and timeframe.
Scalpers trading the 5-minute or 15-minute charts often prefer shorter calculation periods between 10 and 20 because the bands react faster to changing price action.
Swing traders using the 4-hour or Daily charts generally select values between 30 and 50 periods. The wider calculation filters market noise and highlights stronger target zones.
For highly volatile pairs like GBP/JPY, increasing the volatility multiplier slightly may reduce unnecessary signals during sharp price swings. On slower pairs such as EUR/CHF, lower sensitivity can keep the bands close enough to remain useful.
Before using any new settings on a live account, traders should test them over at least 100 historical trades. A configuration that performs well during trending markets may struggle during sideways conditions.
Strengths, Weaknesses, and Comparison With Similar Indicators
Target Bands offer several advantages that make them attractive for technical traders.
They provide realistic price objectives instead of forcing traders to guess where trends may end. Their dynamic nature allows them to adjust automatically as volatility changes. They also work well alongside trend-following tools such as Moving Averages, MACD, and the Average Directional Index (ADX).
Still, they have limitations.
During ranging markets, price may move repeatedly between the bands without producing meaningful trends. Traders can experience several small losses if they trade every signal without checking the broader market structure. Strong news events may also cause temporary price spikes beyond the projected bands.
Compared with Bollinger Bands, Target Bands focus more on projected objectives than statistical volatility. Bollinger Bands often identify overbought and oversold conditions, while Target Bands are commonly used for planning exits and measuring potential price movement.
Compared with Donchian Channels, Target Bands react more smoothly to changing market conditions instead of simply marking recent highs and lows.
Trading forex carries substantial risk. No indicator guarantees profits. Proper position sizing, stop-loss placement, and disciplined risk management remain essential regardless of the indicator being used.
How to Trade with MT4 Target Bands Indicator
Buy Entry
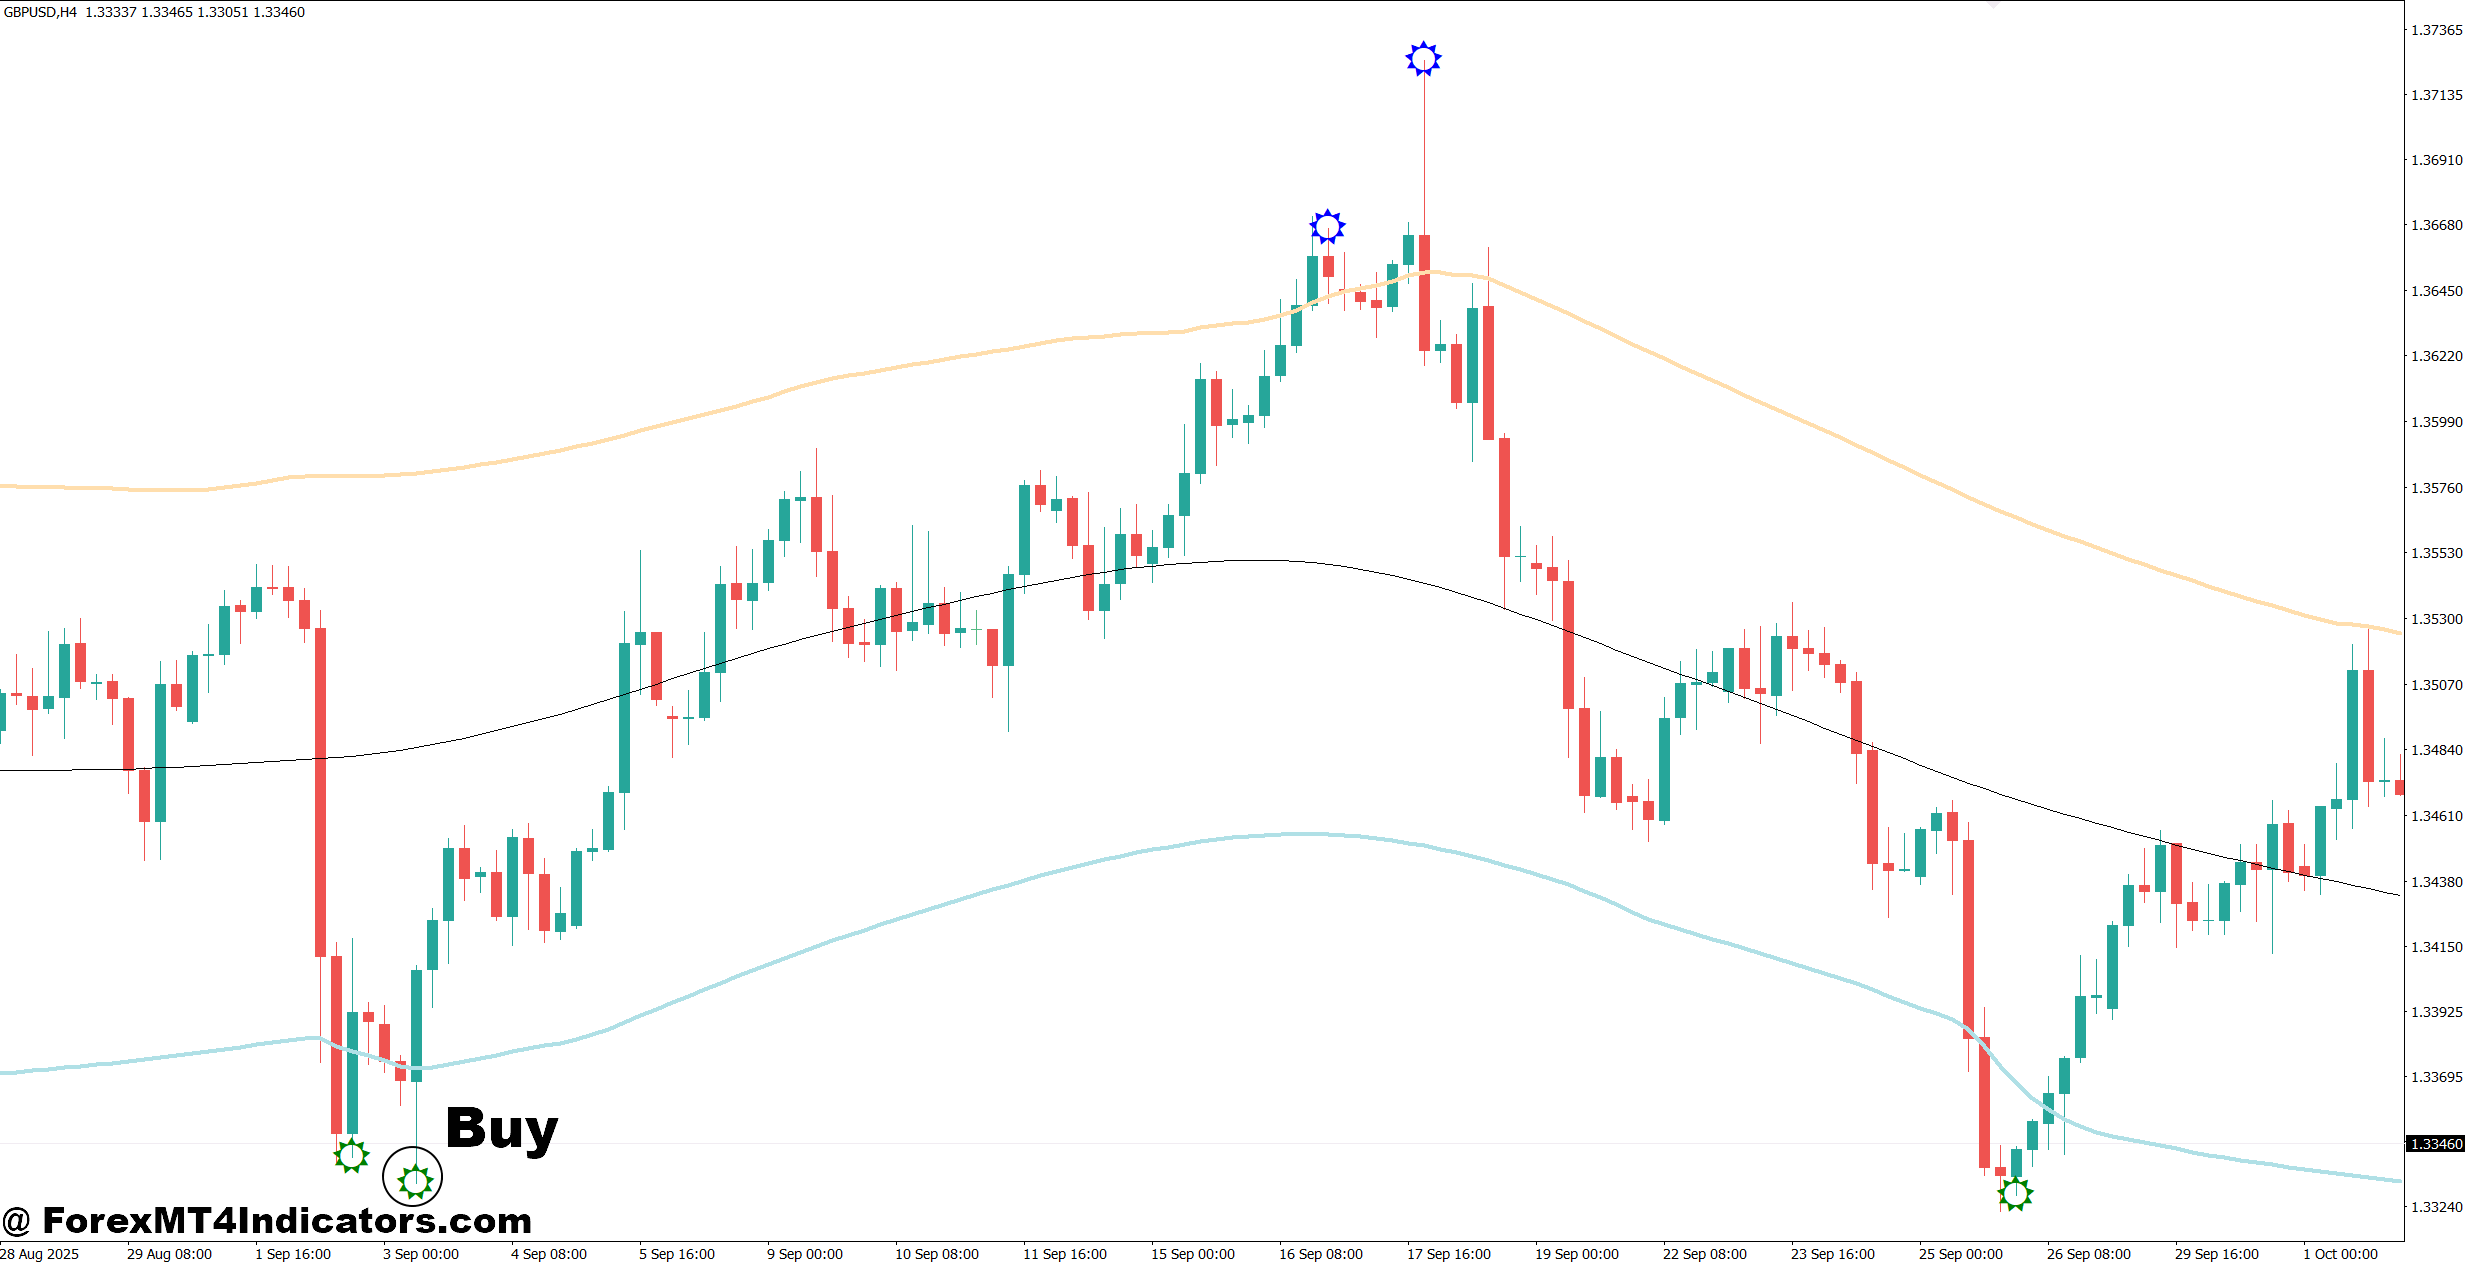
- Buy Near the Lower Target Band – Enter when EUR/USD touches the lower band on the 1-hour chart and a bullish candle closes. Aim for 30–50 pips.
- Confirm the Uptrend – Only buy if price stays above the 50 EMA on the 4-hour chart to trade with momentum.
- Wait for Bullish Confirmation – Enter after a bullish engulfing or pin bar forms near the lower band to avoid false signals.
- Place a Tight Stop-Loss – Set the stop-loss 15–25 pips below the recent swing low to control risk.
- Target the Upper Band – Use the upper Target Band as the first take-profit zone with at least a 1:2 risk-reward ratio.
- Trade Major Pairs – Focus on EUR/USD and GBP/USD during the London or New York session for cleaner moves.
- Skip High-Impact News – Don’t buy just before NFP, CPI, or interest rate announcements because volatility can break the bands.
- Manage Position Size – Risk only 1–2% of account balance on each trade, even if the setup looks strong.
Sell Entry
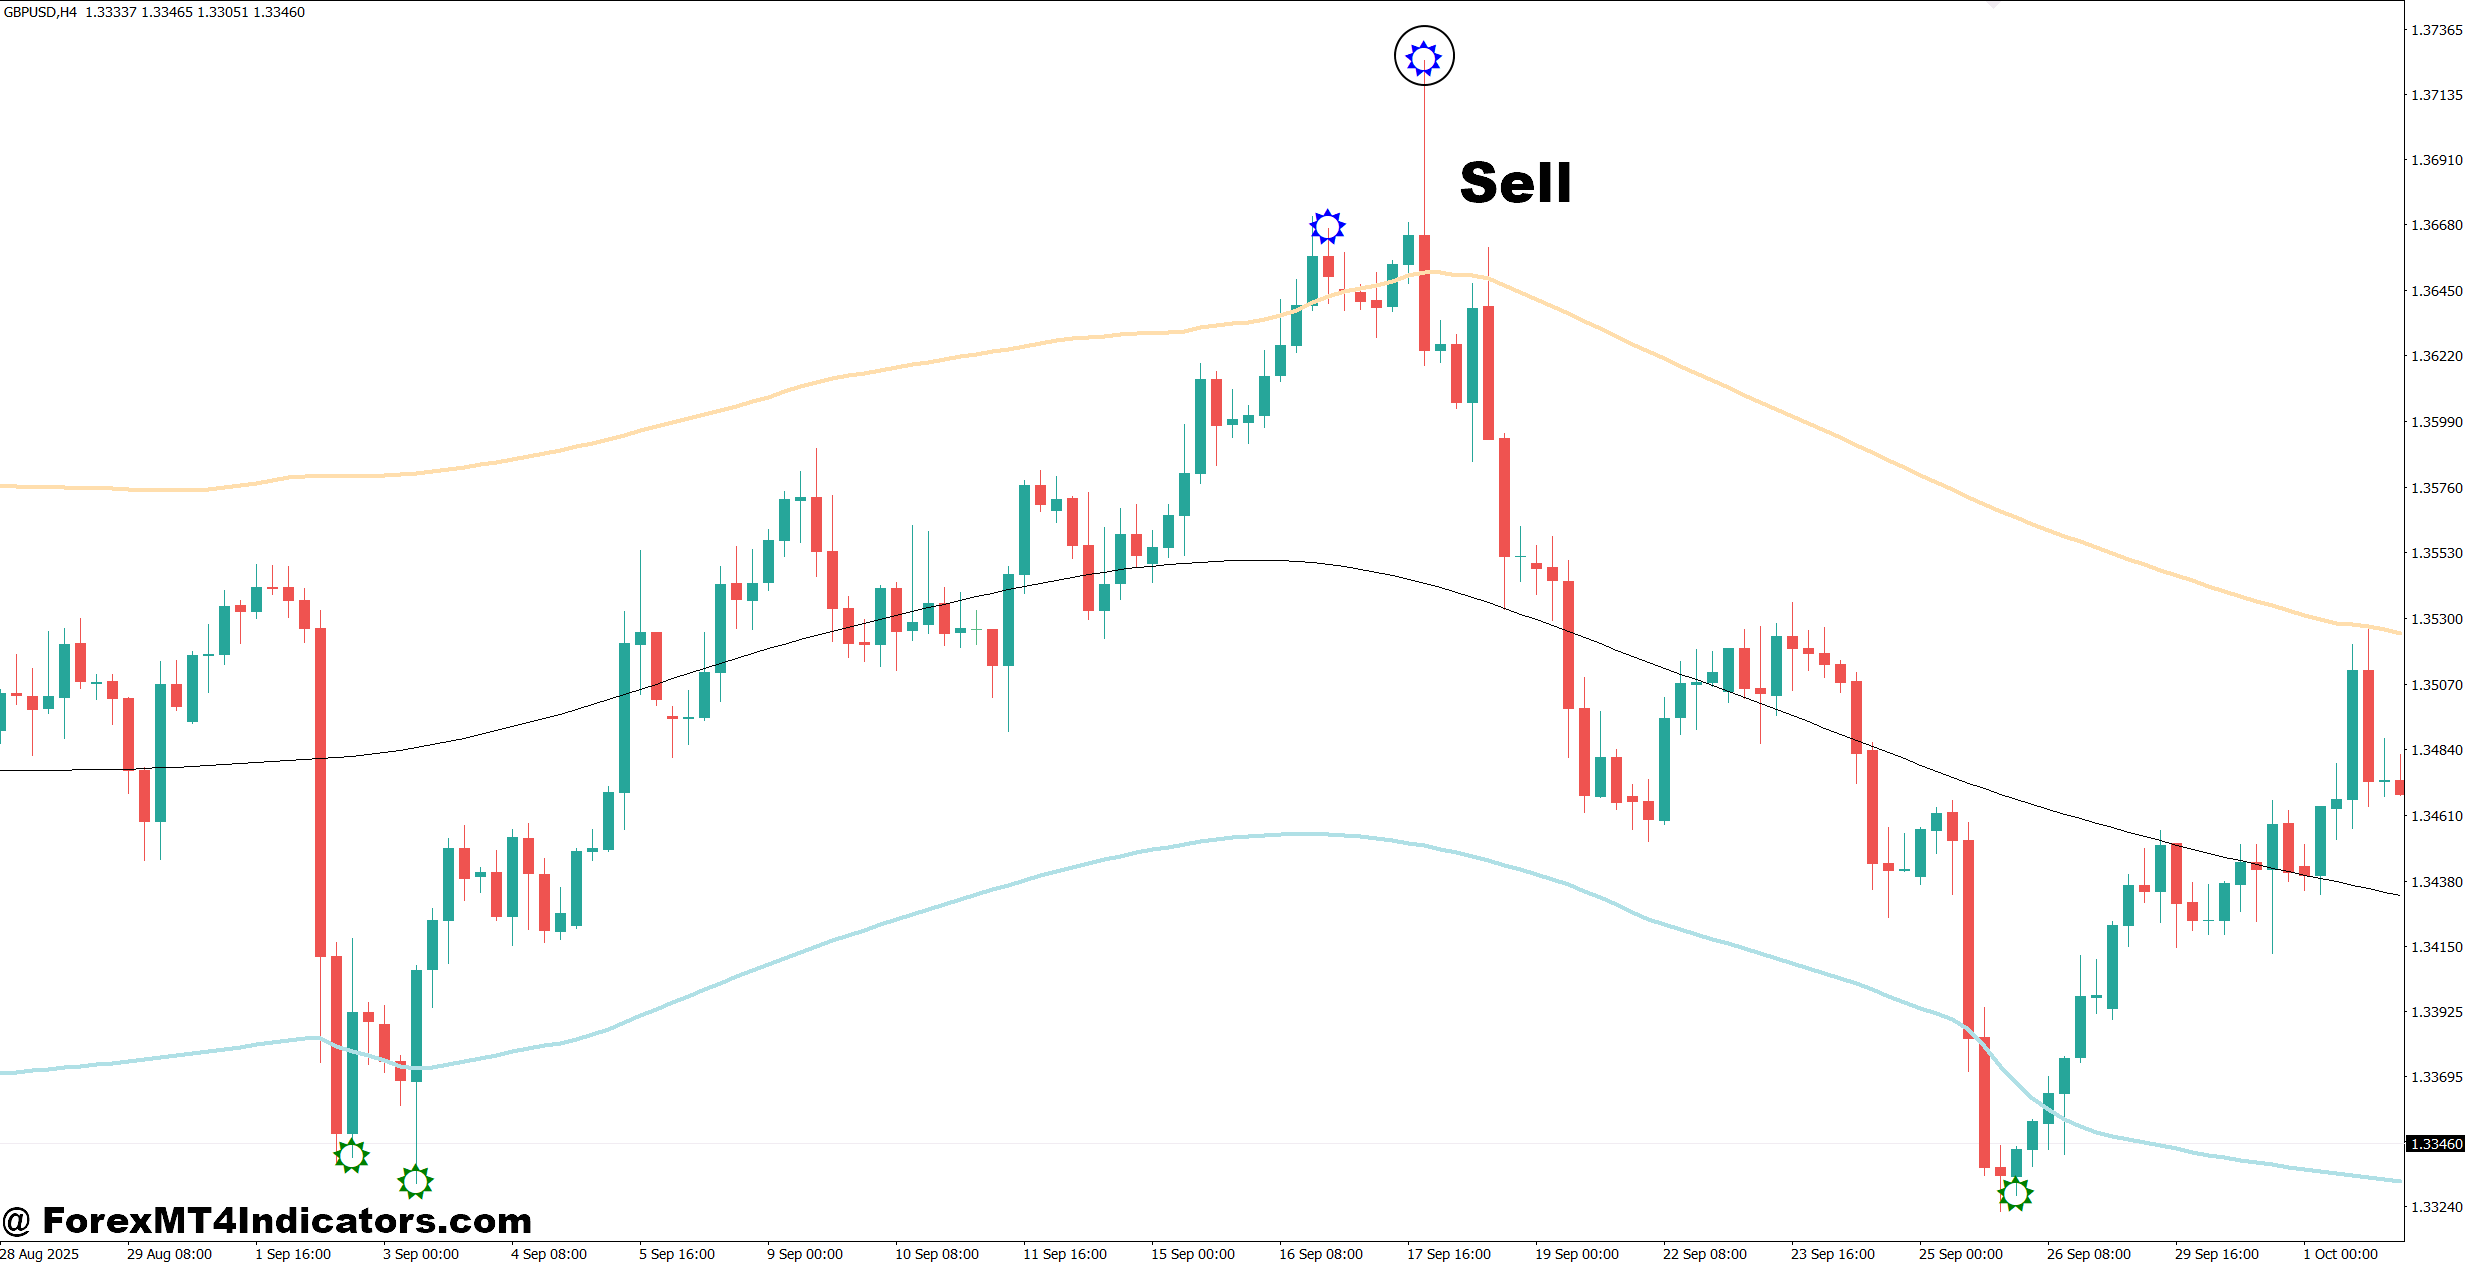
- Sell Near the Upper Target Band – Enter when GBP/USD reaches the upper band on the 1-hour chart and prints a bearish candle. Target 30–60 pips.
- Confirm the Downtrend – Sell only if price remains below the 50 EMA on the 4-hour or daily chart.
- Wait for Bearish Rejection – Use a bearish engulfing or shooting star at the upper band before entering.
- Place a Protective Stop – Keep the stop-loss 15–25 pips above the latest swing high.
- Aim for the Lower Band – Use the lower Target Band as the first profit target while maintaining at least a 1:2 reward-to-risk ratio.
- Watch for Overbought Moves – Strong rallies into the upper band often provide better sell opportunities than chasing falling prices.
- Avoid Sideways Markets – Don’t sell when the bands are flat and price is moving in a tight range.
- Protect Open Profits – Move the stop-loss to breakeven after gaining 20–30 pips to reduce downside risk.
The MT4 Target Bands Indicator gives traders a practical way to estimate where price may travel next instead of relying on emotion. The biggest lessons are simple: traders can use the bands to identify logical profit targets, combine them with trend direction for higher-quality setups, avoid treating every band touch as a trading signal, and adjust settings based on timeframe and market volatility. Used with sound risk management and price action analysis, this indicator can become a valuable part of a trading plan rather than the entire strategy. Like any technical tool, its real value comes from consistent testing and disciplined execution in live market conditions.
Level up your trading
Learn to read the chart — not just the indicator
eBook · Instant PDF
Video Course · 12 modules
Recommended MT4/MT5 Brokers
- ✓ *FREE *$50 to start (withdrawable)
- ✓ Deposit bonus up to $5,000
- ✓ Negative balance protection
Trading forex and CFDs carries a significant risk of loss and is not suitable for everyone. Broker links are affiliate links — we may earn a commission at no cost to you.
Free MT4 Indicator Download

Enter Your Email Address below, download link will be sent to you.