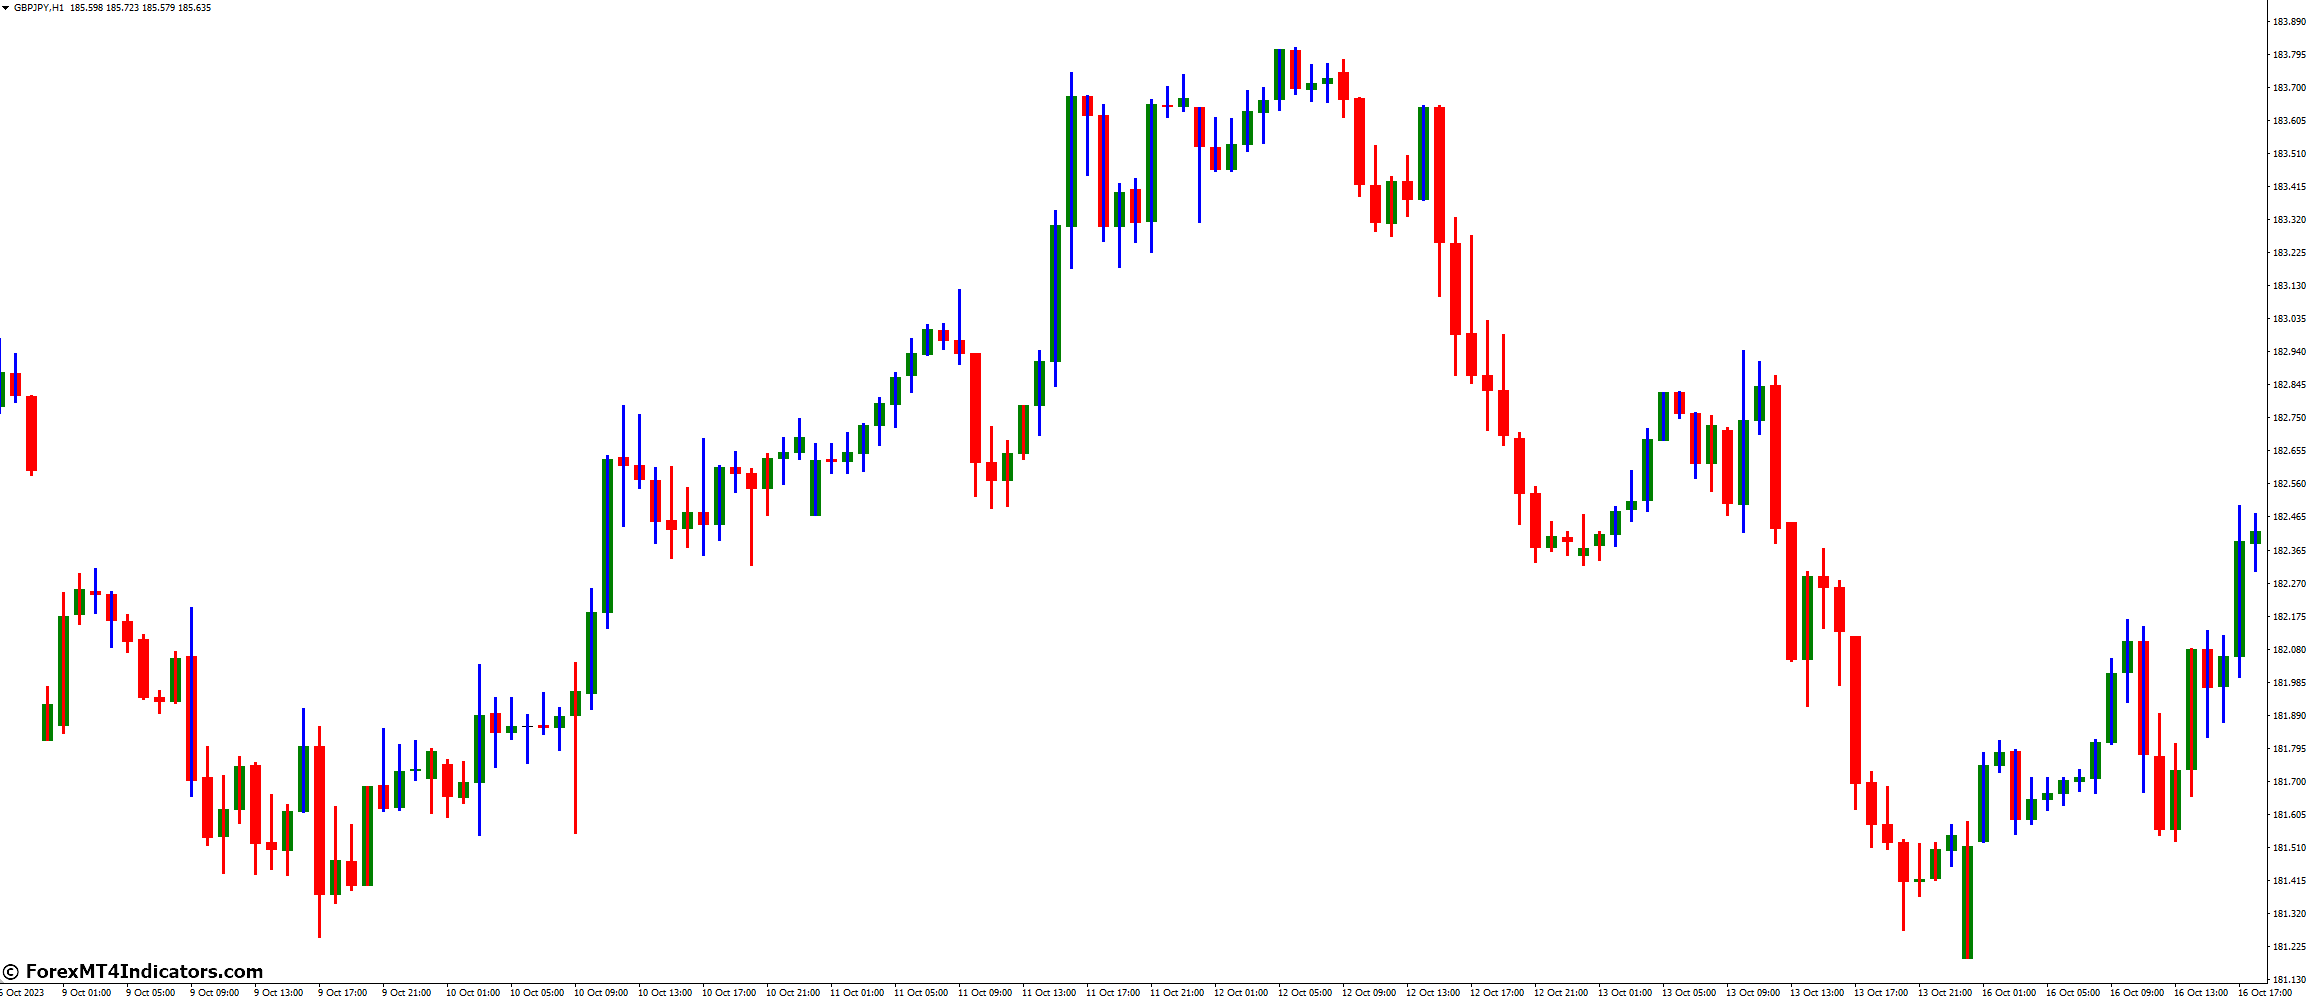
The 3 Line Break Indicator is a charting tool used in technical analysis to identify trends in the price of an asset. It is based on the concept of “three-line break” charts, which were first introduced in Japan. The indicator is designed to filter out market noise and focus on the underlying trend of the asset.
Why is it Important?
The 3 Line Break Indicator is important because it helps traders identify trends in the price of an asset. By identifying trends, traders can make more informed trading decisions and improve their overall trading performance.
How Does it Work?
The 3-Line Break Indicator works by plotting a series of vertical lines on the price chart. Each line represents a certain price movement in the asset. When the price moves above or below the previous three lines, a new line is drawn. This helps to filter out market noise and focus on the underlying trend of the asset.
What are the Benefits of Using it?
The benefits of using the 3 Line Break Indicator include:
- Identifying trends in the price of an asset
- Filtering out market noise
- Focusing on the underlying trend of the asset
- Improving trading performance
What are the Drawbacks of Using it?
The drawbacks of using the 3 Line Break Indicator include:
- It may not work well in choppy or sideways markets
- It may generate false signals in certain market conditions
- It may not be suitable for all trading styles
How does it Compare to Other Indicators?

The 3 Line Break Indicator is similar to other trend-following indicators such as moving averages and Ichimoku Cloud. However, it is unique in that it filters out market noise and focuses on the underlying trend of the asset.
What are the Best Practices for Using it?
The best practices for using the 3 Line Break Indicator include:
- Using it in conjunction with other technical indicators
- Using it on longer timeframes to filter out market noise
- Backtesting the indicator to determine its effectiveness
- Using it in conjunction with sound risk management practices
What are the Common Mistakes to Avoid?
The common mistakes to avoid when using the 3 Line Break Indicator include:
- Using it as the sole basis for trading decisions
- Not using it in conjunction with other technical indicators
- Not backtesting the indicator before using it in live trading
- Not using sound risk management practices
How to Interpret the Signals?
To interpret the signals of the 3 Line Break Indicator, follow these guidelines:
- When the price moves above the previous three lines, a new line is drawn in the opposite direction. This indicates a potential reversal in the trend.
- When the price moves below the previous three lines, a new line is drawn in the opposite direction. This also indicates a potential reversal in the trend.
- Traders can use the indicator in conjunction with other technical indicators to confirm signals.