

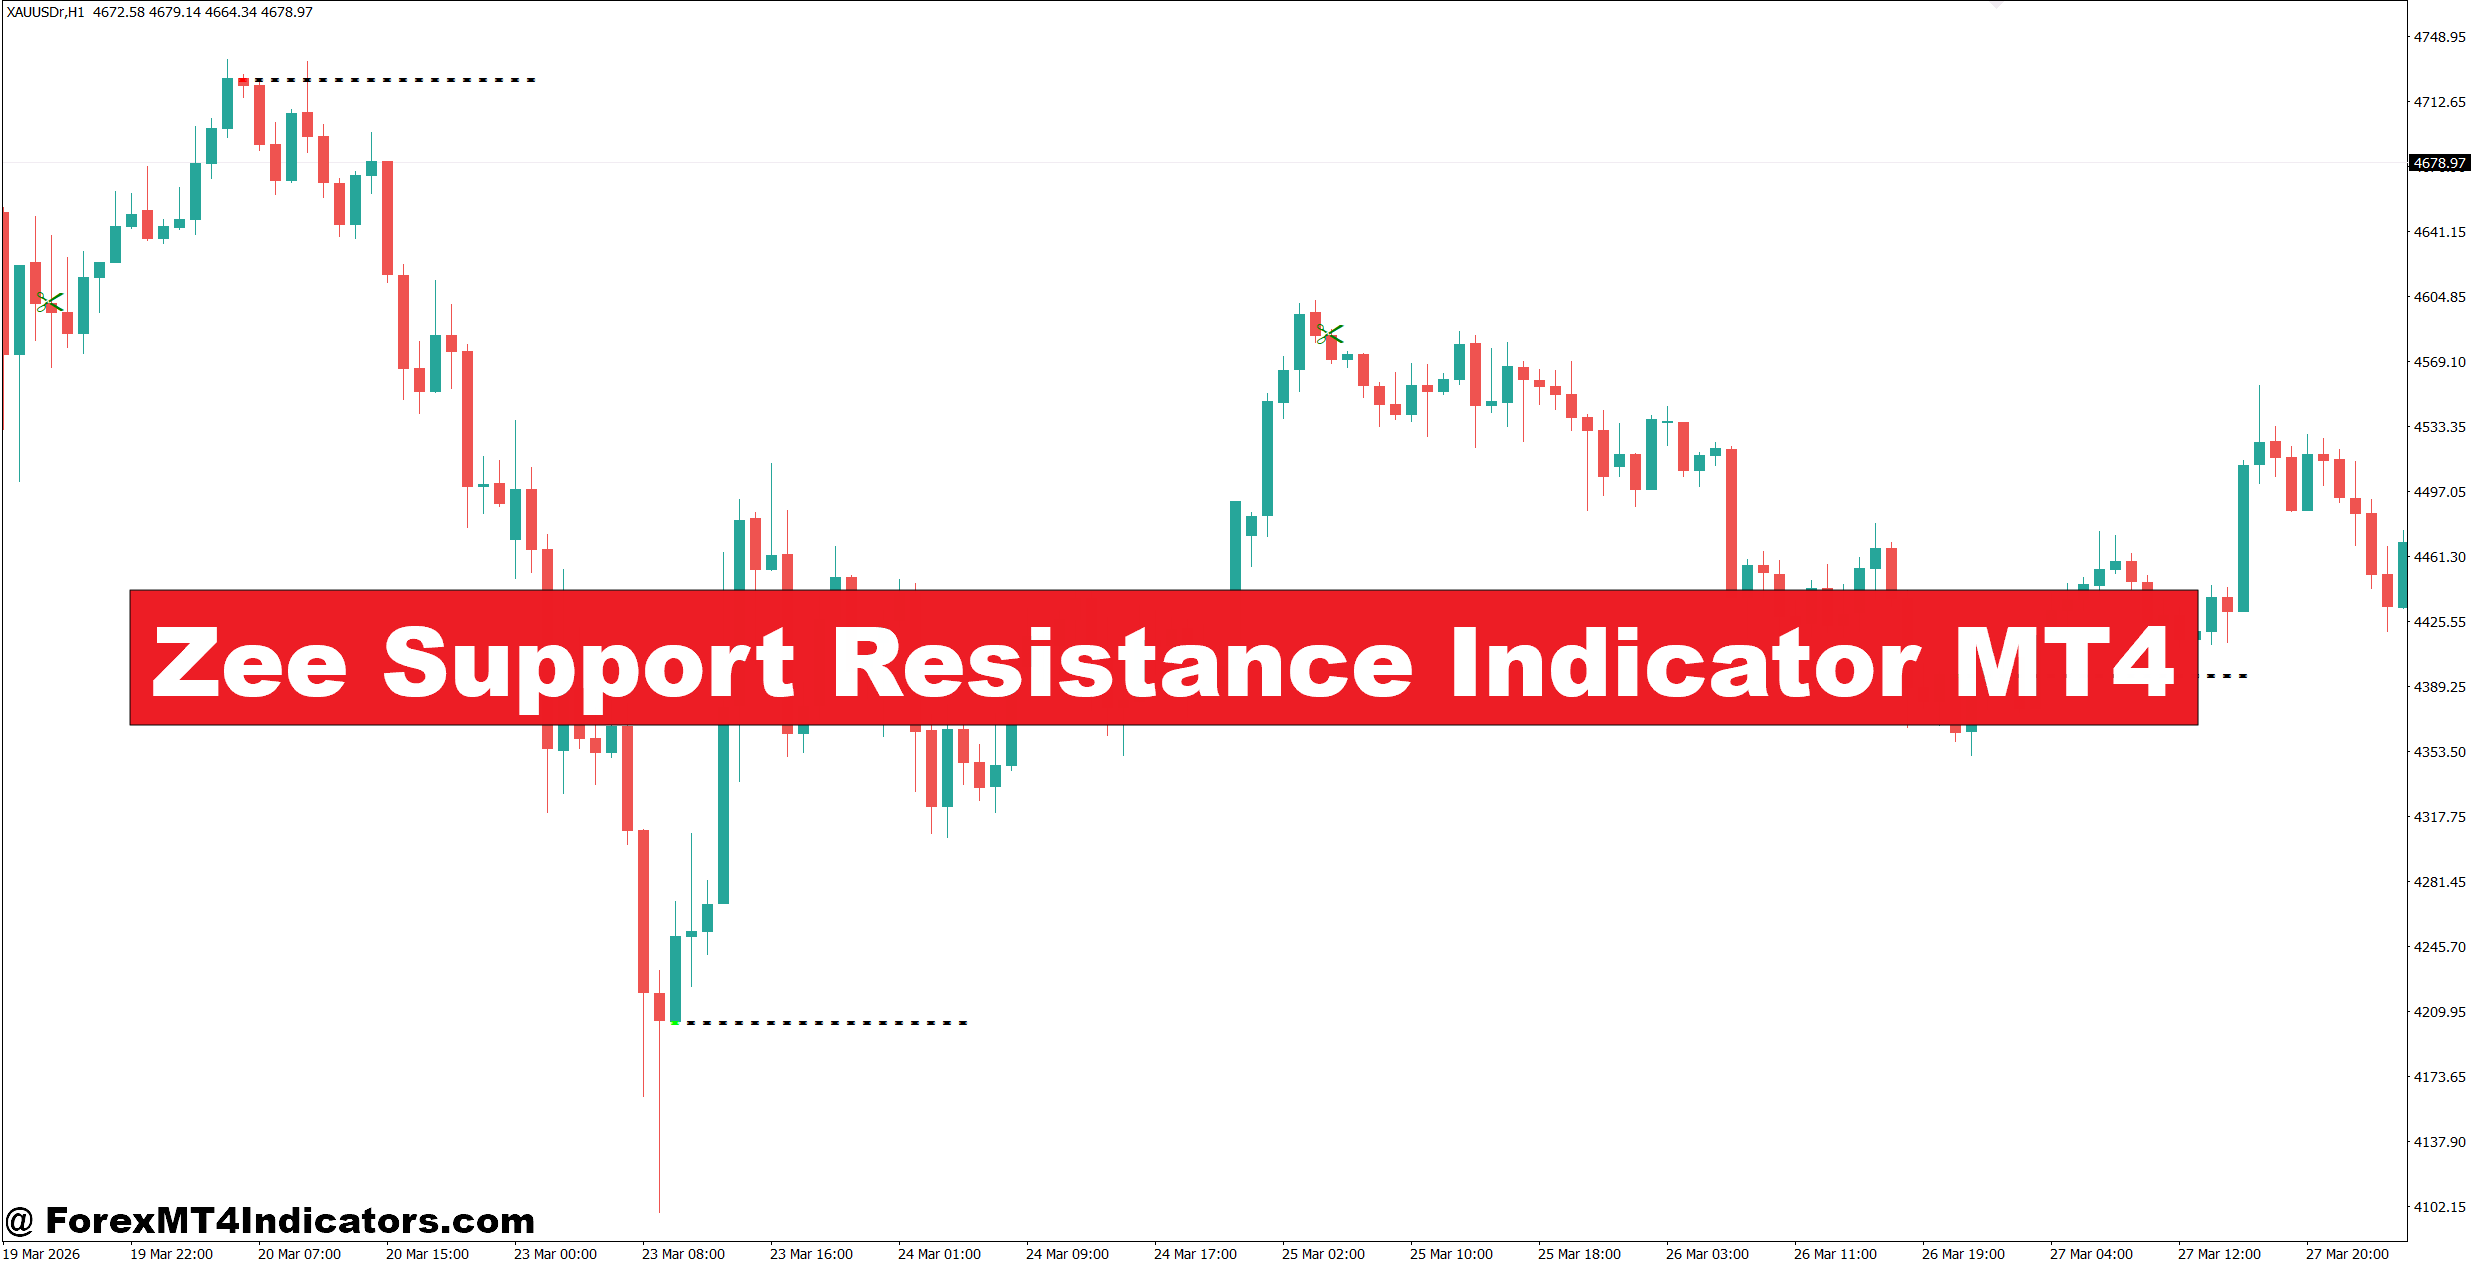
The Zee Support Resistance Indicator MT4 helps traders identify important price zones based on previous market behavior instead of relying on guesswork. By marking potential support and resistance areas directly on the chart, it becomes easier to plan entries, exits, and stop-loss placement with more structure. The indicator doesn’t predict the future, but it highlights price levels where buyers and sellers have reacted before.
The sections below explain how the indicator works, where it performs well, and how traders can use it alongside price action for better trading decisions.
What Is the Zee Support Resistance Indicator MT4?
The Zee Support Resistance Indicator MT4 is a technical analysis tool designed to plot significant support and resistance zones automatically. Instead of manually drawing horizontal lines after every swing, it scans historical price data and identifies levels where the market has repeatedly reversed or paused.
The indicator works on all major currency pairs, including EUR/USD, GBP/USD, USD/JPY, and AUD/USD. It also adapts to different chart periods, although many traders prefer the H1, H4, and Daily charts because they generally produce stronger and more reliable levels.
Unlike trend-following indicators that react after price has already moved, this tool focuses on market structure. It gives traders a roadmap of where buying or selling pressure may appear before price reaches those areas.
How the Indicator Identifies Key Price Levels
Support and resistance exist because market participants remember previous trading activity. The Zee Support Resistance Indicator analyzes swing highs, swing lows, repeated rejection zones, and historical turning points to determine where these levels should appear.
When several candles reject the same area, the indicator recognizes that price level as significant. As more historical reactions occur, the level generally becomes more important.
For example, EUR/USD on the 1-hour chart repeatedly rejected 1.1180 over three trading sessions. The indicator marked this zone as resistance. When price returned to that area later in the week, sellers entered again, producing a 45-pip decline before buyers regained control.
Another practical example appeared on GBP/USD during the London session. Price bounced from a support level identified near 1.2960 three separate times. Traders who waited for a bullish rejection candle instead of buying immediately had a cleaner entry with a stop-loss of around 18 pips and a reward exceeding 50 pips.
Here’s the thing: the indicator becomes much stronger when traders wait for confirmation instead of placing trades simply because price touches a line.
Using the Zee Support Resistance Indicator in Real Trading
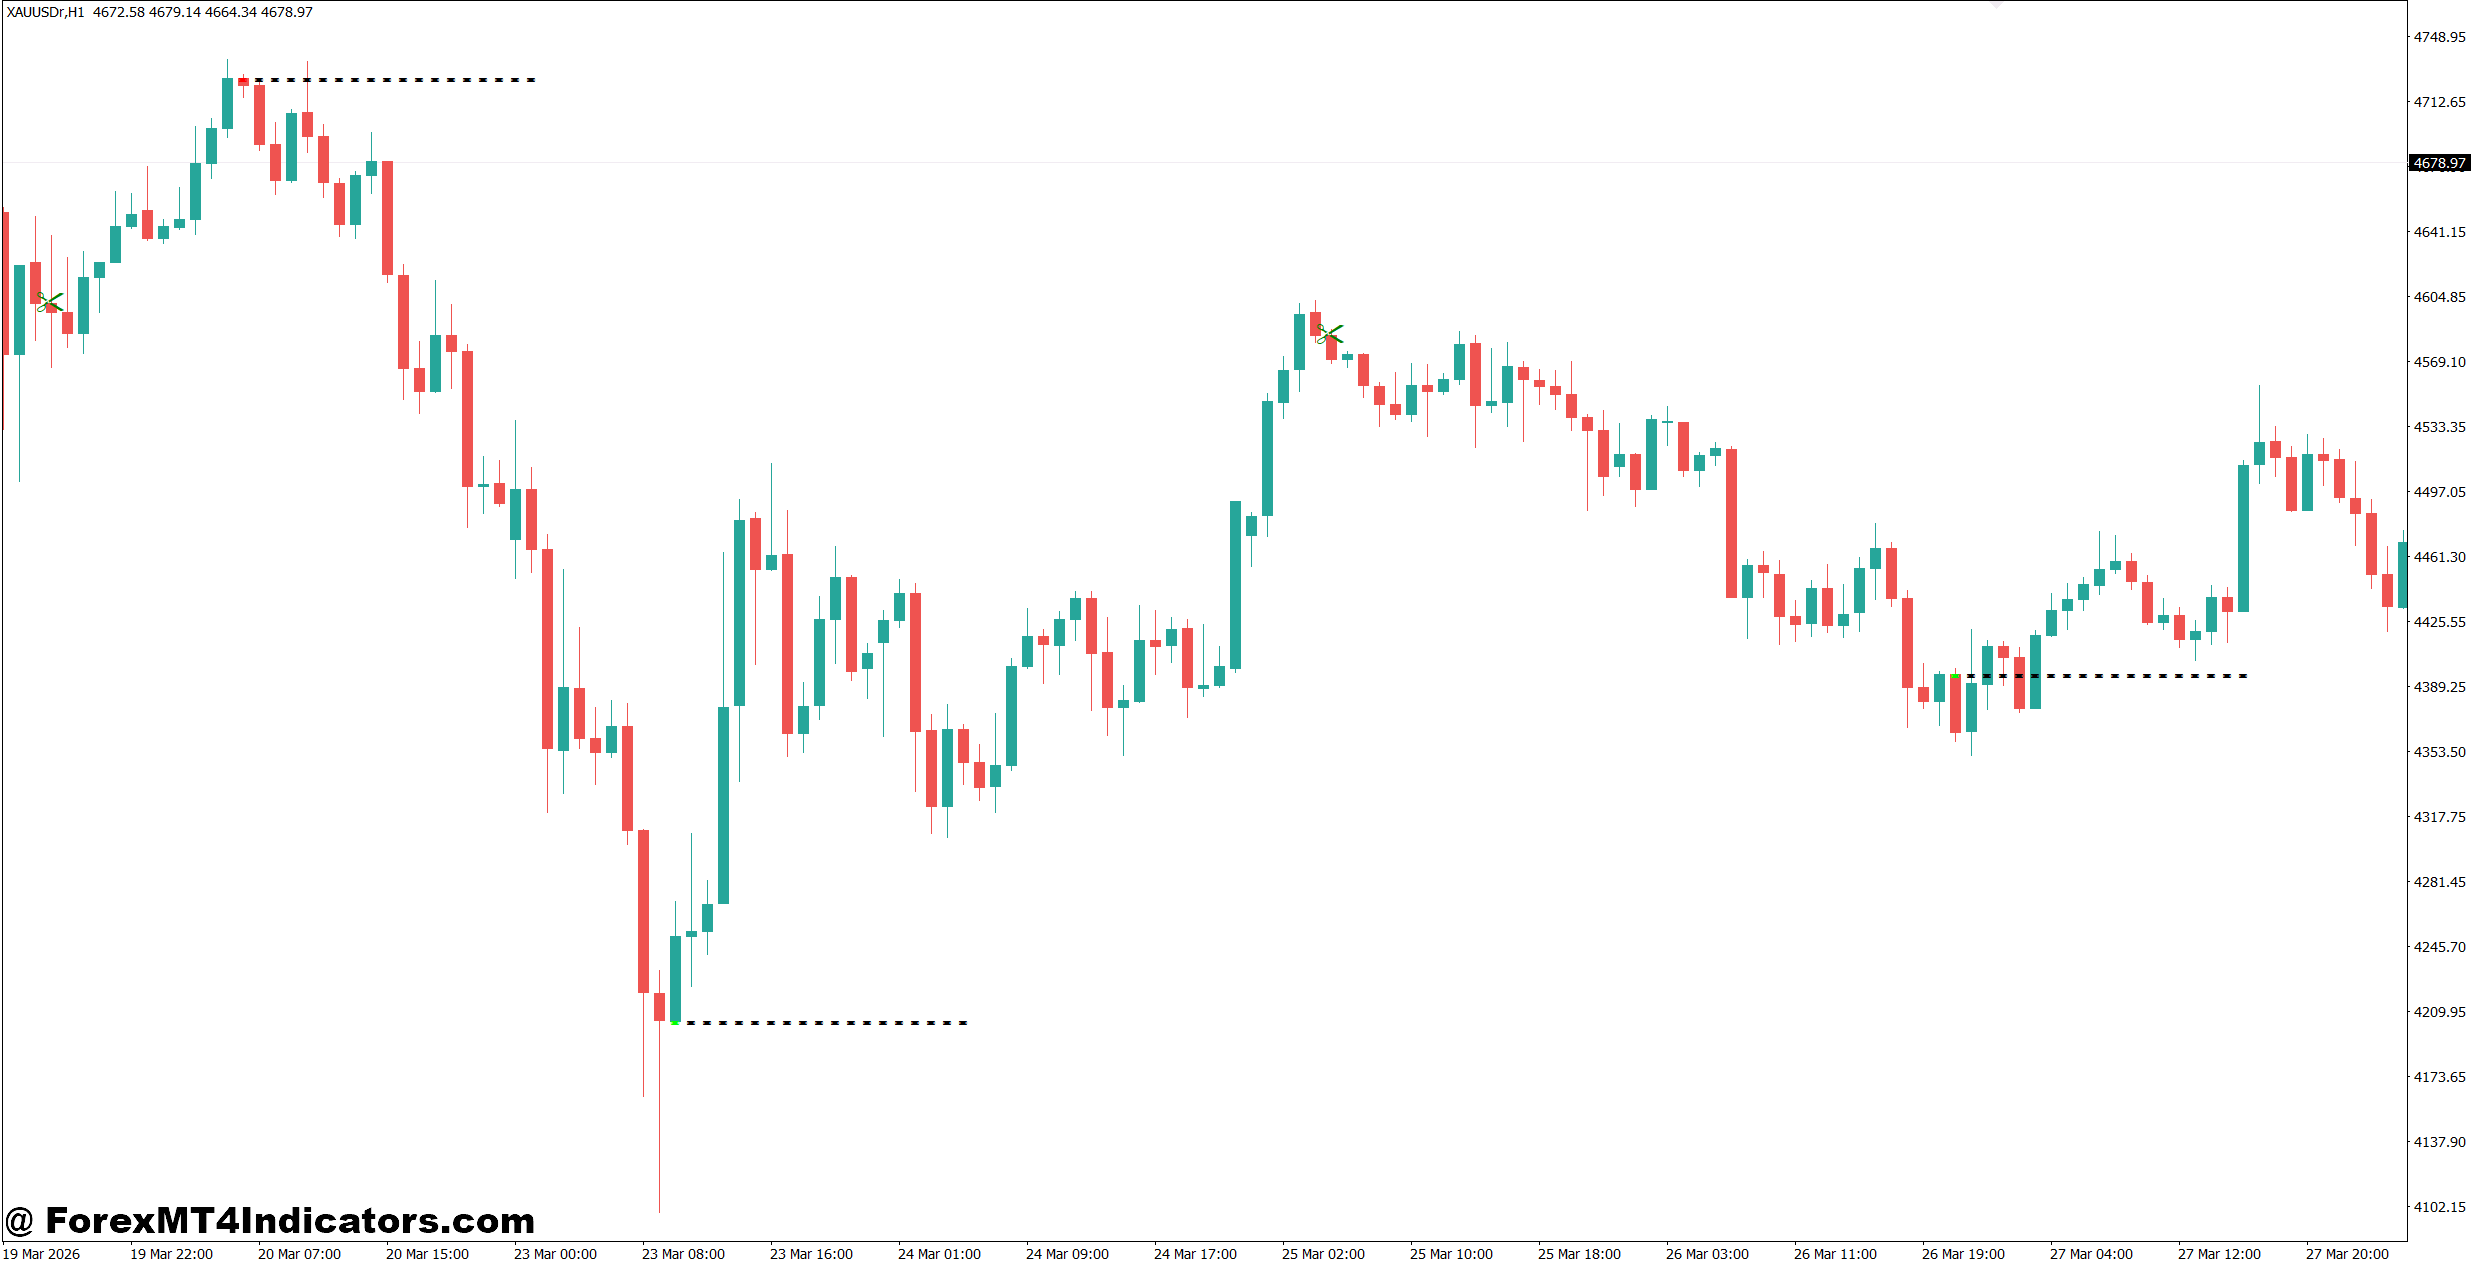
The indicator performs best when combined with market structure and confirmation signals rather than used alone.
A common approach is waiting for price to approach an identified support zone while monitoring bullish candlestick patterns such as a hammer or bullish engulfing candle. If RSI also rises from below 30 or MACD begins crossing upward, the buying opportunity gains additional confirmation.
During trend trading, support levels often provide better buying opportunities than resistance breakouts. In an uptrend, traders may wait for price to retrace toward a marked support zone before entering with the dominant trend.
On USD/JPY, a trader following the 4-hour trend noticed price pulling back nearly 60 pips into an identified support area. A bullish engulfing candle formed shortly afterward, leading to an upward move exceeding 140 pips over the next two sessions.
When testing this indicator during volatile NFP days, many traders notice that temporary spikes can briefly break support or resistance before reversing. Waiting until the candle closes helps avoid many of these fake-outs.
Trading forex carries substantial risk. No indicator guarantees profits. Proper position sizing and disciplined risk management remain essential regardless of how accurate a setup appears.
Settings, Customization, and Best Practices
Most versions of the Zee Support Resistance Indicator MT4 include settings that allow traders to adjust sensitivity, historical lookback periods, line colors, and alert options.
A shorter lookback period creates more support and resistance levels, which may suit scalpers trading the M15 chart. The downside is increased chart noise.
Swing traders often prefer larger lookback values on the H4 or Daily timeframe because fewer but stronger levels appear. These zones usually attract more institutional attention.
Many experienced traders use settings similar to these:
- M15: Higher sensitivity with confirmation from volume or candlestick patterns.
- H1: Medium sensitivity for intraday trading.
- H4 and Daily: Longer lookback period to identify major market structure.
The indicator also works well with tools such as the 200 EMA, Fibonacci retracement, ATR, and RSI. If several technical factors point to the same price area, the setup generally deserves closer attention.
Strengths, Weaknesses, and Comparison With Similar Tools
One advantage of the Zee Support Resistance Indicator is its ability to save time. Traders no longer need to manually inspect weeks of chart history to identify major levels.
Another benefit is consistency. Since the indicator follows predefined calculation rules, it reduces emotional decisions that often lead traders to draw different levels every day.
Still, it has limitations.
Strong economic news can push price directly through established support or resistance without hesitation. Market conditions also change over time, so older levels gradually lose importance if price stops reacting to them.
Compared with manually drawn support and resistance, the indicator offers speed and consistency. Against pivot point indicators, it relies more on historical market reactions than daily mathematical calculations. When compared with supply and demand indicators, Zee Support Resistance produces cleaner charts but may not display wider institutional zones.
Many traders combine two or more of these methods instead of relying on only one indicator.
The best results usually come from reading price action first, then using the indicator to confirm areas worth monitoring instead of treating every marked line as a trading signal.
How to Trade with Zee Support Resistance Indicator MT4
Buy Entry
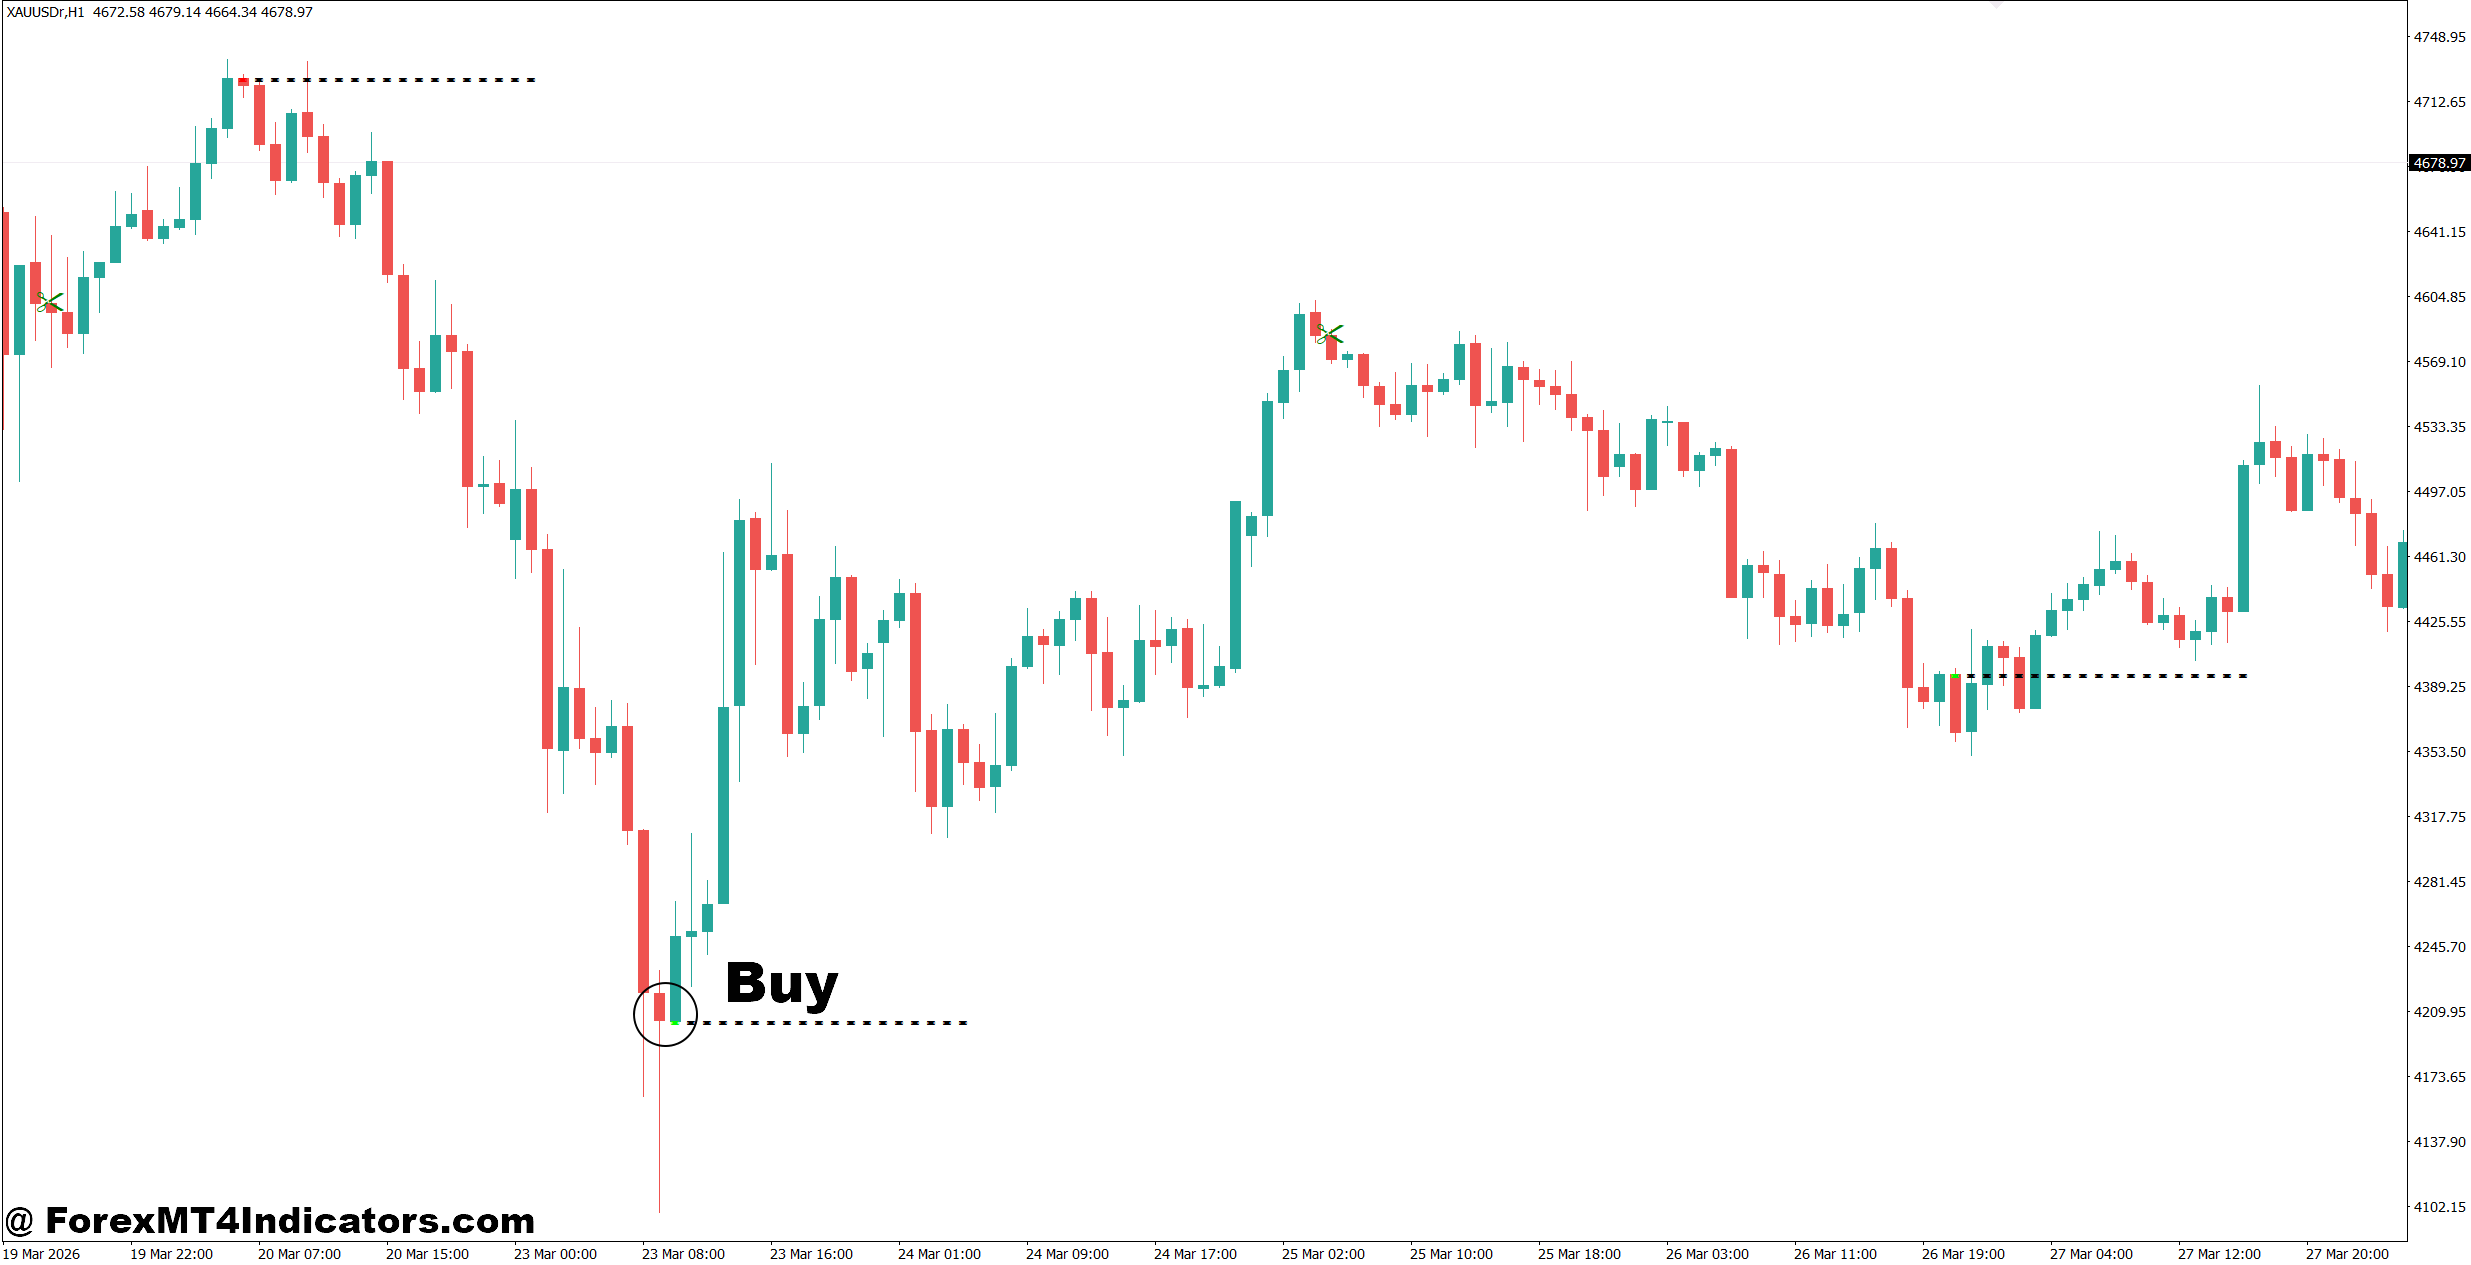
- Buy at confirmed support – Enter after a bullish candle closes on a marked support zone on the 1-hour EUR/USD chart.
- Wait for price rejection – Buy only if the support rejects price with a pin bar or bullish engulfing candle.
- Trade with the trend – Take buy signals only when the 4-hour trend is bullish to improve accuracy.
- Place a tight stop-loss – Keep the stop-loss 15-25 pips below the support level.
- Aim for a solid reward – Target 30-60 pips or maintain at least a 1:2 risk-to-reward ratio.
- Use indicator confluence – Confirm the setup with RSI above 30 or a bullish MACD crossover.
- Avoid high-impact news – Skip buy entries 15-30 minutes before major events like NFP or CPI releases.
- Protect profits early – Move the stop-loss to breakeven after gaining 20-25 pips.
Sell Entry
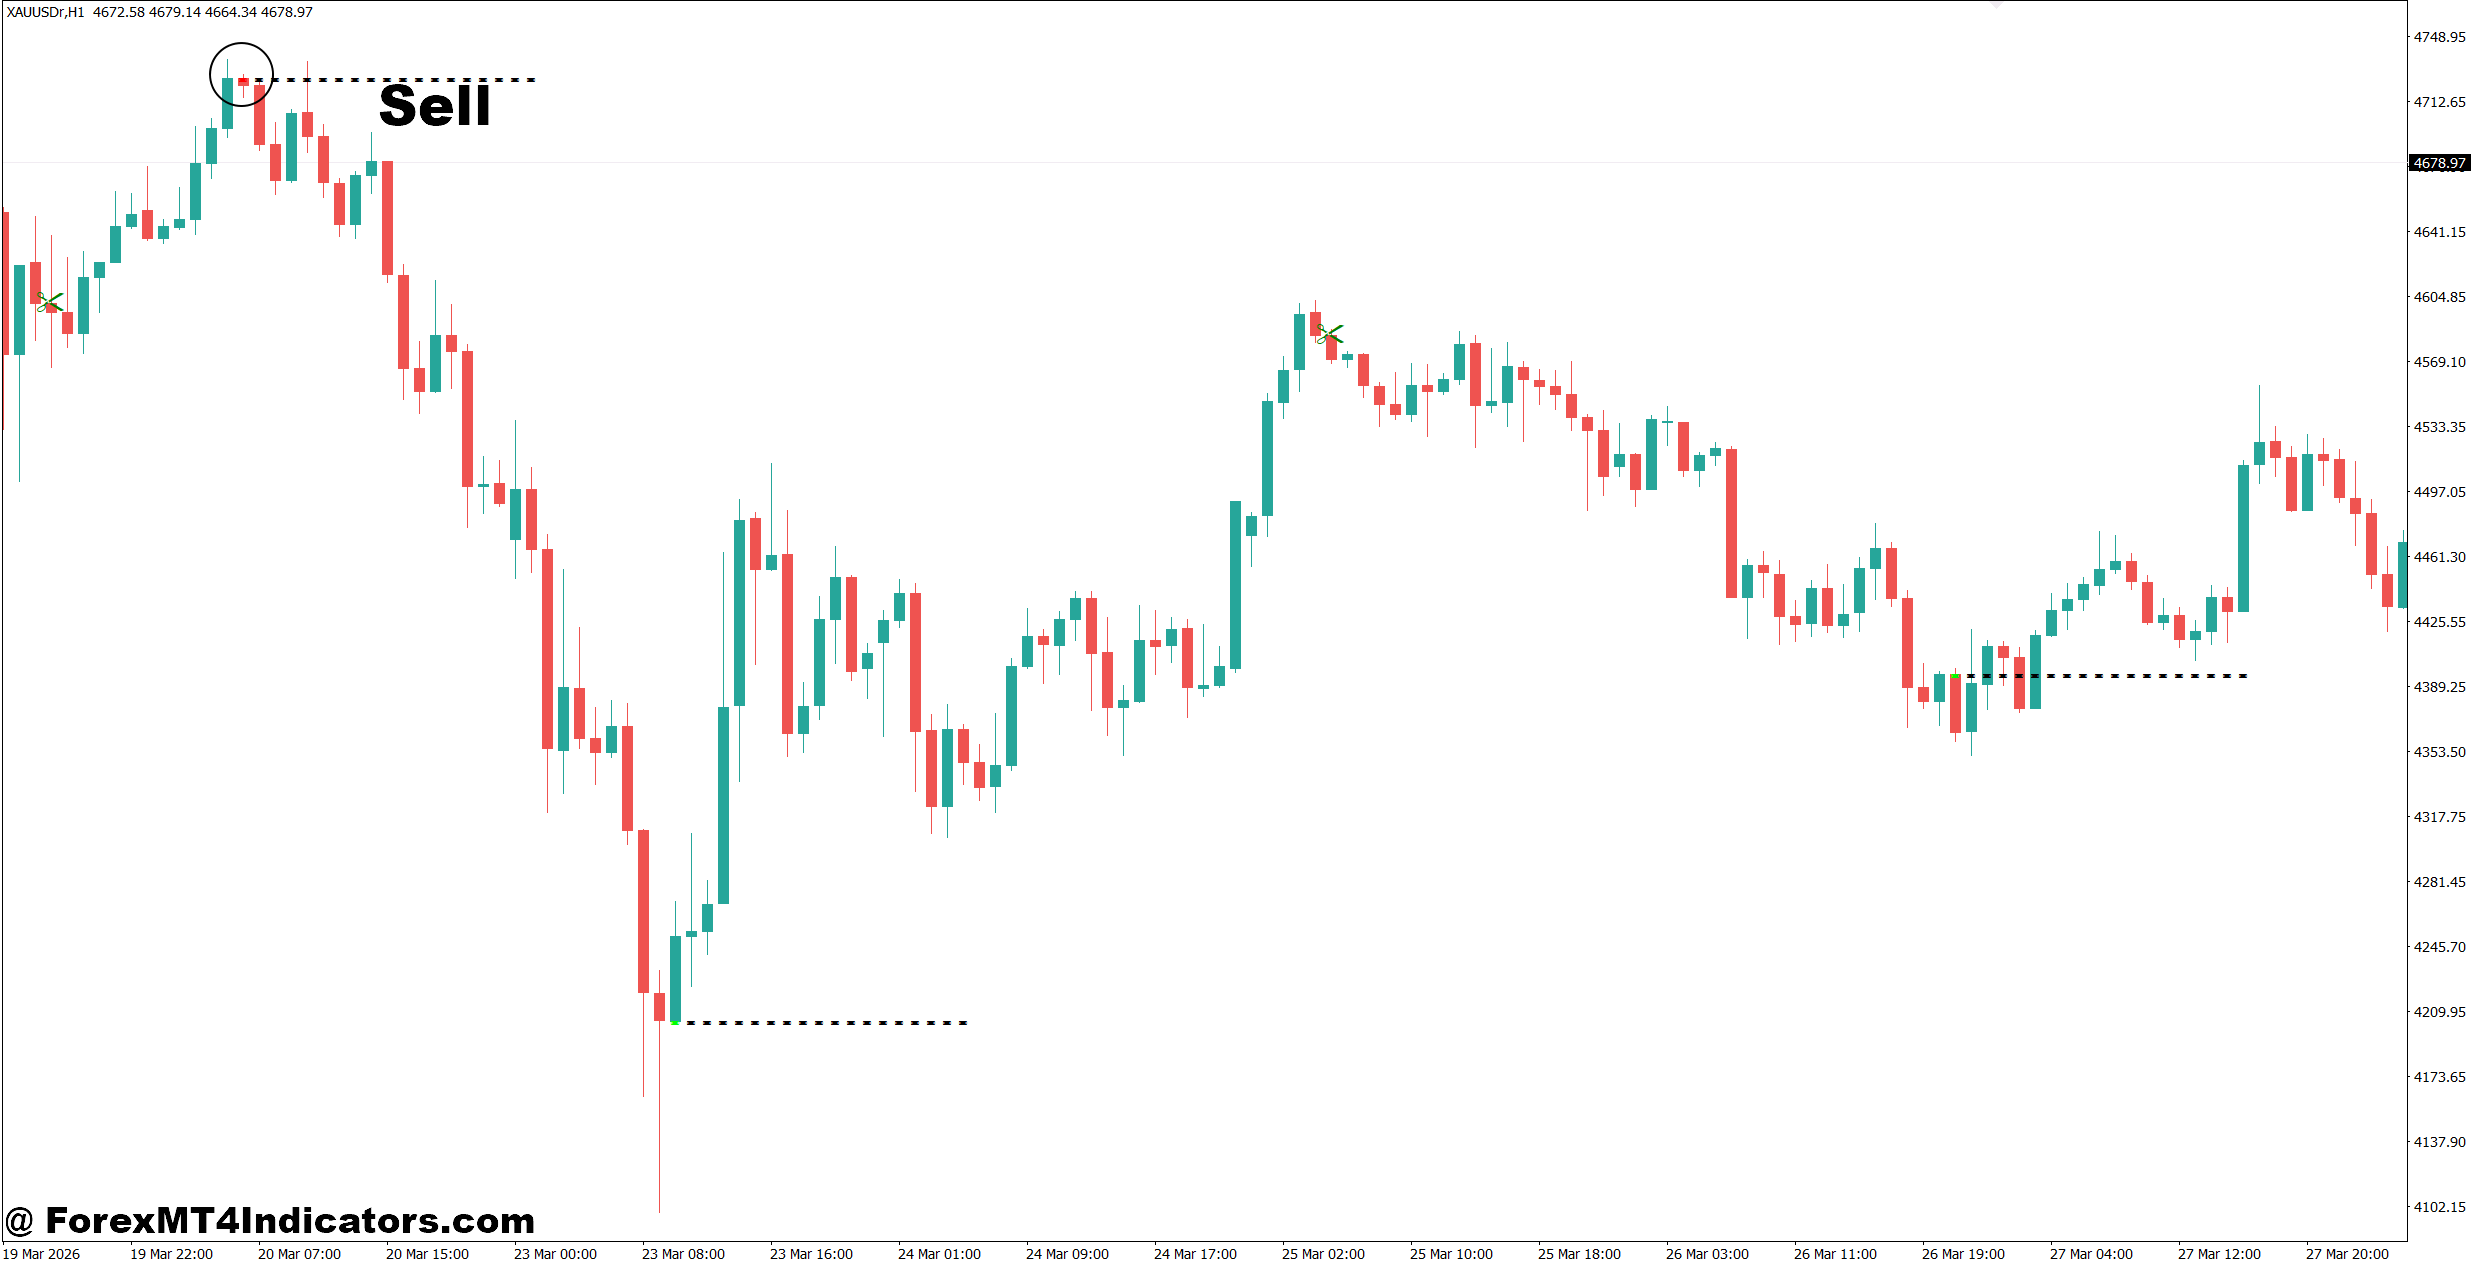
- Sell at confirmed resistance – Enter after a bearish candle closes from a marked resistance zone on GBP/USD.
- Wait for bearish rejection – Sell only after a shooting star or bearish engulfing pattern forms.
- Follow the downtrend – Take sell trades when the 4-hour chart shows lower highs and lower lows.
- Set a controlled stop-loss – Place the stop-loss 15-25 pips above the resistance level.
- Target the next support – Aim for 30-70 pips or use a minimum 1:2 risk-to-reward ratio.
- Confirm with momentum – Look for RSI below 70 or a bearish MACD crossover before selling.
- Skip weak resistance – Don’t sell if price closes strongly above the resistance zone.
- Reduce risk in volatility – Trade with 1-2% account risk during volatile daily market sessions.
The Zee Support Resistance Indicator MT4 gives traders a practical way to identify important market levels without spending hours drawing them manually. It helps organize chart analysis, improves trade planning, and highlights areas where price has reacted in the past. Key points include using confirmation candles before entering trades, focusing on higher-timeframe levels for stronger signals, combining the indicator with tools like RSI or moving averages, and respecting risk management because no setup is certain. Traders who treat support and resistance as decision zones rather than guaranteed reversal points often make more consistent choices. Used with patience and disciplined execution, the Zee Support Resistance Indicator MT4 can become a valuable part of a well-balanced trading strategy.
Level up your trading
Learn to read the chart — not just the indicator
eBook · Instant PDF
Video Course · 12 modules
Recommended MT4/MT5 Brokers
- ✓ *FREE *$50 to start (withdrawable)
- ✓ Deposit bonus up to $5,000
- ✓ Negative balance protection
Trading forex and CFDs carries a significant risk of loss and is not suitable for everyone. Broker links are affiliate links — we may earn a commission at no cost to you.
Free MT4 Indicator Download

Enter Your Email Address below, download link will be sent to you.