

Many traders have experienced this situation. They enter a trade on EUR/USD after a strong breakout, only to see the move slow down a few minutes later. The price barely moves, then reverses before reaching the profit target. The setup looked good, but one key detail was missing. The market had already traveled most of its normal daily distance.
This is where the MT4 Average Daily Range Indicator becomes useful. Instead of guessing how much room price has left, traders can measure the average number of pips a currency pair moves each day. That simple information helps avoid chasing exhausted trends and setting unrealistic profit targets.
Missing this detail often leads to poor risk-to-reward ratios, emotional decisions, and unnecessary losses. A trader may hold winning positions too long or enter after the biggest part of the move has already happened. The Average Daily Range indicator helps solve that problem by adding realistic expectations to every trade.
The sections below explain how this indicator works, where it performs best, and how traders can combine it with price action for better trade management.
What Is the MT4 Average Daily Range Indicator?
The MT4 Average Daily Range Indicator, often called the ADR indicator, measures the average distance between the daily high and daily low over a selected number of trading days. Instead of predicting market direction, it estimates how far price usually moves during a normal trading session.
Many versions use a default calculation of 5, 10, or 20 trading days. For example, if GBP/USD has averaged 115 pips per day over the previous 10 sessions, the indicator displays that value on the chart.
Unlike the Average True Range (ATR), which measures volatility across individual candles, the ADR focuses only on completed daily ranges. That makes it especially useful for setting realistic profit targets and identifying when price may be running out of momentum.
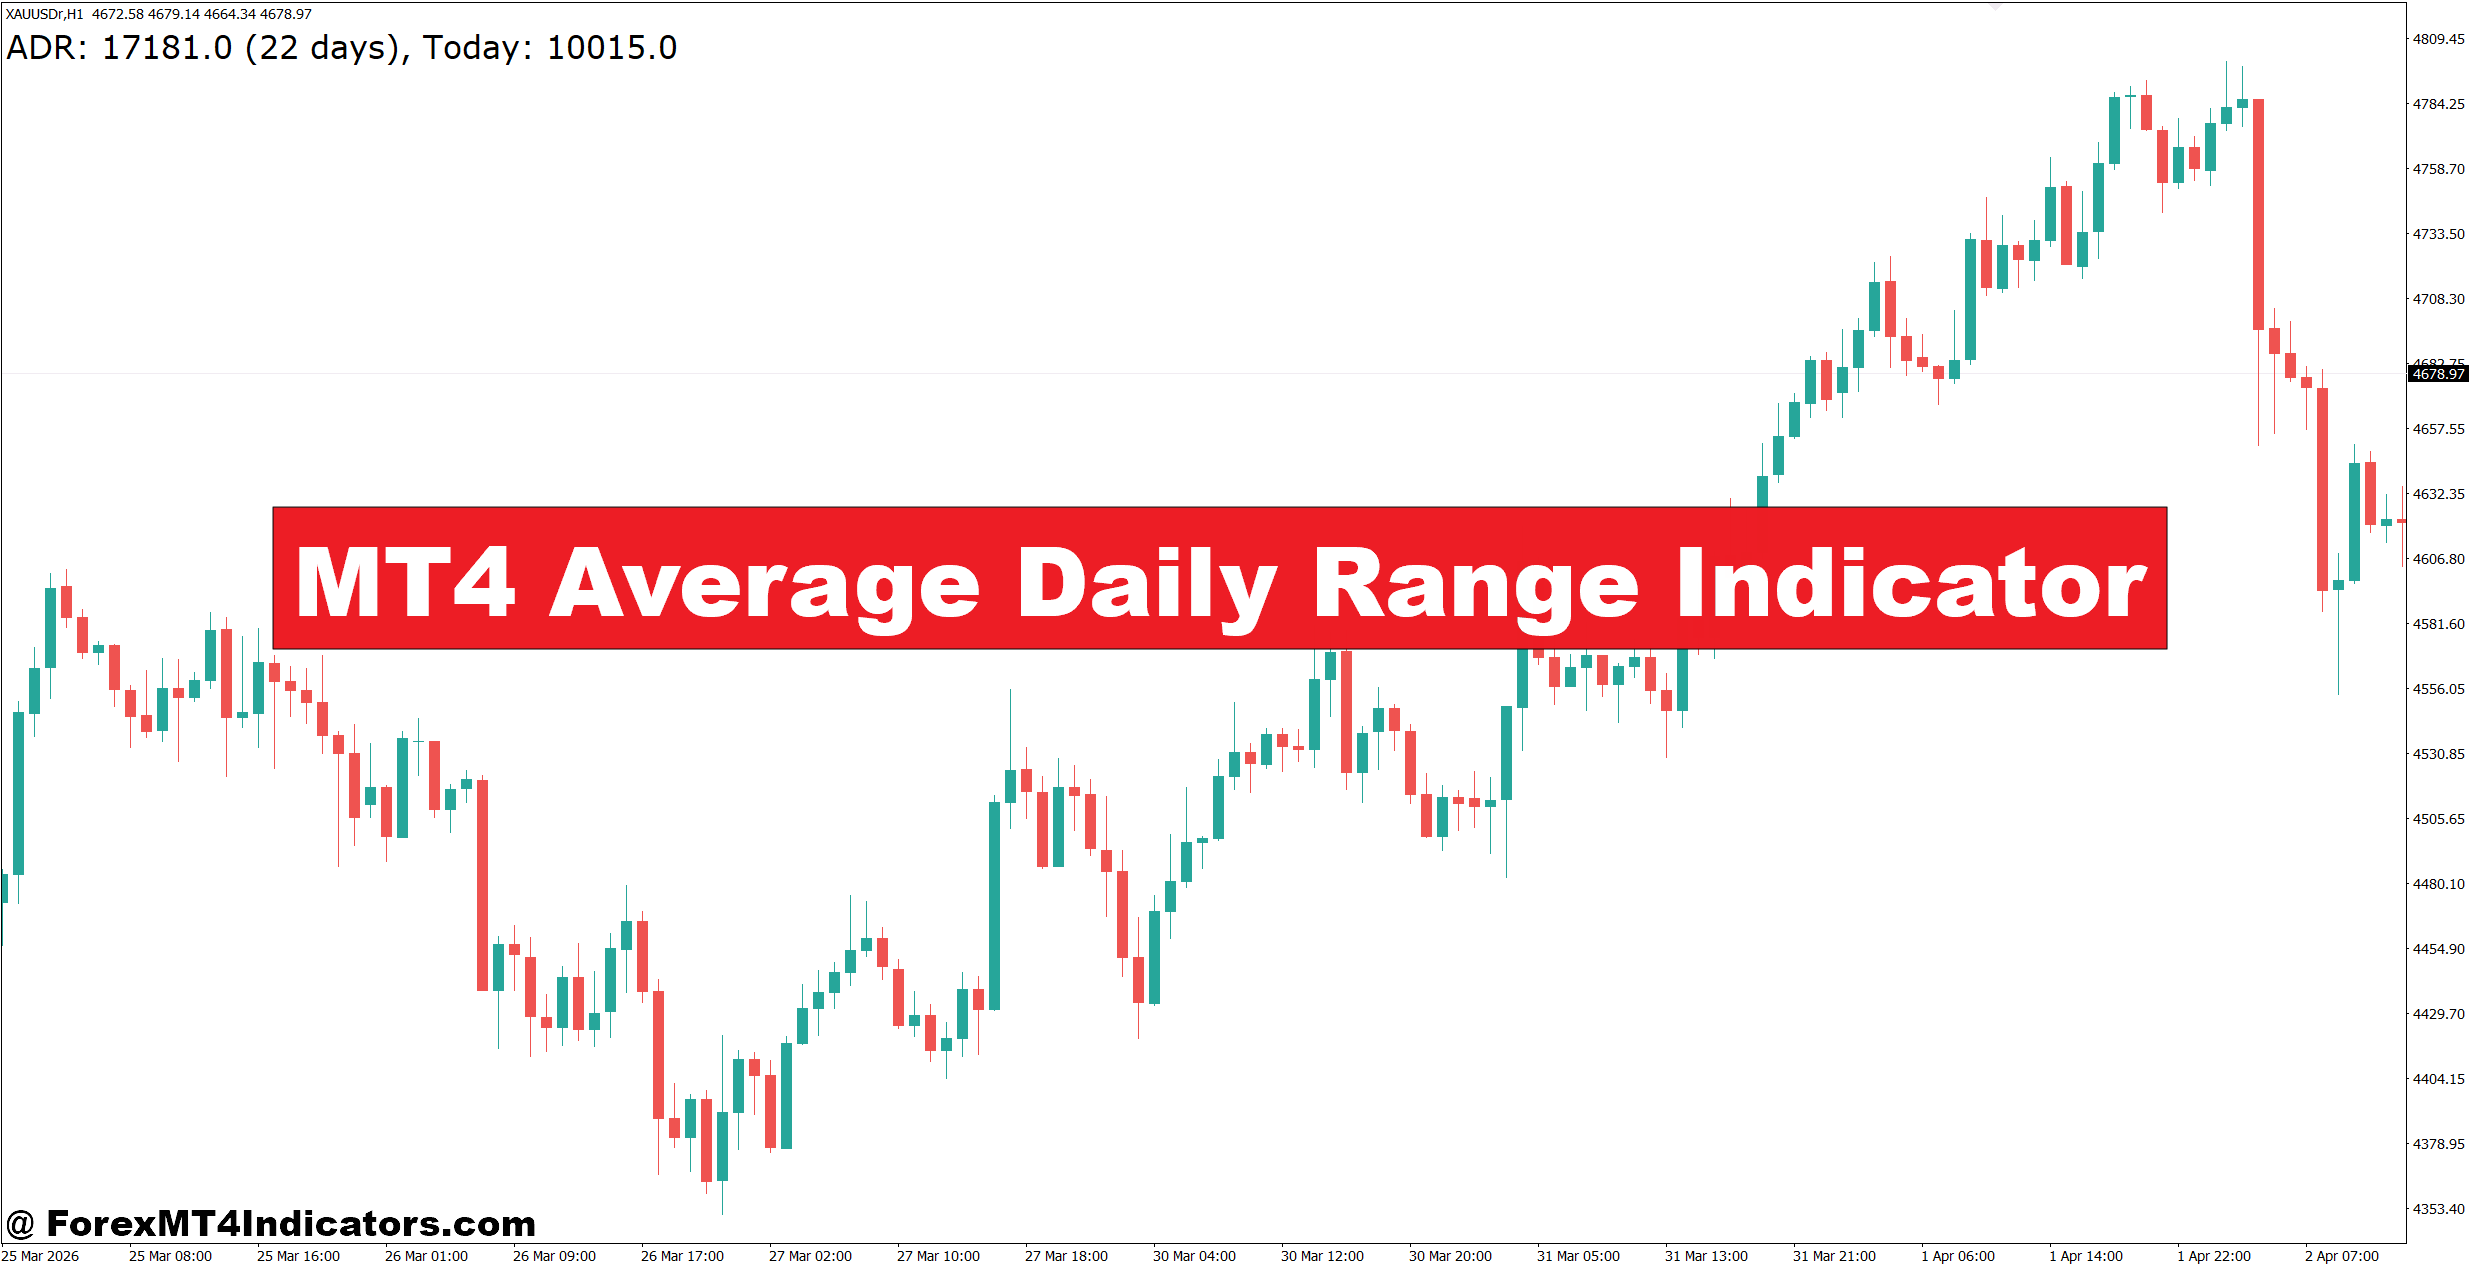
Most traders place the indicator in a corner of the MT4 chart where it updates automatically throughout the trading day.
How the Average Daily Range Indicator Works
The calculation is straightforward. The indicator records each day’s high and low, measures the difference in pips, then averages those values over the selected period.
For example:
- Day 1 range: 92 pips
- Day 2 range: 108 pips
- Day 3 range: 101 pips
- Day 4 range: 115 pips
- Day 5 range: 104 pips
The average daily range equals 104 pips.
Suppose EUR/USD has already moved 95 pips by the New York session while the ADR is 100 pips. That doesn’t guarantee the move will stop. But it does tell traders that most of the pair’s normal daily movement has already occurred. Buying at that stage carries more risk than buying early in the session.
When testing this on volatile Non-Farm Payroll (NFP) days, many traders notice that price can exceed the ADR by 30 to 80 pips. During major news releases, the indicator should be treated as a guideline instead of a strict limit.
Another practical use involves stop-loss placement. If a trader sets a 120-pip target on a pair averaging only 70 pips per day, the market may need several sessions to reach that objective.
Using the Indicator in Real Trading
The Average Daily Range indicator works best when combined with price action instead of acting as a standalone entry signal.
Imagine EUR/USD on the 1-hour chart during the London session. The pair breaks above resistance after forming a bullish engulfing candle. At that moment, price has covered only 35 pips of its typical 90-pip ADR. There is still room for buyers to push the market higher, making the trade more attractive.
Now consider USD/JPY on the 15-minute chart. The pair has already climbed 92 pips while its ADR is only 95 pips. A breakout appears near the U.S. market open, but the remaining average range is very small. Experienced traders may decide to skip the trade because the reward no longer justifies the risk.
The indicator also helps during ranging markets. If GBP/USD has completed nearly its full ADR before reaching a major resistance level, aggressive breakout trades become less appealing. Waiting for the next trading session often produces cleaner opportunities.
Some traders even use ADR percentages:
ADR Below 40%
Price still has plenty of room to expand. Trend-following trades may have better potential.
ADR Between 40% and 80%
This is often considered the most active trading zone where continuation setups appear frequently.
ADR Above 90%
Many traders become cautious. Chasing momentum after most of the daily range is complete can increase the chance of a fake-out or reversal.
No percentage works every day. Strong trends can continue beyond the average range.
Best Settings and Customization Tips
The indicator can be adjusted based on trading style and currency pair.
For scalpers trading the 5-minute or 15-minute chart, a 5-day ADR reacts quickly to changing volatility. Swing traders usually prefer a 20-day average because it smooths temporary spikes.
Suggested settings include:
- 5-Day ADR for active intraday trading.
- 10-Day ADR for balanced day trading.
- 20-Day ADR for swing trading and long-term market analysis.
Currency pairs also behave differently.
EUR/USD often averages between 70 and 110 pips depending on market conditions.
GBP/JPY regularly exceeds 140 pips during active sessions.
AUD/USD usually moves less than GBP pairs, so profit targets should reflect its lower volatility.
A trader should avoid copying settings from another pair without checking recent market behavior.
Strengths, Weaknesses, and Comparison with Similar Indicators
One reason traders like the MT4 Average Daily Range Indicator is its simplicity. It gives useful information without covering the chart with extra lines or complicated calculations.
Its main strengths include:
- Helps create realistic take-profit targets.
- Prevents late entries after large daily moves.
- Improves risk-to-reward planning.
- Works well with support and resistance levels.
- Fits almost every trading strategy.
The indicator also has limitations.
It cannot predict market direction. A pair can exceed its average range during central bank announcements, unexpected news, or strong trend days. Traders should never use ADR as the only reason to enter or exit a position.
Compared with the ATR indicator, ADR focuses on completed daily movement while ATR measures ongoing volatility candle by candle. ATR is often better for dynamic stop-loss placement. ADR provides a clearer picture of how much distance price has already traveled during the current session.
Many experienced traders combine both tools. ATR helps manage risk, while ADR helps estimate realistic profit potential.
Trading forex carries substantial risk. No indicator guarantees profits. Every setup should be confirmed with price action, market structure, and proper risk management before entering a position.
How to Trade with MT4 Average Daily Range Indicator
Buy Entry
- Buy below 50% ADR – Enter when EUR/USD has moved less than 50% of its 80-pip ADR on the 1-hour chart.
- Trade with the trend – Buy only when price stays above the 50 EMA on the 4-hour timeframe.
- Confirm breakout – Enter after a resistance breakout with a candle closing at least 10 pips above the level.
- Use support bounce – Buy after a bullish rejection from daily support with 20-30 pips of ADR remaining.
- Check ADR remaining – Look for at least 30% of the daily range left before entering.
- Place stop-loss wisely – Keep the stop-loss 15-25 pips below the recent swing low.
- Target realistic profits – Aim for 30-60 pips or before the pair reaches 90-100% of its ADR.
- Avoid late entries – Don’t buy if GBP/USD has already completed more than 95% of its average daily range.
Sell Entry
- Sell below resistance – Enter after a bearish rejection at resistance on the 1-hour or 4-hour chart.
- Follow the downtrend – Sell only when price trades below the 50 EMA on the 4-hour timeframe.
- Confirm bearish breakout – Wait for a candle to close 10-15 pips below support before selling.
- Check ADR usage – Sell when less than 70% of the ADR has been completed, leaving room for downside.
- Use swing high stop-loss – Place the stop-loss 15-25 pips above the recent swing high.
- Take profit early – Exit near 90-100% of the average daily range instead of expecting oversized moves.
- Avoid selling exhausted moves – Skip trades if EUR/USD has already moved 95-100% of its daily ADR.
- Stay out during major news – Avoid sell signals before high-impact events when ADR levels can be exceeded quickly.
Final Thoughts
The MT4 Average Daily Range Indicator gives traders a practical way to judge how much movement a currency pair has already made during the trading day. It helps set realistic profit targets, reduces the temptation to chase extended moves, supports better trade timing, and works well alongside price action and support or resistance analysis. At the same time, it has limits because unusual market events can easily push price beyond its historical average. Traders who combine the indicator with sound risk management, disciplined position sizing, and confirmation from other technical tools often make more informed decisions instead of relying on hope or emotion alone.
Level up your trading
Learn to read the chart — not just the indicator
eBook · Instant PDF
Video Course · 12 modules
Recommended MT4/MT5 Brokers
- ✓ *FREE *$50 to start (withdrawable)
- ✓ Deposit bonus up to $5,000
- ✓ Negative balance protection
Trading forex and CFDs carries a significant risk of loss and is not suitable for everyone. Broker links are affiliate links — we may earn a commission at no cost to you.
Free MT4 Indicator Download

Enter Your Email Address below, download link will be sent to you.