

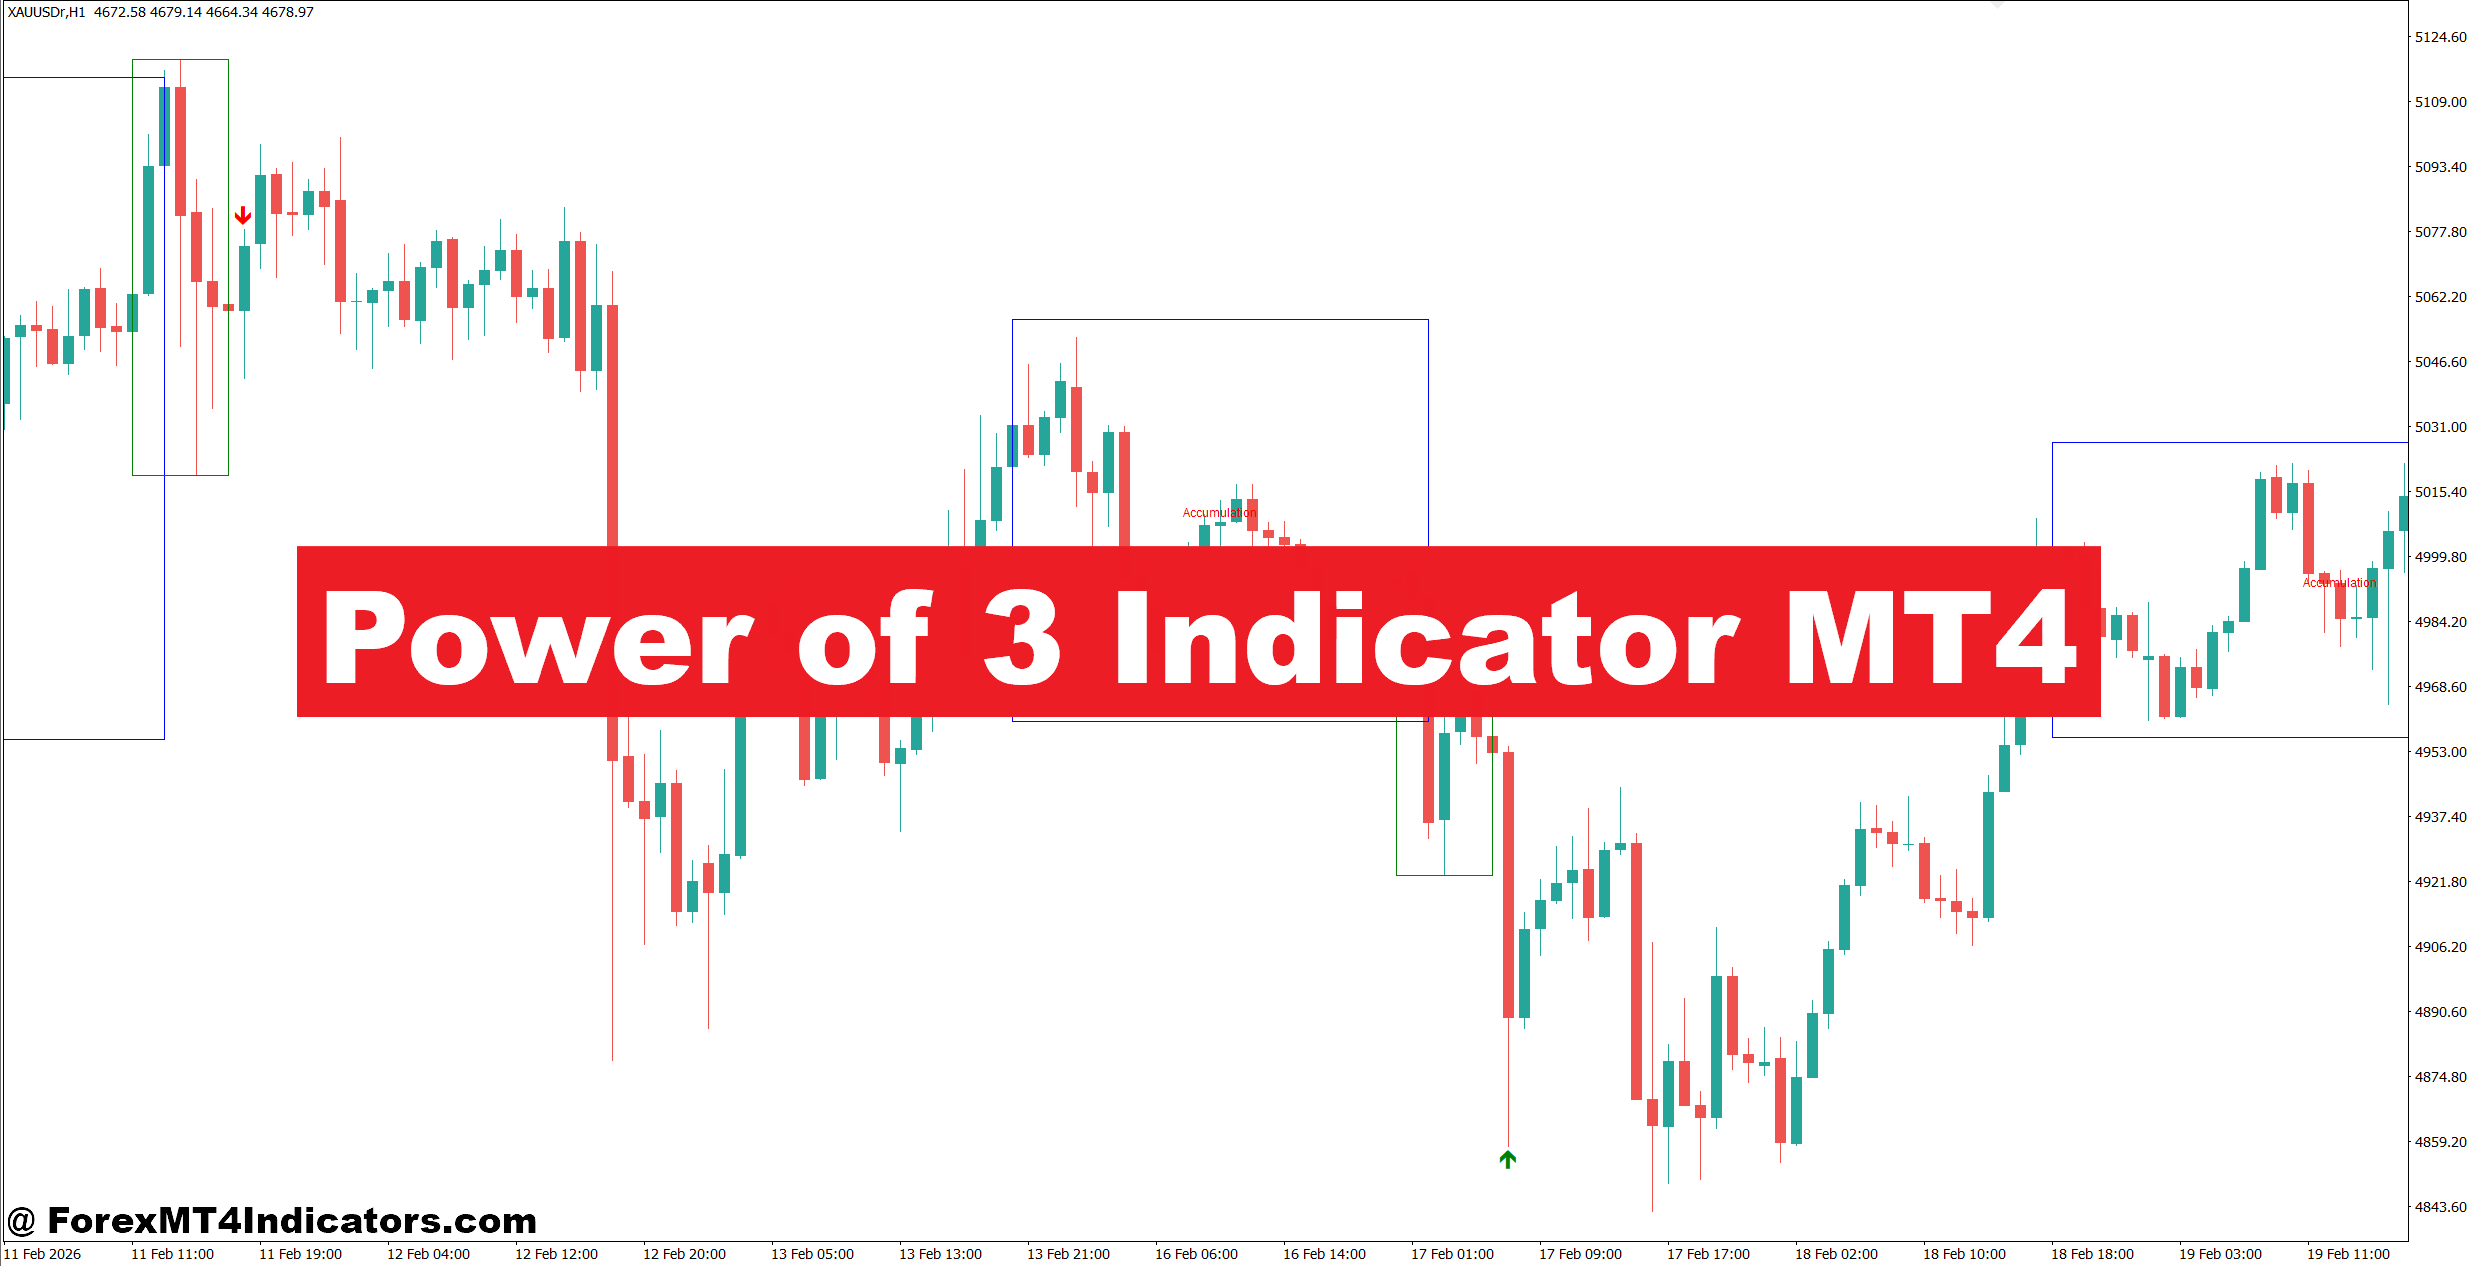
The Power of 3 Indicator MT4 helps traders look beyond simple breakouts. Instead of chasing every move, it focuses on how institutional price movement often develops through accumulation, manipulation, and expansion. That gives traders another way to judge whether a breakout has real strength or is simply a fake-out designed to trap retail traders.
Many traders combine this indicator with support and resistance, market structure, and trend analysis instead of relying on it by itself. The following sections explain how it works, where it performs well, and what traders should know before adding it to their trading plan.
Understanding the Power of 3 Indicator MT4
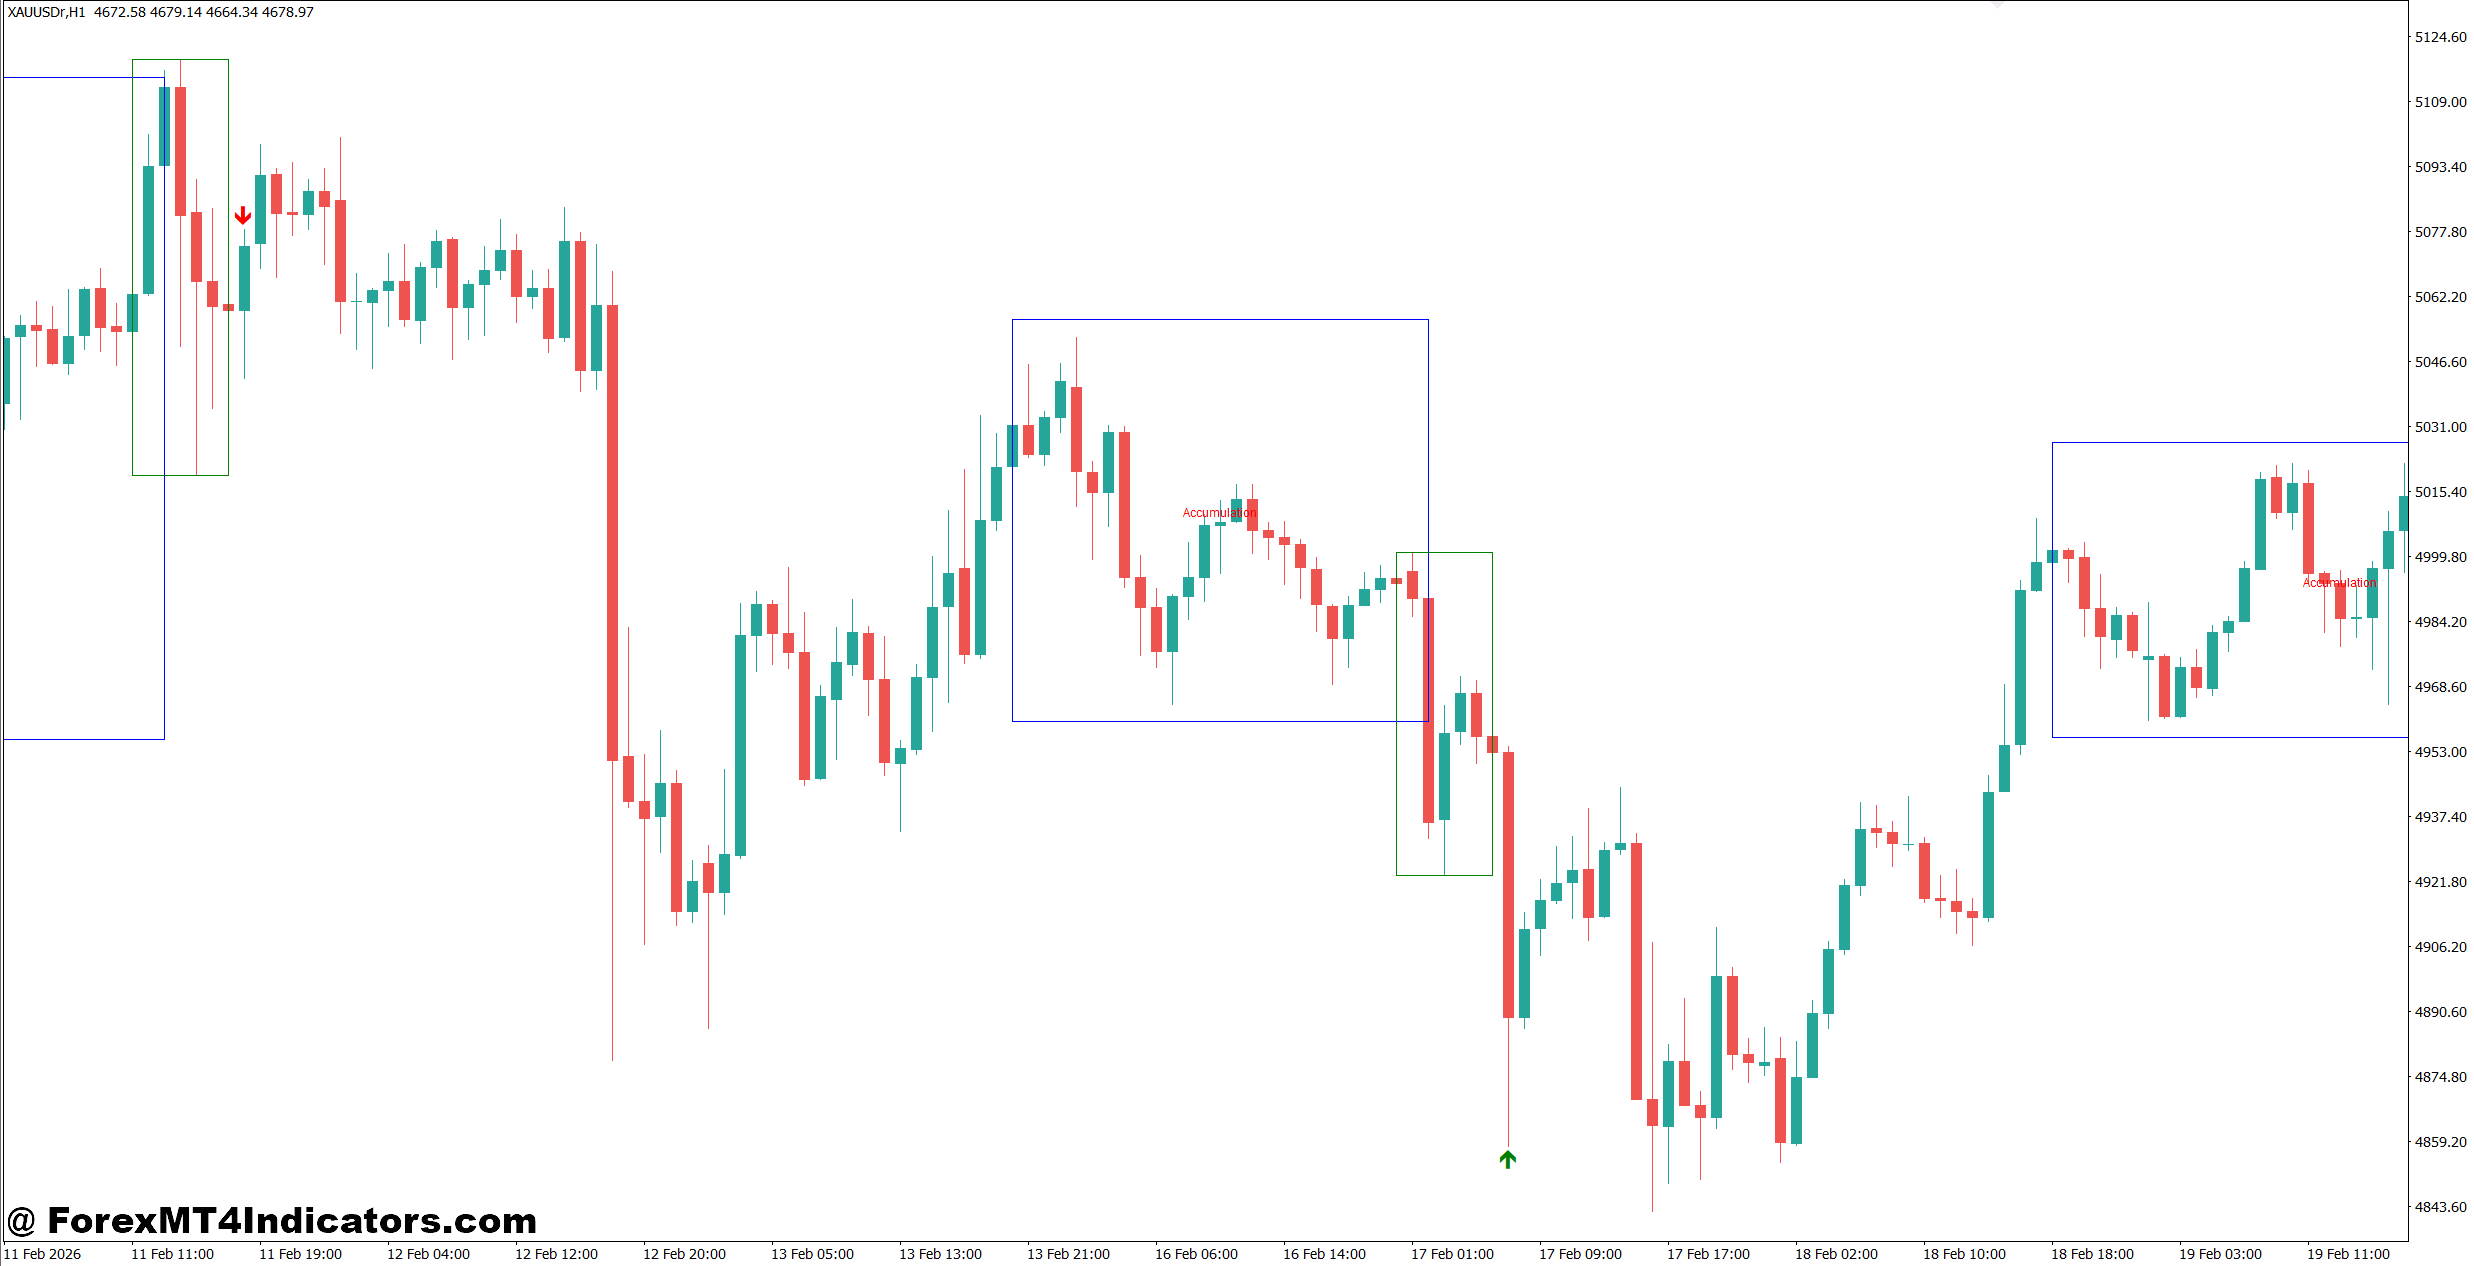
The Power of 3 Indicator MT4 is based on a trading concept that divides market movement into three distinct phases. The idea comes from institutional trading behavior rather than a traditional mathematical oscillator.
The three phases include:
- Accumulation – Price moves inside a relatively tight range while buying and selling pressure stays balanced.
- Manipulation – Price briefly breaks above or below the established range, encouraging traders to enter in the wrong direction.
- Expansion – The actual trend begins after liquidity has been collected from trapped traders.
Instead of producing signals from moving averages or oscillators, the indicator identifies these market phases visually. Many versions display colored zones, directional arrows, or highlighted price ranges to help traders recognize potential institutional activity.
This makes the indicator especially useful for traders who already study liquidity, market structure, and price action.
How the Indicator Works in Live Market Conditions
The logic behind the indicator focuses on price behavior instead of lagging calculations.
During the accumulation phase, the market often trades sideways for several hours or even an entire trading session. Volatility stays relatively low while buyers and sellers remain balanced.
The manipulation phase begins when price suddenly pushes outside that range. At first glance, it appears to be a breakout. In reality, the move may simply trigger stop-loss orders and attract breakout traders before reversing.
The expansion phase follows once liquidity has been collected. This is usually where stronger directional momentum develops.
For example, EUR/USD on the 1-hour chart may spend most of the London morning trading between 1.1670 and 1.1700. During the New York session, price spikes above 1.1715 by around 15 pips before quickly falling back below the range. Shortly afterward, sellers take control and the pair declines nearly 70 pips. Traders using the Power of 3 concept would view the initial breakout as possible manipulation instead of immediately buying.
Here’s the thing. No indicator predicts these moves with complete accuracy. Traders still need confirmation from market structure, candlestick patterns, or higher-timeframe analysis.
Practical Trading Strategies Using the Power of 3 Indicator
Trading Trend Continuations
One common approach is waiting for manipulation to finish before entering in the direction of the larger trend.
Suppose GBP/USD is making higher highs on the 4-hour chart. During the London session, price briefly drops below intraday support by 20 pips before recovering above the previous range. That recovery may signal the manipulation phase has ended.
Some traders enter long after a bullish engulfing candle closes while placing the stop-loss 15 to 25 pips below the manipulation low. Profit targets often focus on the next resistance level or a minimum 1:2 risk-to-reward ratio.
Trading Session Breakouts
The indicator works well around major trading sessions.
Many experienced traders monitor the Asian session range. If the London session creates a false breakout below the Asian low before reversing higher, the expansion phase may continue throughout the European trading hours.
When testing this approach during volatile NFP days, some traders noticed that waiting 10 to 15 minutes after the news release reduced the number of false entries. News events can temporarily distort the normal Power of 3 pattern because volatility expands sharply.
Combining With Other Indicators
The Power of 3 Indicator MT4 performs better when combined with confirmation tools.
Popular combinations include:
- 200 EMA for overall trend direction.
- RSI (14) to avoid buying in extremely overbought conditions.
- ATR for setting realistic stop-loss distances.
- Daily support and resistance levels.
- Market structure analysis using swing highs and swing lows.
Using multiple confirmations often filters weaker setups without making the trading process overly complicated.
Best Settings and Customization
Different trading styles require different settings.
Scalpers often apply the indicator on the M5 or M15 chart while focusing on London and New York sessions. They usually prefer tighter stop-loss levels between 8 and 15 pips.
Intraday traders commonly use the H1 timeframe because it offers a good balance between signal quality and trading frequency.
Swing traders frequently monitor the H4 and Daily charts, allowing wider stop-loss placements of 40 to 80 pips depending on market volatility.
Currency pairs also matter.
EUR/USD and GBP/USD generally produce cleaner Power of 3 patterns due to their strong liquidity. Gold (XAU/USD) can also generate excellent setups, but price moves much faster, requiring larger stops and careful position sizing.
Instead of changing every parameter, many traders leave the default settings unchanged and focus more on selecting high-quality market conditions.
Strengths, Weaknesses, and Comparison With Similar Indicators
One advantage of the Power of 3 Indicator MT4 is that it encourages patience. Traders stop reacting to every breakout and begin watching how liquidity develops before entering the market.
It also fits naturally with price action trading since it doesn’t depend on lagging moving averages.
But the indicator has limitations.
Markets don’t always follow the accumulation-manipulation-expansion sequence perfectly. During low-volume sessions or unexpected central bank announcements, price can ignore the expected pattern completely.
Trading forex carries substantial risk. No indicator guarantees profits. Proper position sizing and disciplined risk management remain essential regardless of signal quality.
Compared with Bollinger Bands, the Power of 3 Indicator focuses more on liquidity behavior than volatility. Against the Parabolic SAR, it provides fewer signals but often encourages better trade selection. Compared with moving averages, it attempts to identify institutional intent instead of simply measuring trend direction.
That difference makes it attractive for traders who prefer reading price behavior instead of relying entirely on indicator crossovers.
The best results usually come from treating the indicator as one part of a complete trading strategy rather than a stand-alone decision maker.
How to Trade with Power of 3 Indicator MT4
Buy Entry
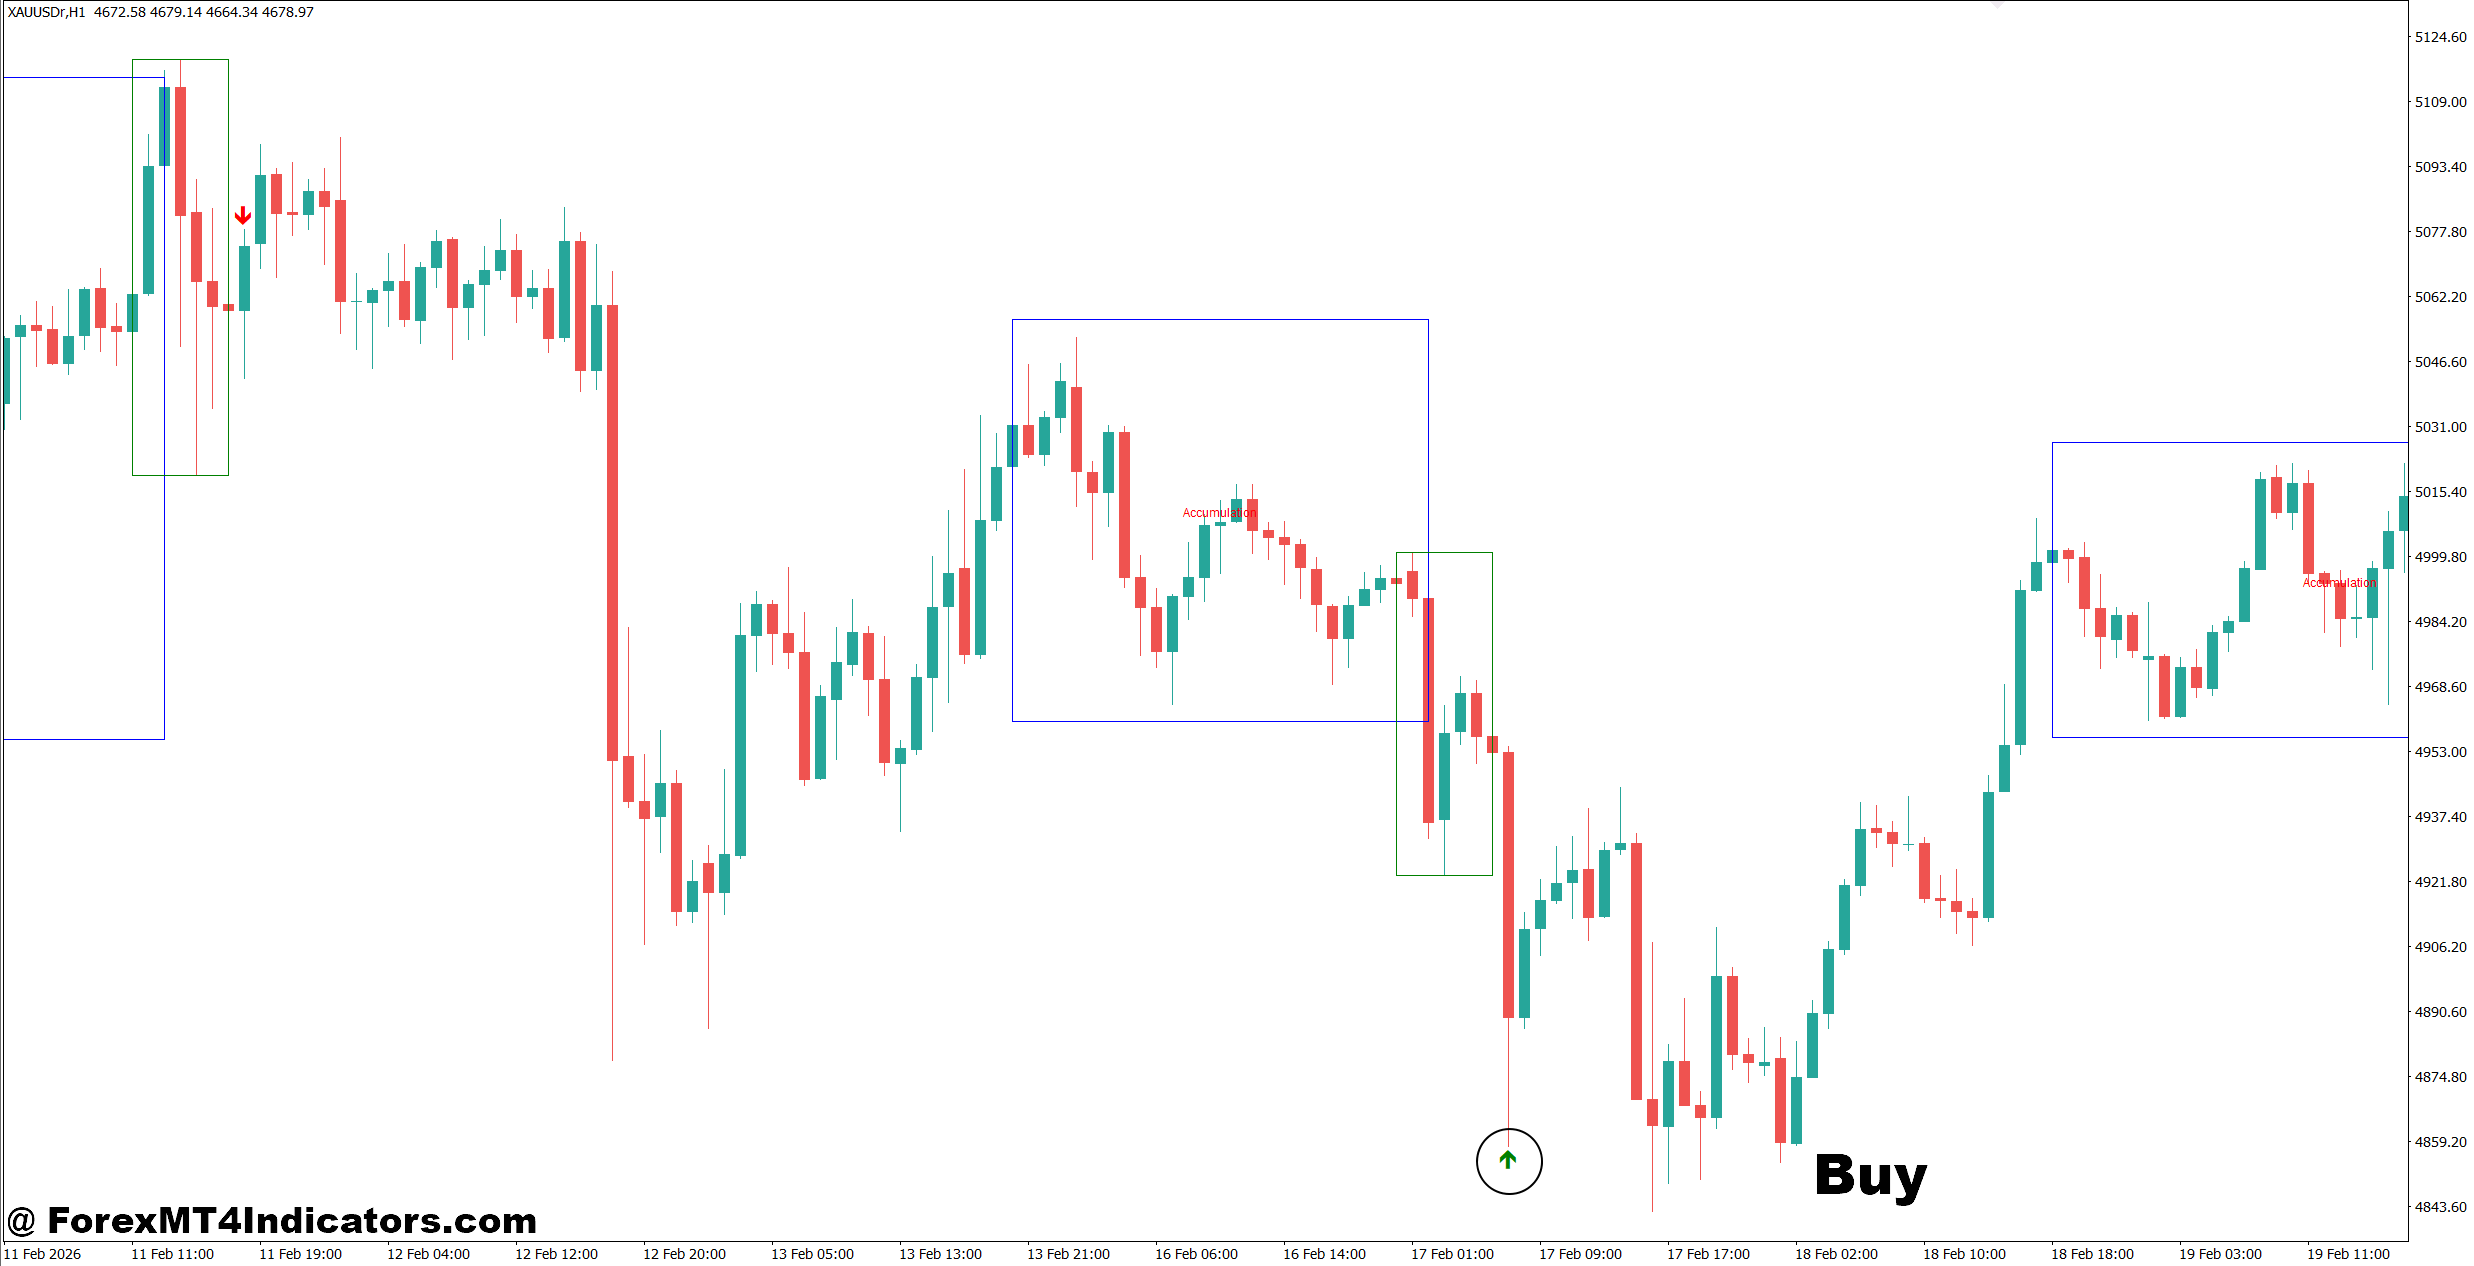
- Wait for the manipulation sweep – Enter a buy after price grabs liquidity below support and closes back above it on the 1-hour EUR/USD chart.
- Confirm bullish expansion – Buy when a strong bullish candle breaks the accumulation range by 15-20 pips with rising momentum.
- Trade with the higher trend – Only buy if the 4-hour trend remains bullish to improve trade probability.
- Place a tight stop-loss – Keep the stop 15-25 pips below the manipulation low to control risk.
- Target a 1:2 reward ratio – Aim for at least 40-60 pips if risking 20-30 pips.
- Use session confirmation – Look for buy setups during the London or New York session for stronger moves.
- Confirm with support – Buy only when the sweep occurs near a key daily support level.
- Skip weak markets – Avoid buy signals during low-volatility Asian sessions or before major news releases.
Sell Entry
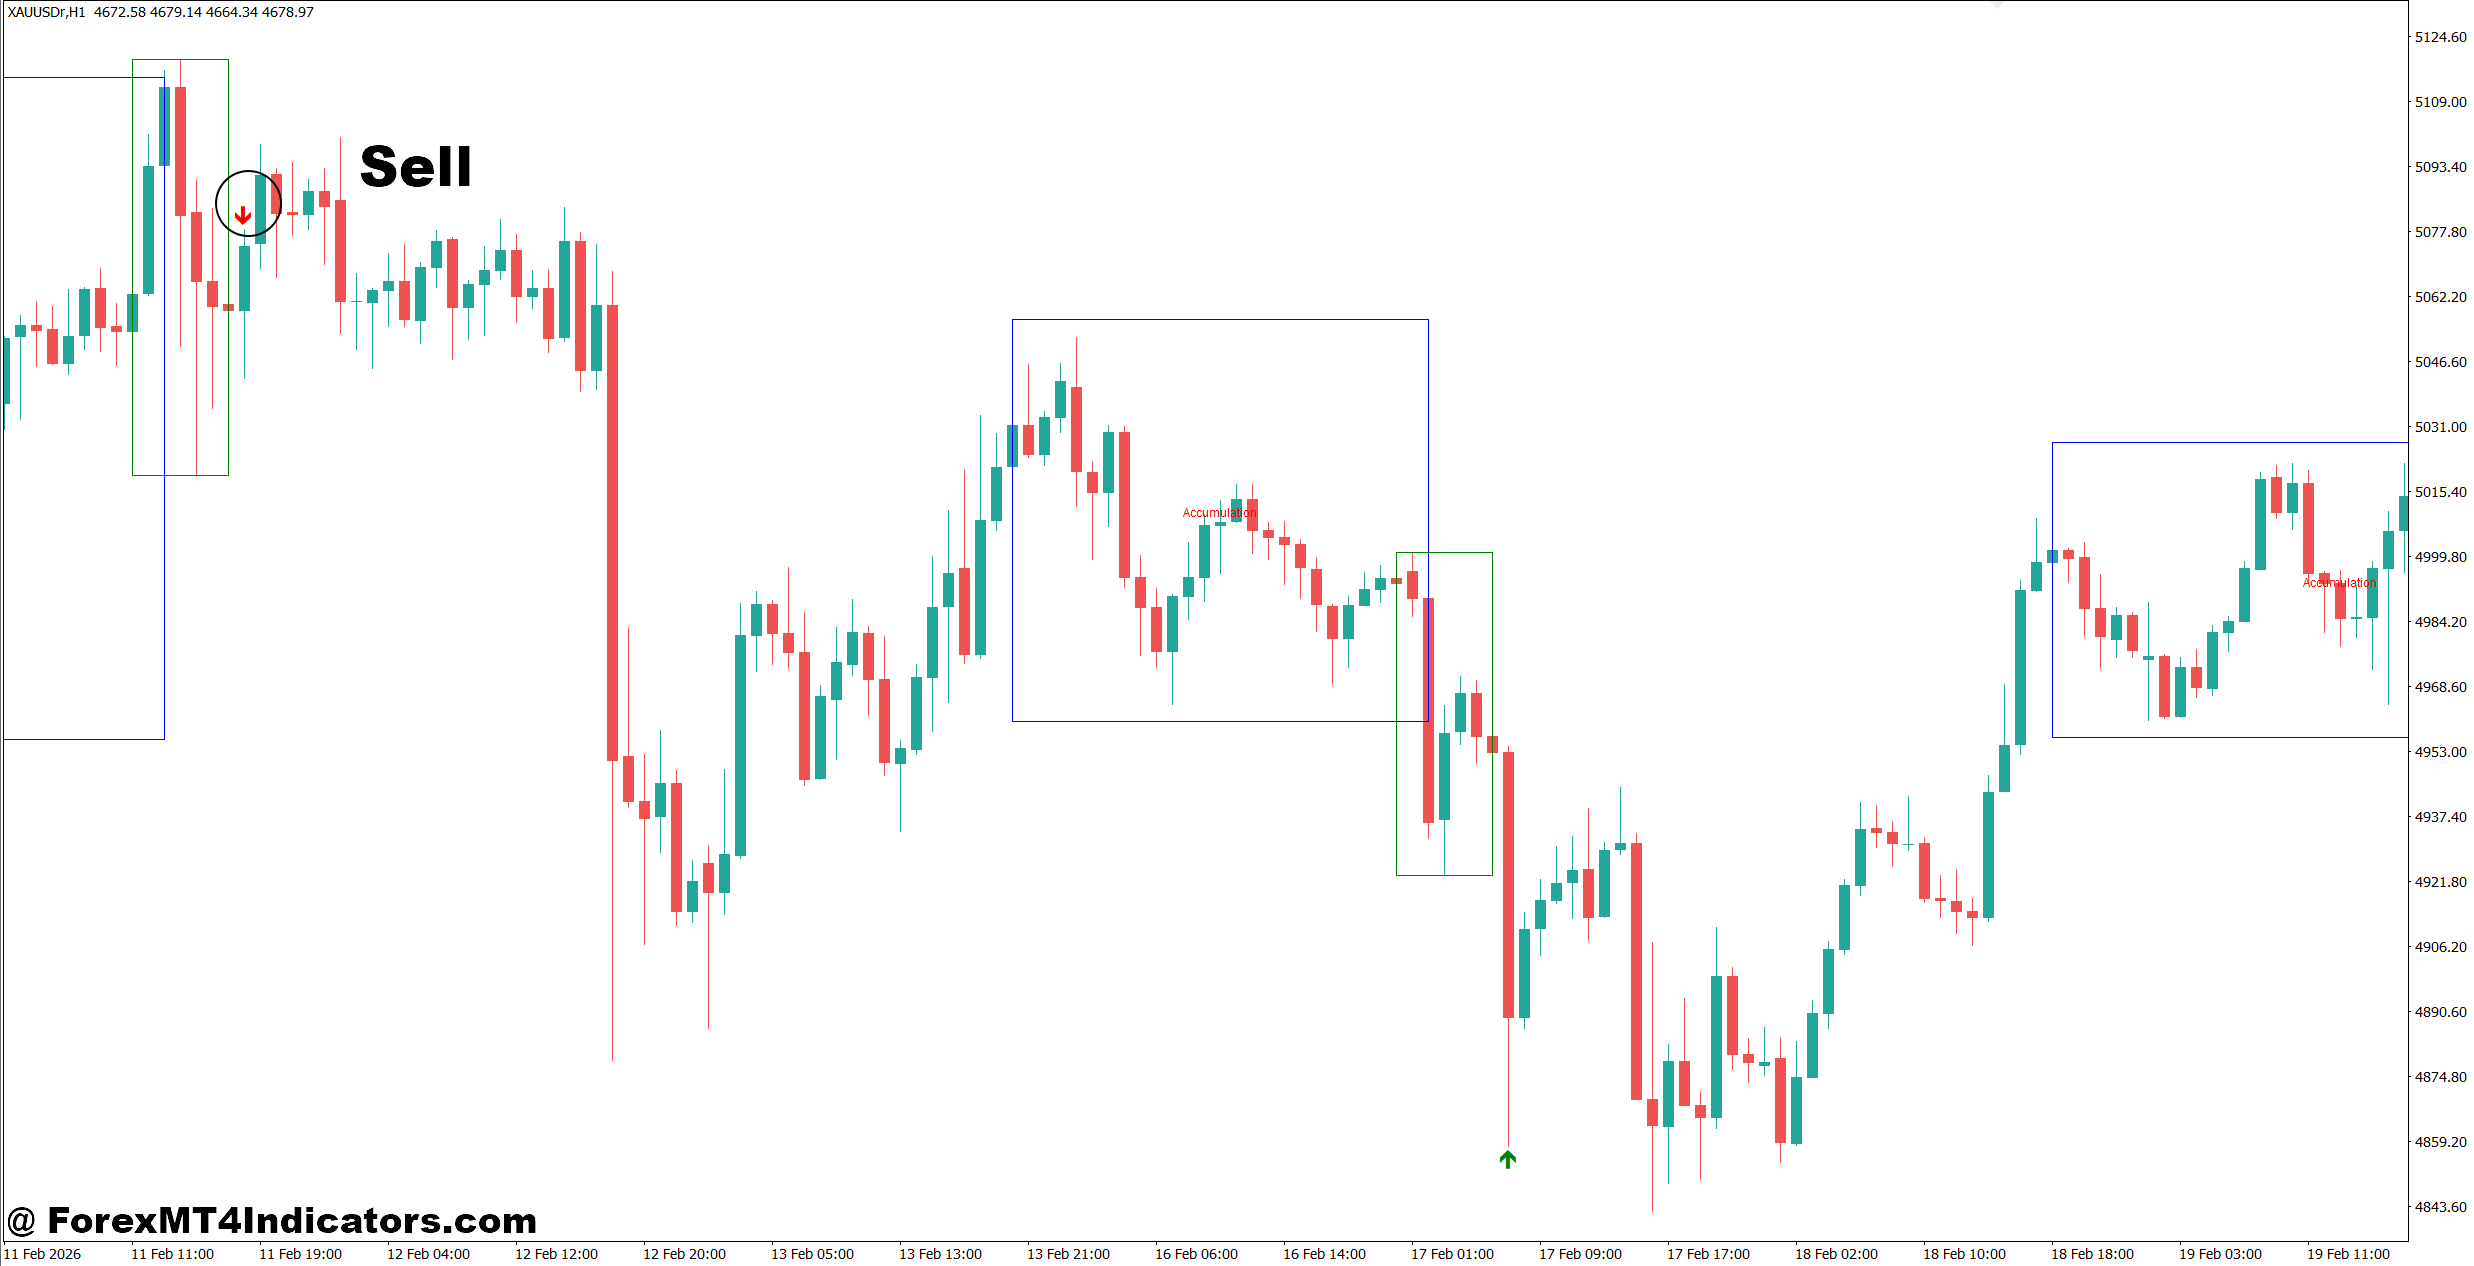
- Wait for the liquidity grab – Sell after price breaks above resistance and quickly closes back below it on the 1-hour GBP/USD chart.
- Confirm bearish expansion – Enter when a bearish candle drops 15-20 pips below the accumulation range.
- Follow the main trend – Take sell trades only if the 4-hour trend is already bearish.
- Protect with a stop-loss – Place the stop 15-25 pips above the manipulation high.
- Aim for solid reward – Target 50-80 pips while maintaining at least a 1:2 risk-to-reward ratio.
- Watch key resistance – Sell signals are stronger when they form near a daily resistance zone.
- Avoid chasing candles – Don’t enter after a move has already traveled 40+ pips without a pullback.
- Stay out during high-impact news – Skip sell entries around events like NFP or central bank announcements due to unpredictable volatility.
The Power of 3 Indicator MT4 offers a different way to study market movement by highlighting accumulation, manipulation, and expansion instead of traditional buy and sell signals. Traders often appreciate its ability to expose potential fake-outs, improve trade timing, and complement price action analysis while reducing emotional entries. At the same time, it performs best when paired with trend confirmation, support and resistance, and disciplined risk management. No trading tool is perfect, but this indicator can provide valuable market context for those willing to wait for quality setups and follow a consistent trading plan.
Level up your trading
Learn to read the chart — not just the indicator
eBook · Instant PDF
Video Course · 12 modules
Recommended MT4/MT5 Brokers
- ✓ *FREE *$50 to start (withdrawable)
- ✓ Deposit bonus up to $5,000
- ✓ Negative balance protection
Trading forex and CFDs carries a significant risk of loss and is not suitable for everyone. Broker links are affiliate links — we may earn a commission at no cost to you.
Free MT4 Indicator Download

Enter Your Email Address below, download link will be sent to you.