

The SMT Indicator MT4 helps traders identify these hidden differences by comparing the price movement between correlated markets. Instead of focusing on one chart, it highlights divergence that may signal weakening momentum or a possible reversal. During highly active sessions such as London or New York, these signals can provide extra confirmation before entering a trade. That doesn’t mean every divergence leads to a profitable move, but it can reduce the chances of trading obvious fake-outs. Understanding how this indicator works makes it easier to combine with market structure, support and resistance, and sound risk management.
What Is the SMT Indicator MT4?
The SMT Indicator MT4 is a technical analysis tool designed to detect Smart Money Technique (SMT) divergence between two related financial instruments. It compares price swings from correlated assets and highlights situations where one market makes a new high or low while the other fails to do the same.
The idea comes from the belief that correlated markets usually move in the same direction. When they stop doing that, traders often see it as a warning that buying or selling pressure may be losing strength.
For example, EUR/USD and GBP/USD often move together because both contain the US dollar. If EUR/USD creates a fresh higher high on the 1-hour chart while GBP/USD forms a lower high instead, the indicator marks that difference as SMT divergence. Some traders interpret this as an early signal that bullish momentum is fading.
Unlike oscillators such as RSI or Stochastic, the SMT Indicator MT4 compares price relationships rather than measuring overbought or oversold conditions.
How the SMT Indicator MT4 Works
The indicator tracks swing highs and swing lows on two selected markets. It then checks whether both instruments confirm each other’s movement.
A bullish SMT divergence appears when one pair makes a lower low while the comparison pair holds above its previous low. Traders often view this as a sign that selling pressure may be weakening.
A bearish SMT divergence forms when one market creates a higher high but the second market fails to confirm the move. This often suggests buyers are losing momentum.
Here’s a practical example.
During a London session, EUR/USD reaches a new daily high on the 1-hour chart near 1.1425. At the same time, GBP/USD fails to exceed its earlier high and turns lower. Instead of buying the breakout immediately, a trader waits for bearish confirmation such as a break below a recent support level. The trade enters with a 22-pip stop-loss above the swing high and targets the next support around 55 pips away, creating a risk-to-reward ratio close to 1:2.5.
When testing this on volatile NFP days, many traders notice that SMT signals appear more frequently because price moves quickly across related pairs. Waiting for the news volatility to settle before acting on a divergence often produces cleaner setups.
Using SMT Indicator MT4 in Real Trading
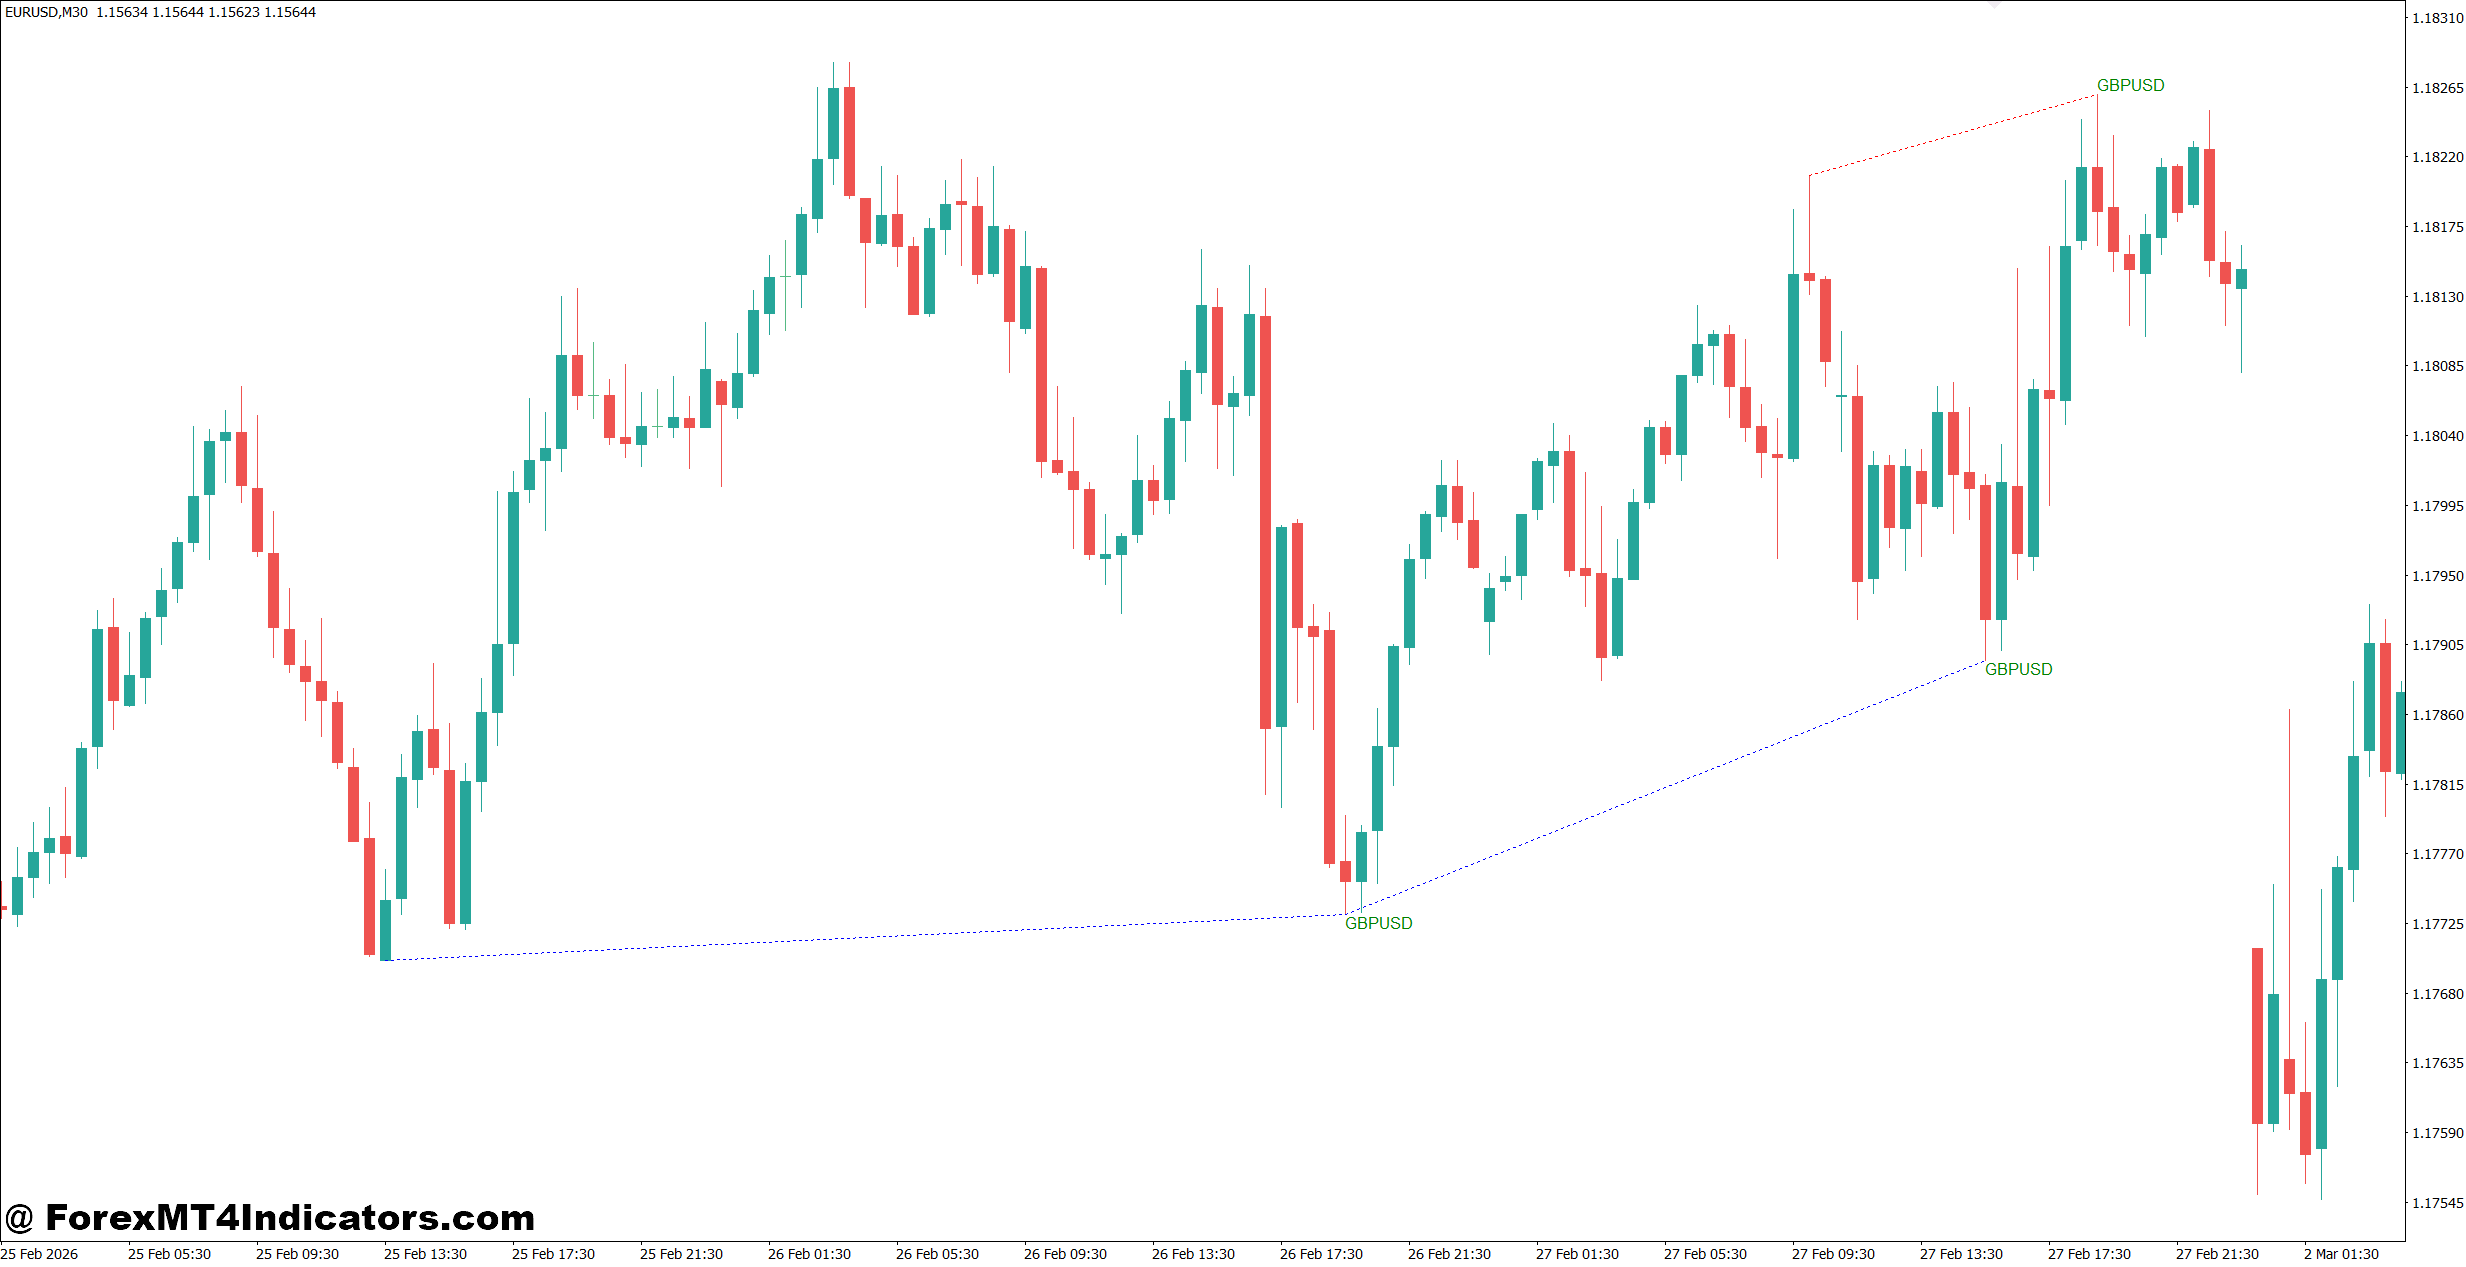
The indicator performs best when traders combine it with price action rather than using it as a standalone entry tool.
Trend Reversal Confirmation
SMT divergence becomes more reliable near strong support or resistance zones. If USD/JPY reaches weekly resistance while another correlated market fails to confirm the move, traders often look for bearish candlestick patterns before entering short positions.
Market Structure Analysis
Many experienced traders first identify higher highs, lower lows, and break of structure before checking SMT divergence. This approach filters weaker signals during sideways markets.
Multi-Timeframe Confirmation
A common method is to locate SMT divergence on the 4-hour chart and then switch to the 15-minute chart for a precise entry. This helps reduce stop-loss size while following the larger market direction.
Session Timing
The London and New York sessions usually generate the strongest SMT opportunities because trading volume increases. Signals during quiet Asian sessions may produce more sideways movement and slower follow-through.
Trading forex carries substantial risk. No indicator guarantees profits. Every setup should include a predefined stop-loss and position size that fits the trader’s overall risk plan.
Best Settings and Customization
Most SMT Indicator MT4 versions allow traders to adjust swing sensitivity, comparison symbols, and alert settings.
For swing traders using the 4-hour or daily chart, a wider swing detection period between 10 and 20 bars often removes unnecessary market noise.
Day traders working on the 15-minute or 1-hour chart usually prefer settings between 5 and 10 bars to capture shorter-term divergences.
Common market combinations include:
- EUR/USD and GBP/USD
- EUR/USD and DXY
- GBP/USD and EUR/USD
- Gold and the US Dollar Index
- NASDAQ and S&P 500 CFDs, when supported by the broker
Price feeds can differ slightly between brokers, so traders should test settings on a demo account before applying them to live positions.
Strengths, Weaknesses, and Comparison with Similar Indicators
One reason traders like the SMT Indicator MT4 is that it focuses on market relationships instead of looking only at one chart. This provides another layer of confirmation before entering trades.
It also works well with support and resistance analysis, liquidity zones, trendlines, and break-of-structure strategies. Traders following Smart Money Concepts often include SMT divergence as part of their overall market analysis.
That said, the indicator has limitations.
Strong trends can continue despite clear divergence signals. A bearish SMT setup during a major central bank announcement may fail if market sentiment remains overwhelmingly bullish. That’s why confirmation from price action remains essential.
Compared with the RSI, SMT divergence measures disagreement between two markets rather than momentum within one market. MACD focuses on moving average relationships, while SMT highlights correlation differences. Volume indicators attempt to measure participation, but forex relies mainly on tick volume, making SMT an attractive alternative for traders who focus on price behavior instead of volume estimates.
Many traders find the best results come from combining SMT divergence with one trend indicator and one market structure confirmation instead of filling the chart with multiple indicators that provide similar information.
How to Trade with SMT Indicator MT4
Buy Entry
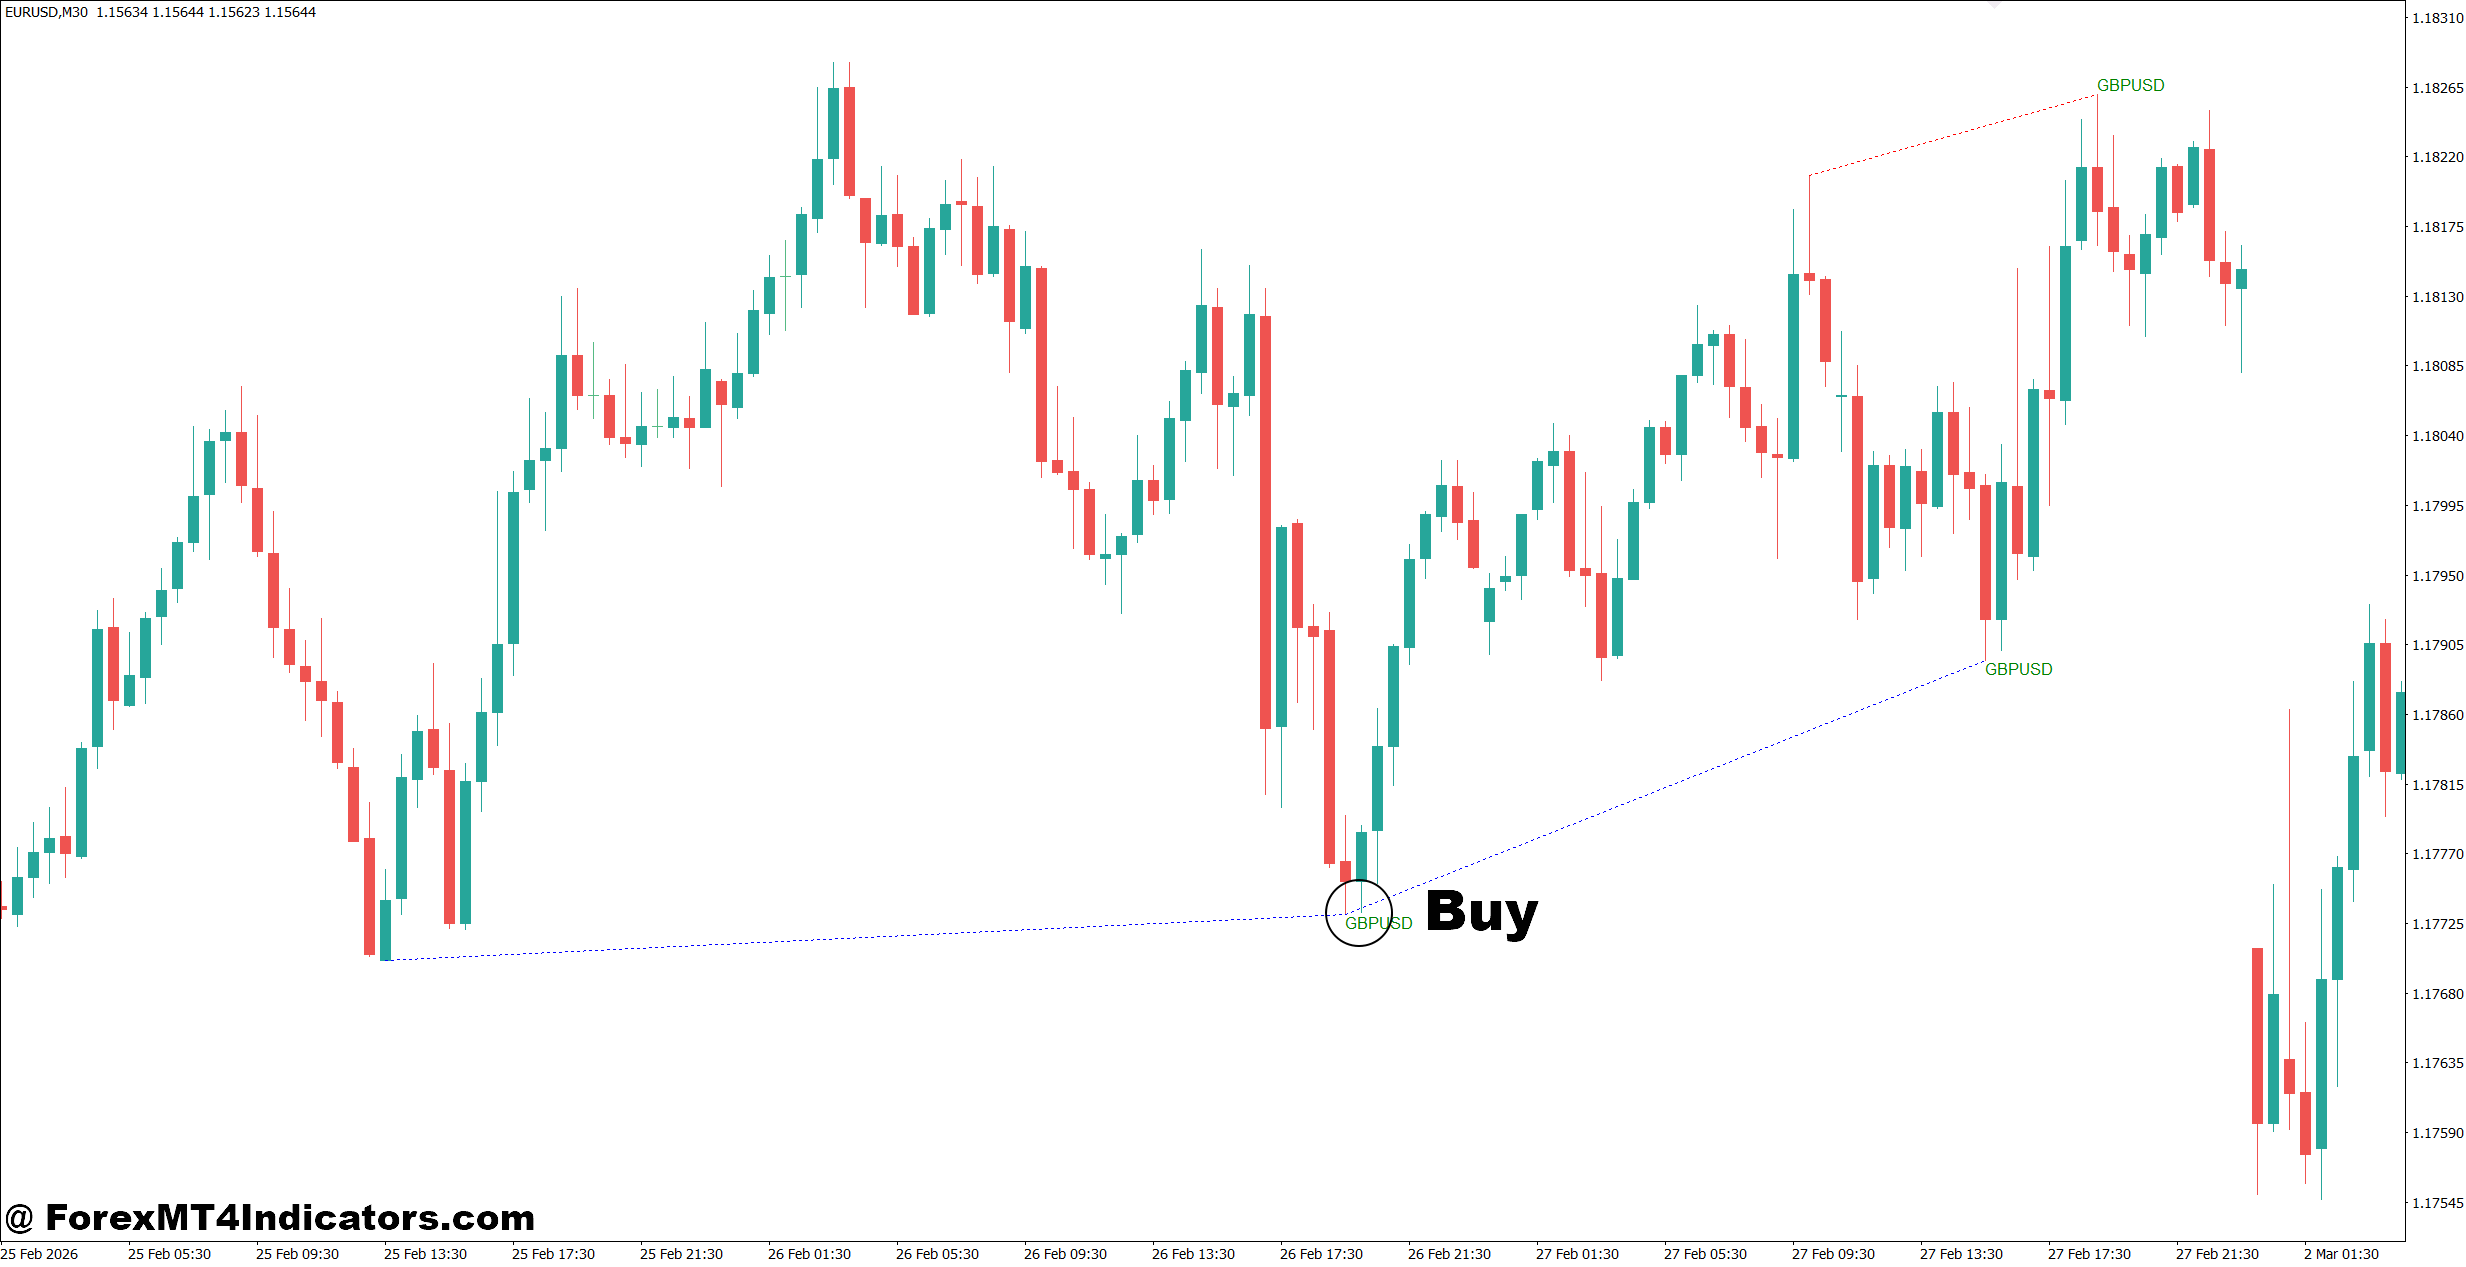
- Spot bullish SMT divergence – Buy when EUR/USD forms a lower low but GBP/USD doesn’t on the 1-hour chart.
- Wait for candle confirmation – Enter only after a bullish engulfing or strong rejection candle closes above support.
- Trade with the higher trend – Take buy setups only if the 4-hour trend remains bullish.
- Place a tight stop-loss – Keep the stop 15-25 pips below the recent swing low.
- Target a healthy reward – Aim for at least a 1:2 risk-to-reward ratio or 40-60 pips.
- Confirm with market structure – Buy after a break of the previous lower high for extra confirmation.
- Avoid major news events – Skip signals 30 minutes before and after NFP, CPI, or FOMC releases.
- Risk only 1-2% per trade – Protect trading capital even if the setup looks strong.
Sell Entry
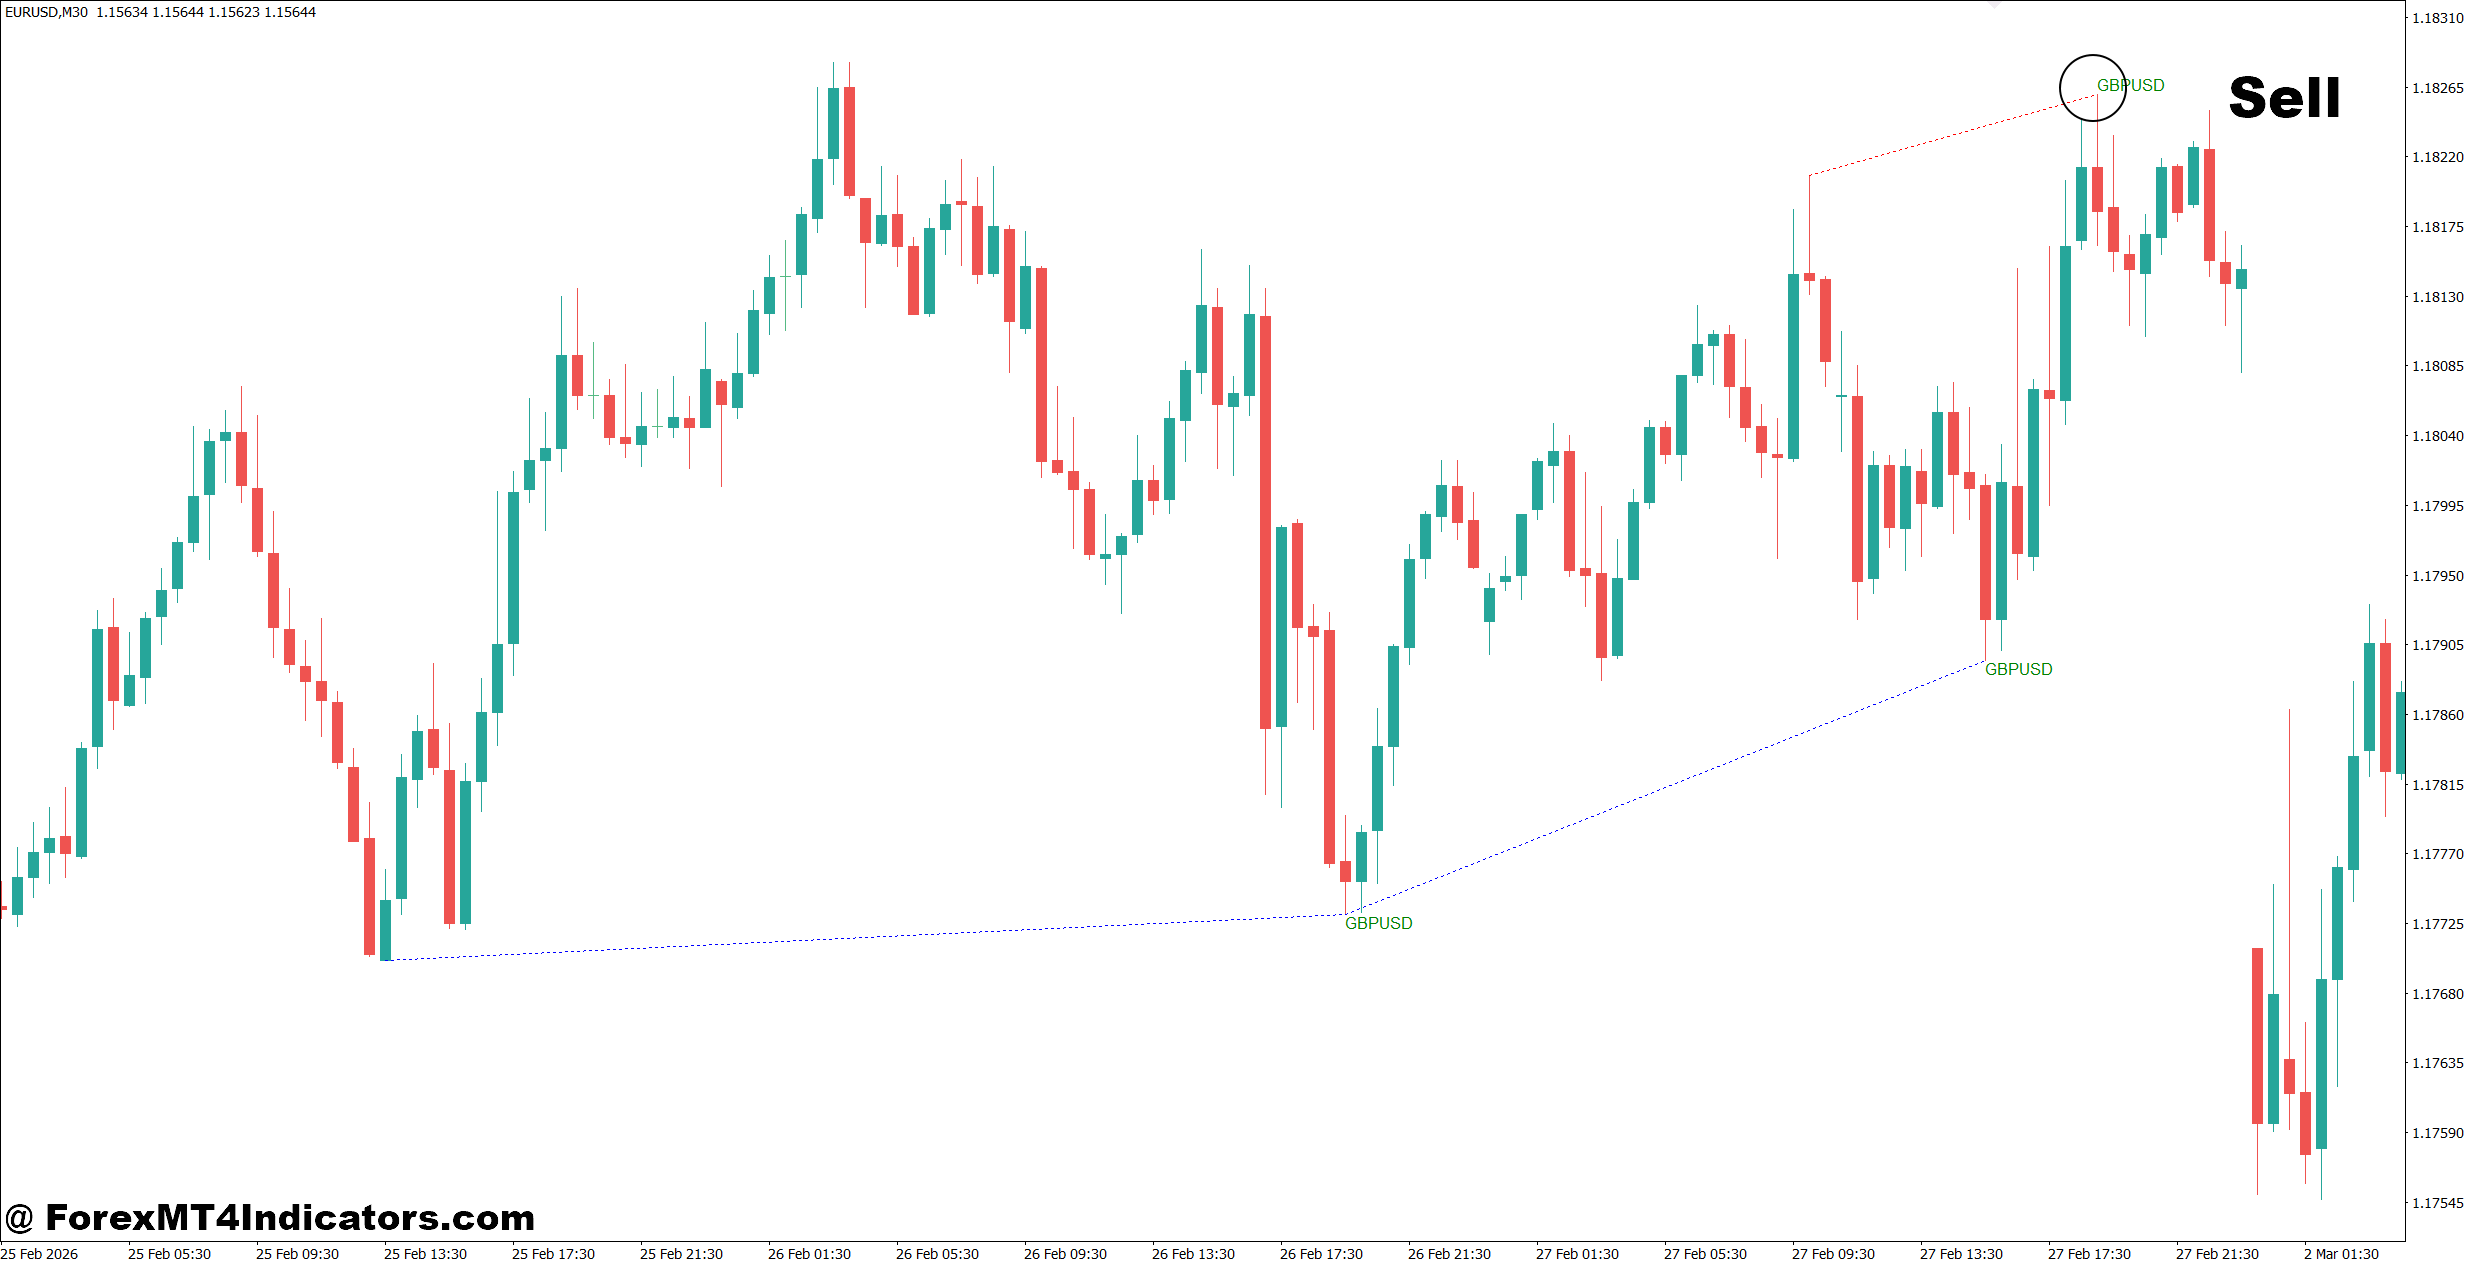
- Spot bearish SMT divergence – Sell when EUR/USD makes a higher high but GBP/USD fails to do the same on the 1-hour chart.
- Wait for bearish confirmation – Enter after a bearish engulfing candle or rejection from resistance.
- Follow the higher timeframe – Sell only when the 4-hour or daily trend is bearish.
- Place a protective stop-loss – Set the stop 15-25 pips above the latest swing high.
- Aim for larger winners – Target 40-80 pips while maintaining at least a 1:2 risk-to-reward ratio.
- Use support break confirmation – Enter after price closes below a key support level.
- Skip choppy markets – Don’t trade SMT signals during low-volatility sideways sessions.
- Limit account risk – Never risk more than 2% on a single trade, even with multiple confirmations.
The SMT Indicator MT4 gives traders another way to read market behavior by comparing correlated assets instead of relying on a single chart. Its biggest strengths include spotting potential reversals early, improving trade confirmation, working well alongside support and resistance, and fitting naturally into Smart Money trading strategies. At the same time, traders should remember that divergence alone isn’t a trade signal and can fail during strong trends or major news events. The most consistent results usually come from combining the SMT Indicator MT4 with disciplined risk management, patient confirmation, and a clear trading plan rather than expecting the indicator to predict every market move.
Level up your trading
Learn to read the chart — not just the indicator
eBook · Instant PDF
Video Course · 12 modules
Recommended MT4/MT5 Brokers
- ✓ *FREE *$50 to start (withdrawable)
- ✓ Deposit bonus up to $5,000
- ✓ Negative balance protection
Trading forex and CFDs carries a significant risk of loss and is not suitable for everyone. Broker links are affiliate links — we may earn a commission at no cost to you.
Free MT4 Indicator Download

Enter Your Email Address below, download link will be sent to you.