

The Premium and Discount Indicator MT4 helps solve this common problem by showing whether the market is trading at a relatively expensive (premium) or cheap (discount) price within a selected range. Instead of chasing candles after a strong move, traders can wait for price to enter areas that offer better risk-to-reward opportunities. This simple approach fits well with price action, support and resistance, and market structure analysis. When combined with proper confirmation, the indicator can help traders avoid poor entries and focus on trades that make more sense from a probability standpoint. Let’s look at how it works and where it performs best.
What Is the Premium and Discount Indicator MT4?
The Premium and Discount Indicator MT4 is a technical analysis tool that divides a price range into value zones. It helps traders determine whether price is trading above or below the equilibrium level, which is usually around the 50% midpoint of the selected swing.
When price trades above the equilibrium, the market is considered to be in the premium zone. Buyers may hesitate in this area because price has already moved higher. When price trades below the midpoint, it enters the discount zone, where buyers often begin searching for long opportunities.
The indicator doesn’t predict future price movement. Instead, it highlights locations where traders may find higher-probability entries after confirming trend direction and price action.
Many traders combine it with swing highs, swing lows, Fibonacci retracements, and supply and demand zones because these concepts all focus on finding value rather than chasing momentum.
How the Premium and Discount Indicator MT4 Works
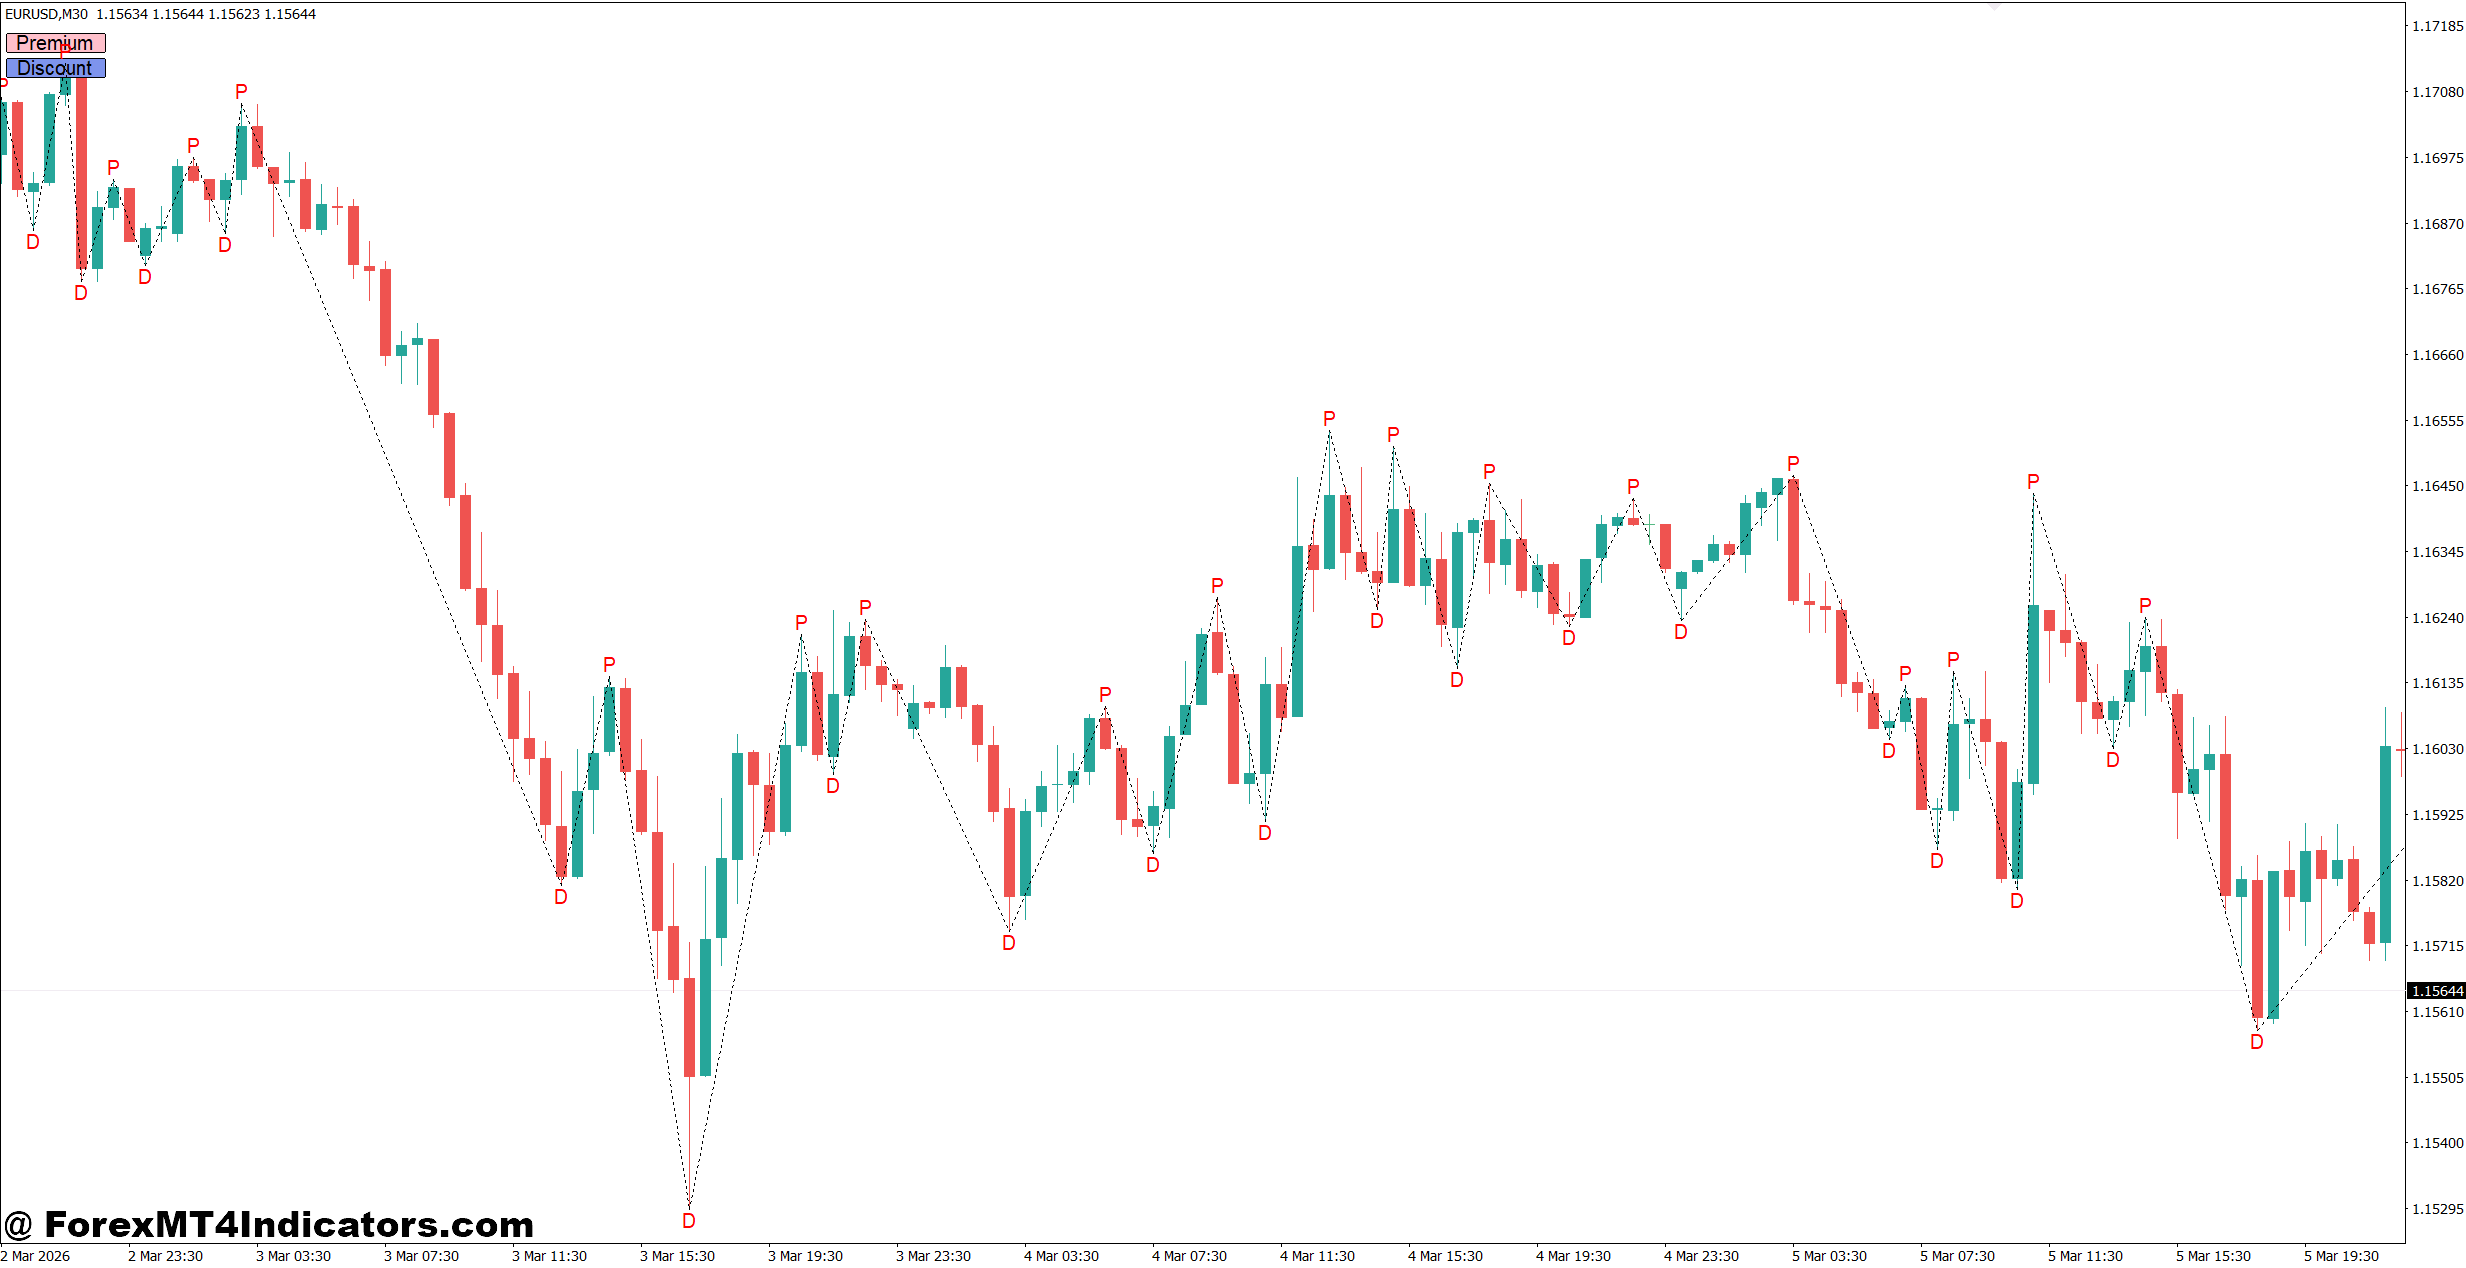
The indicator first identifies a significant price swing between a recent high and low. It then calculates the midpoint of that range and separates the chart into premium and discount areas.
For example, if EUR/USD moves from 1.1200 to 1.1400, the midpoint sits near 1.1300.
- Above 1.1300 = Premium zone
- Below 1.1300 = Discount zone
Some versions also display additional percentage levels such as 25%, 50%, and 75%, giving traders more reference points for retracements.
Here’s where experience matters. During strong trends, price rarely pulls back to extreme discount levels before continuing higher. A retracement into the 40% to 50% area often provides enough value for trend-following entries.
When testing this indicator during volatile NFP days, many traders notice that price frequently overshoots premium or discount areas because spreads widen and volatility increases. Waiting for the first reaction candle instead of placing instant market orders often reduces unnecessary losses.
The indicator works best when traders already understand market structure. If higher highs and higher lows remain intact, discount zones become more attractive for buying. If lower highs continue forming, premium zones become logical areas to look for selling opportunities.
Using the Indicator in Real Trading
The Premium and Discount Indicator MT4 becomes much more useful when combined with confirmation rather than traded alone.
Buying Example
Suppose GBP/USD is trending upward on the 4-hour chart.
Price rallies from 1.2850 to 1.3050 before pulling back. The indicator marks the discount area below the midpoint around 1.2950.
Instead of buying immediately, the trader waits for:
- A bullish engulfing candle
- Support from the previous breakout level
- RSI moving back above 50
The trade enters around 1.2945 with a 35-pip stop loss below the recent swing low. Price later reaches 1.3085, producing roughly 140 pips. That creates a risk-to-reward ratio close to 1:4.
Selling Example
USD/JPY forms lower highs on the 1-hour chart after breaking key support.
Price retraces into the premium zone around 148.80. A bearish pin bar appears near resistance while MACD momentum weakens.
The trader enters short with a 30-pip stop loss above the swing high. Price falls to 148.00 over the next trading session, delivering nearly 80 pips.
These examples show that location alone isn’t enough. Confirmation greatly improves trade quality.
Best Settings and Customization
Most versions of the indicator require very little adjustment, but traders can improve results by matching settings to their trading style.
Scalping (M5-M15)
- Use recent intraday swing highs and lows.
- Confirm entries with volume or momentum indicators.
- Target 10-25 pips depending on market volatility.
Day Trading (M30-H1)
- Focus on London and New York sessions.
- Combine premium and discount zones with support and resistance.
- Look for minimum 1:2 risk-to-reward setups.
Swing Trading (H4-Daily)
- Use larger market swings for more reliable zones.
- Confirm trend direction with the 200 EMA.
- Hold positions for several days when market structure remains intact.
EUR/USD, GBP/USD, USD/JPY, AUD/USD, and XAU/USD (Gold) generally provide cleaner reactions because they often respect technical levels during active trading sessions.
One practical tip many experienced traders follow is to redraw the swing range after a clear break of market structure. Keeping outdated swing levels on the chart can produce misleading premium and discount areas.
Strengths, Weaknesses, and Comparison with Similar Indicators
The biggest advantage of the Premium and Discount Indicator MT4 is its simplicity. It encourages traders to think about value instead of reacting emotionally to fast-moving candles.
It also works well alongside price action trading, Fibonacci retracement tools, Smart Money Concepts, and support and resistance analysis. Since many institutional trading models look for favorable pricing during pullbacks, the indicator naturally fits those strategies.
Still, it has limitations.
Sideways markets often create frequent fake-outs because premium and discount zones shift as new swings develop. During ranging conditions, traders may receive conflicting signals without clear trend direction.
The indicator also doesn’t provide exit targets or stop-loss placement. Traders must rely on market structure and proper risk management.
Compared with the Fibonacci Retracement tool, both identify value areas inside a swing. Fibonacci offers multiple retracement levels such as 38.2%, 50%, and 61.8%, while the Premium and Discount Indicator MT4 focuses on separating expensive and cheap pricing in a cleaner visual format.
Compared with moving averages, the premium and discount approach reacts directly to current price swings rather than averaging historical prices. That gives traders a different perspective when planning pullback entries.
Trading forex carries substantial risk. No indicator guarantees profits. Every setup should be confirmed with sound risk management, realistic position sizing, and an overall trading plan.
How to Trade with Premium and Discount Indicator MT4
Buy Entry
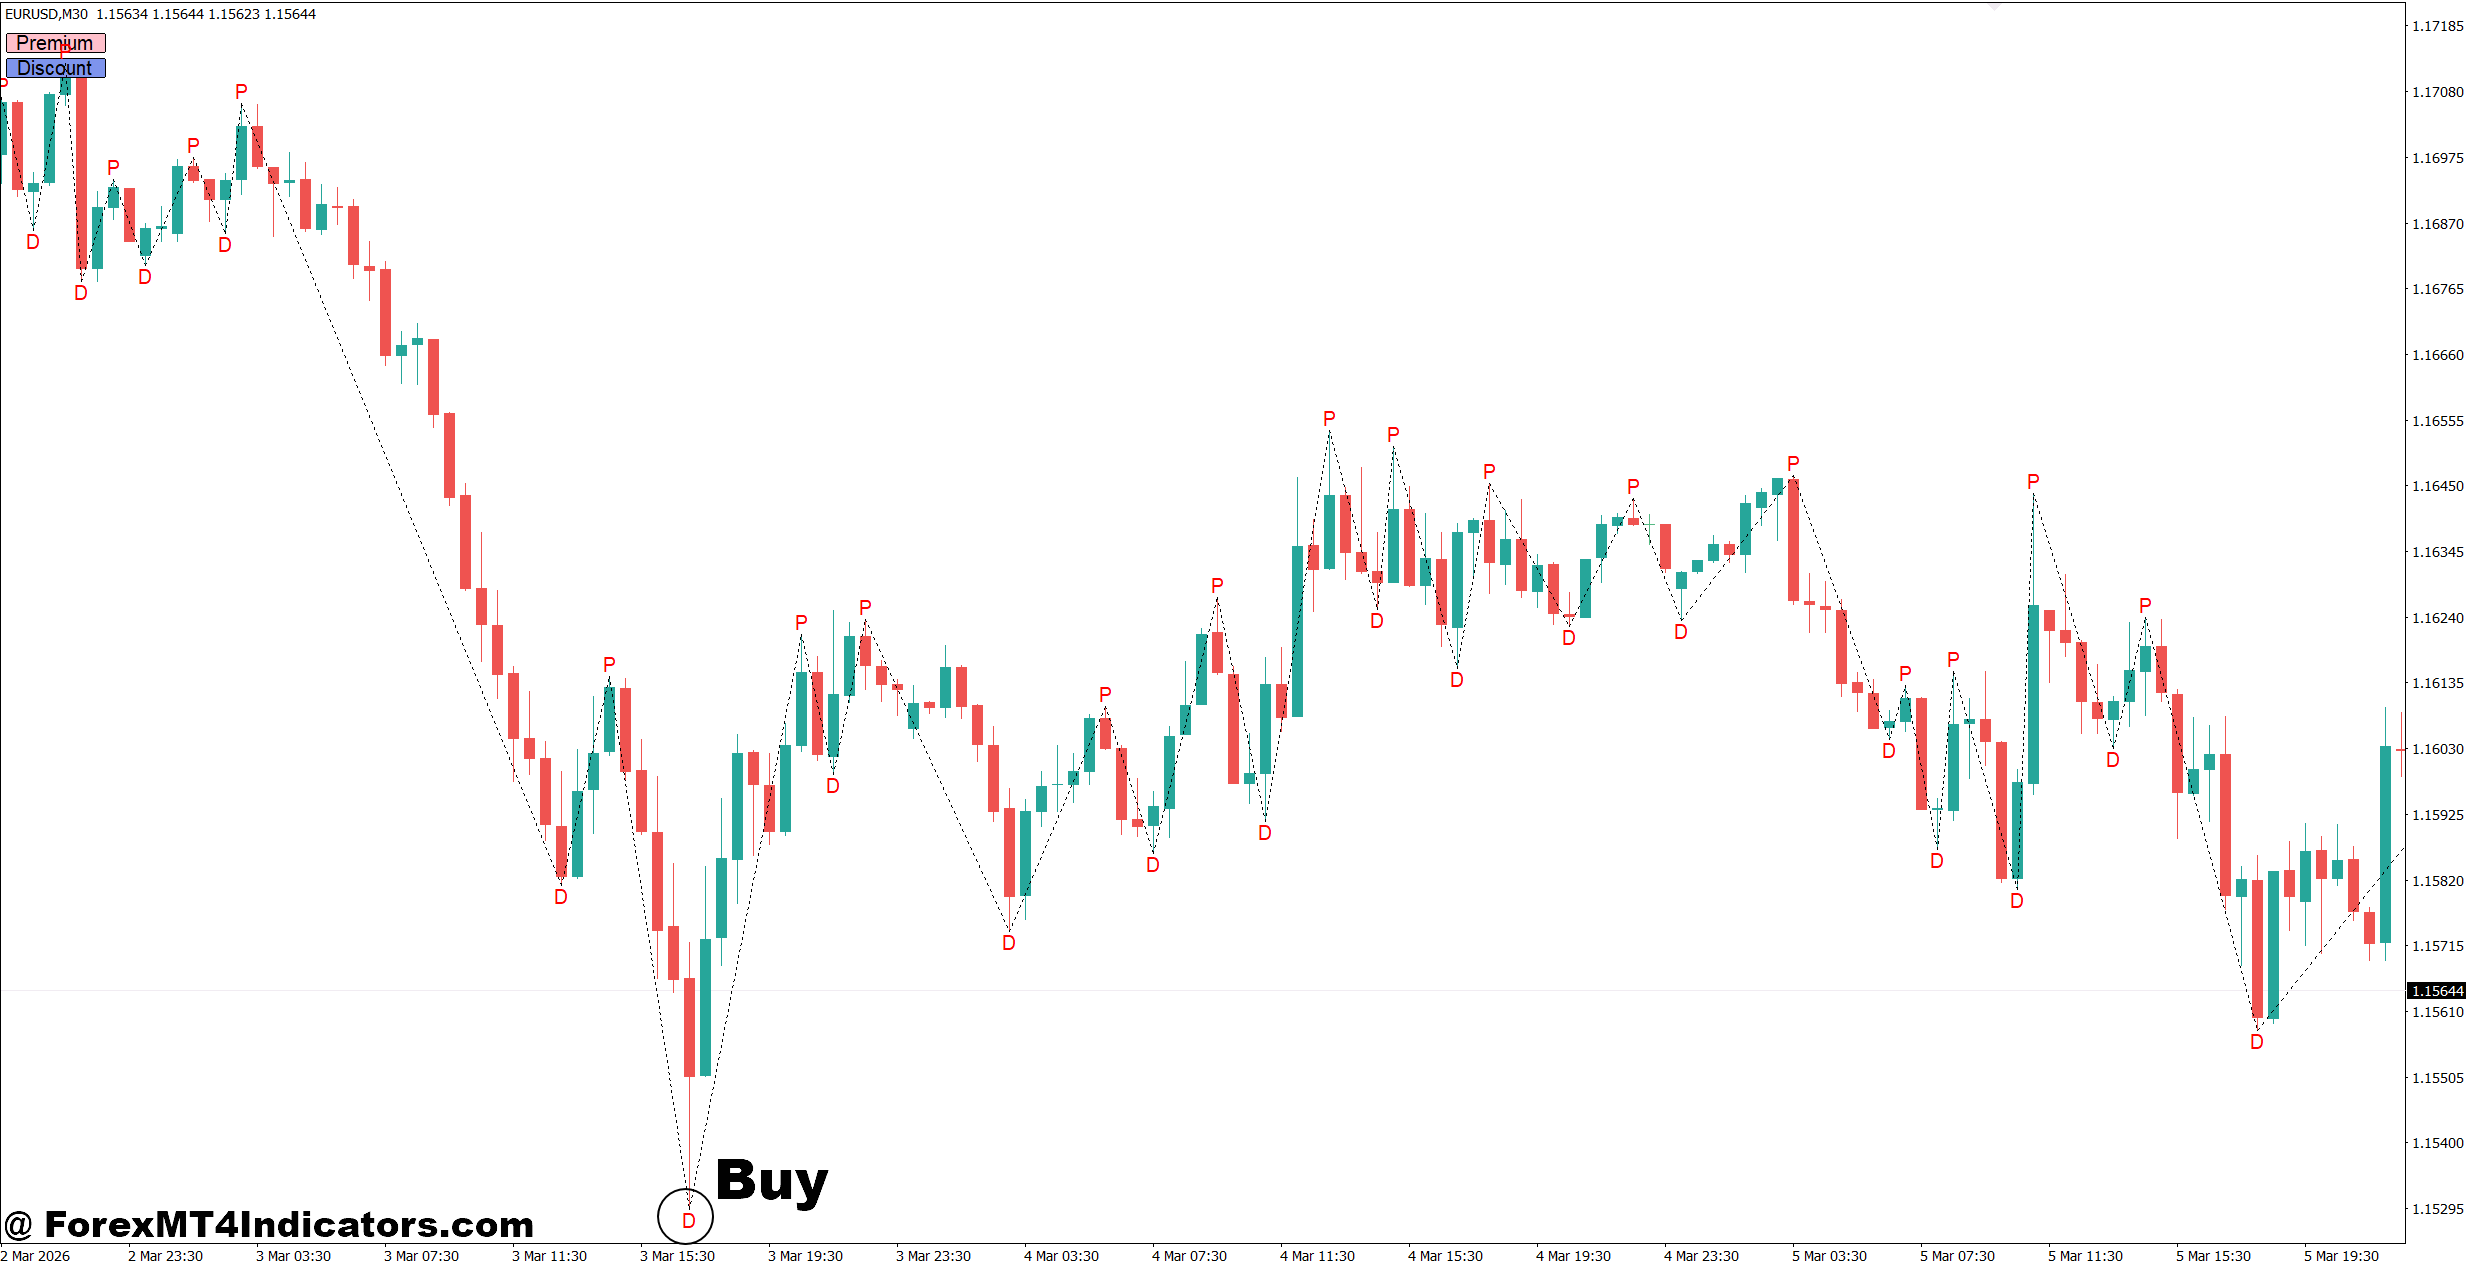
- Buy from the Discount Zone – Enter when price reaches the discount area and forms a bullish candle on the 1-hour EUR/USD chart.
- Confirm with Market Structure – Buy only after a higher low forms; place a 20-30 pip stop loss below the swing low.
- Wait for Bullish Confirmation – Use a bullish engulfing or pin bar before entering on the 4-hour GBP/USD chart.
- Trade with the Trend – Take buy setups only if the daily trend remains bullish for higher-probability trades.
- Use 1:2 Risk-to-Reward – Risk 25 pips to target at least 50 pips on trending pairs.
- Avoid Buying in Premium – Skip long trades if price is already above the equilibrium level without a pullback.
- Check Session Timing – Prefer entries during the London or New York session when volatility is stronger.
- Protect Profits Early – Move the stop loss to breakeven after price gains 25-30 pips in your favor.
Sell Entry
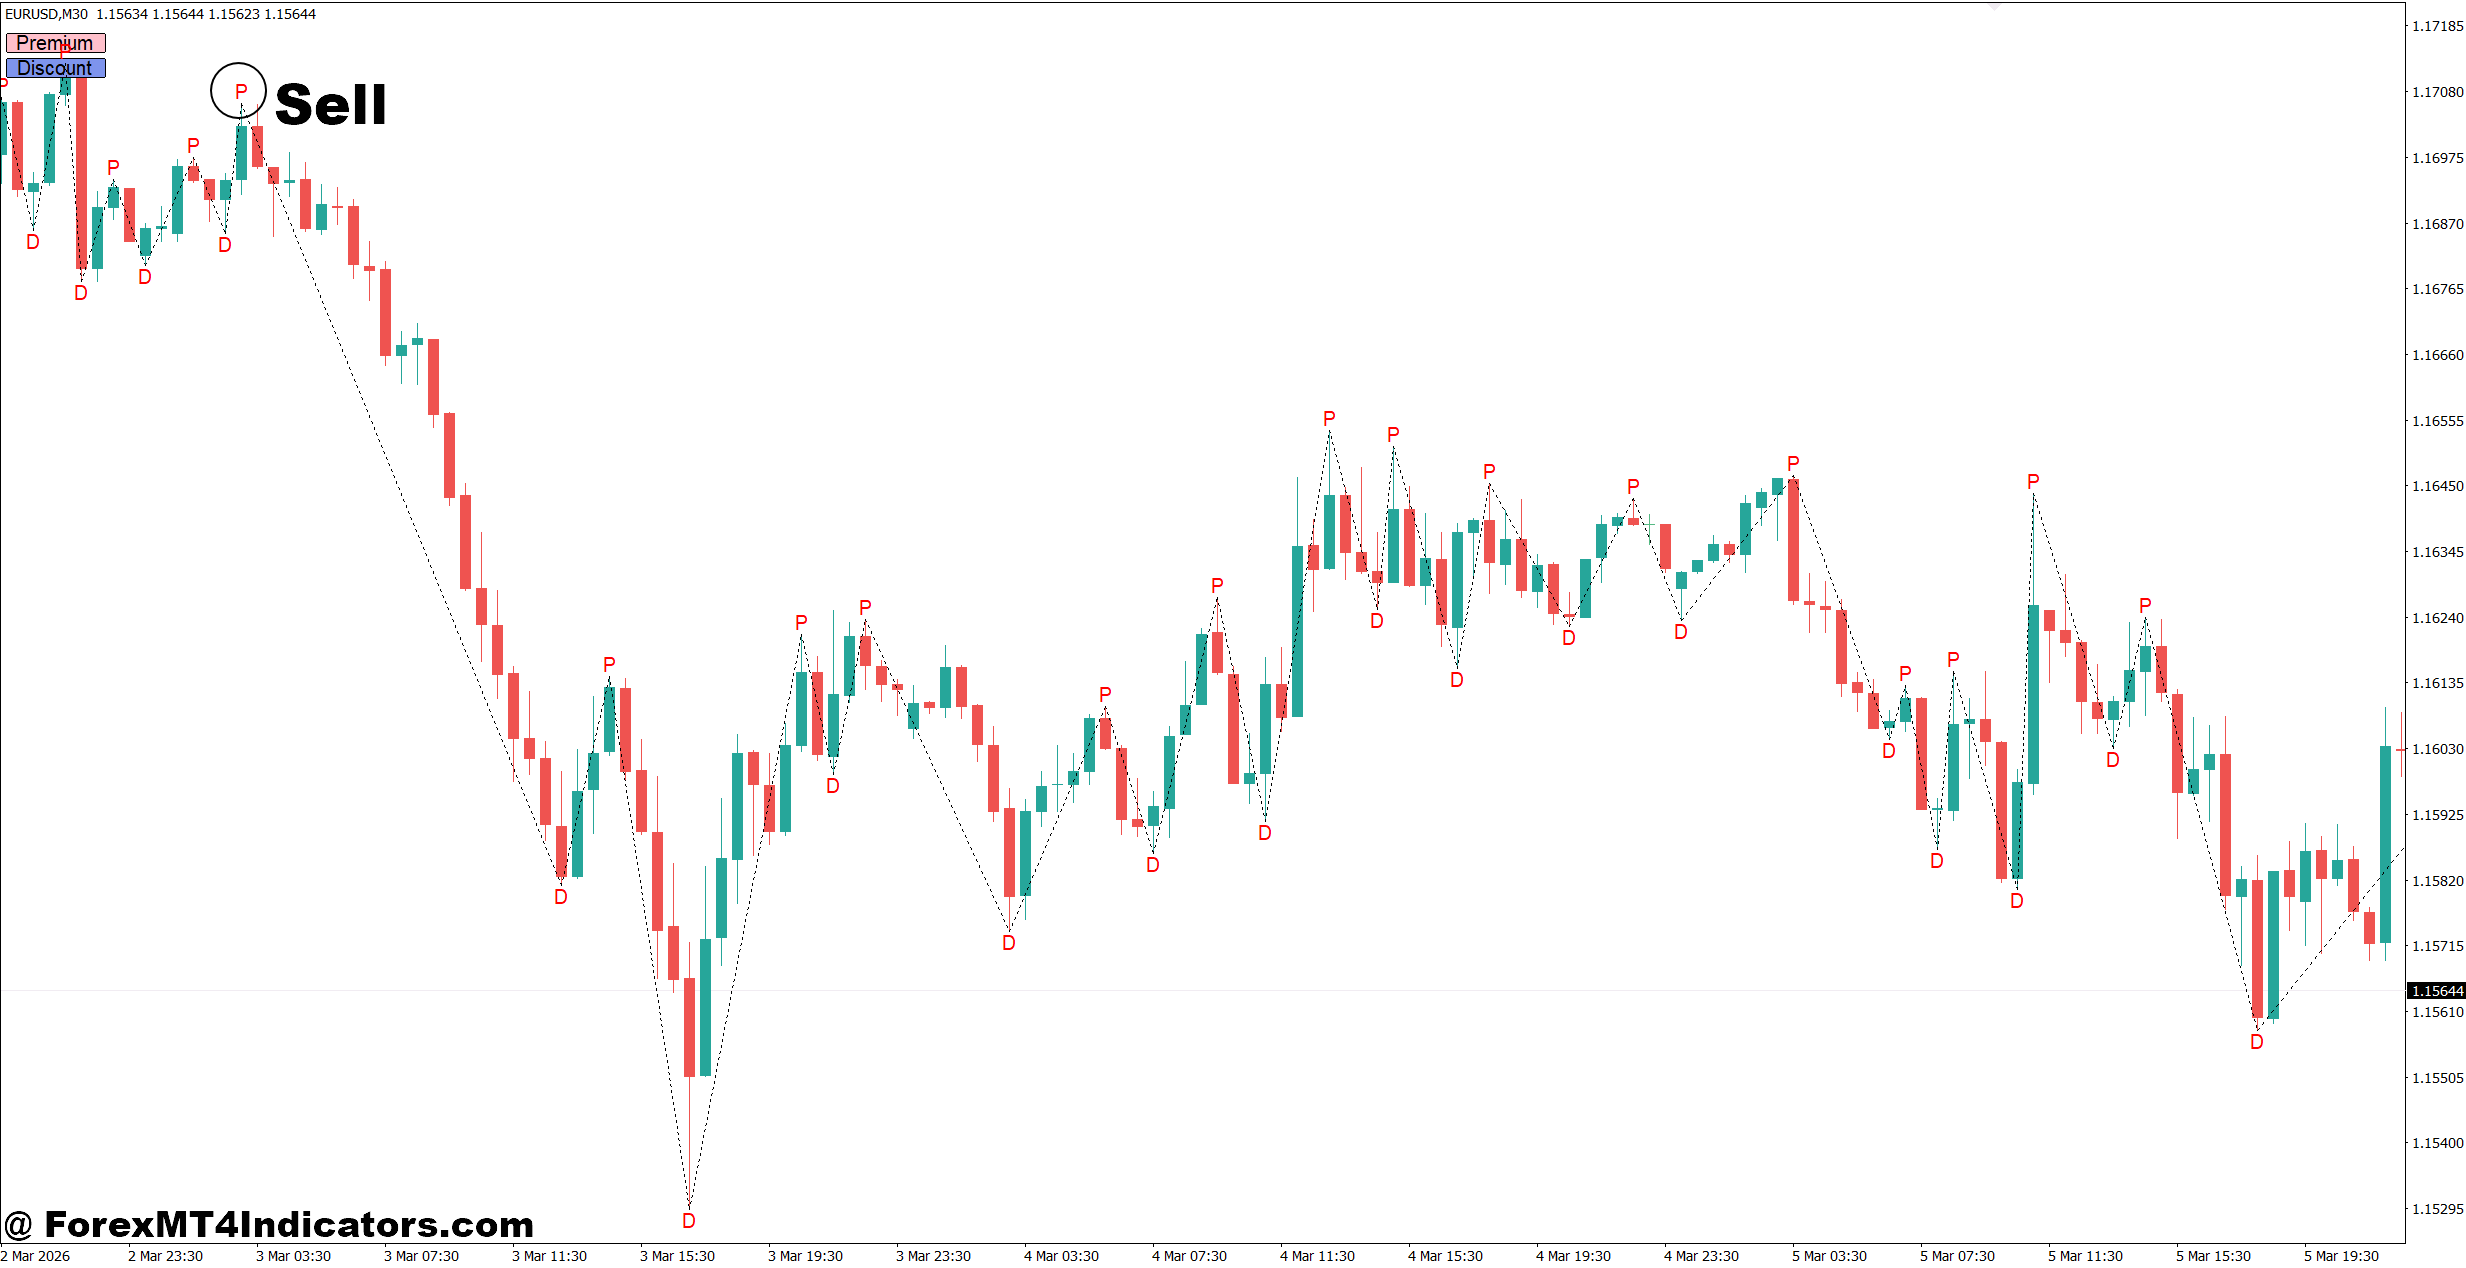
- Sell from the Premium Zone – Enter when price reaches the premium area and prints a bearish rejection candle on the 1-hour EUR/USD chart.
- Confirm Lower Highs – Sell only after a lower high forms; keep a 20-30 pip stop loss above resistance.
- Wait for Bearish Confirmation – Use a bearish engulfing or shooting star on the 4-hour GBP/USD chart before selling.
- Follow the Daily Trend – Open short trades only when the daily trend remains bearish.
- Target Strong Risk-to-Reward – Aim for at least a 1:2 ratio, such as risking 30 pips to make 60 pips.
- Avoid Selling in Discount – Don’t sell if price has already dropped into the discount zone without a retracement.
- Watch High-Impact News – Skip sell entries during events like NFP or FOMC due to sharp price swings.
- Lock in Gains – Move the stop loss to breakeven after the trade reaches 25-30 pips in profit.
The Premium and Discount Indicator MT4 gives traders a practical way to judge whether price is trading at attractive or expensive levels inside a market swing. It works best when combined with trend analysis, price action, and support or resistance rather than used by itself. The main strengths are its clear visual zones, improved entry timing, and better risk-to-reward planning, while its biggest weakness appears during choppy markets where price lacks direction. Traders who practice identifying market structure first and then use this indicator for confirmation often develop more disciplined entries. Like any technical analysis tool, consistent testing on a demo account and careful risk management should come before risking real capital with the Premium and Discount Indicator MT4.
Level up your trading
Learn to read the chart — not just the indicator
eBook · Instant PDF
Video Course · 12 modules
Recommended MT4/MT5 Brokers
- ✓ *FREE *$50 to start (withdrawable)
- ✓ Deposit bonus up to $5,000
- ✓ Negative balance protection
Trading forex and CFDs carries a significant risk of loss and is not suitable for everyone. Broker links are affiliate links — we may earn a commission at no cost to you.
Free MT4 Indicator Download

Enter Your Email Address below, download link will be sent to you.