

The STI Obos Indicator MT4 helps identify these overbought and oversold conditions before traders make emotional decisions. When markets become overextended, traders often chase price instead of waiting for better opportunities. That can lead to unnecessary losses, poor entries, and frustration after several fake-outs. The STI Obos Indicator MT4 gives traders another layer of confirmation by highlighting areas where momentum may be losing strength. It doesn’t predict every reversal, but it helps traders judge whether price has moved too far from its recent balance. Here’s how this indicator works, where it performs best, and how traders can include it in a practical trading plan.
What Is the STI Obos Indicator MT4?
The STI Obos Indicator MT4 is a momentum-based oscillator designed to detect overbought and oversold market conditions. It analyzes recent price movement and plots values inside a separate indicator window, making it easier to spot areas where buying or selling pressure may be fading.
Like other momentum oscillators, the indicator focuses on market extremes instead of trend direction alone. When the reading moves into the overbought zone, buyers may be losing momentum. When it drops into the oversold area, sellers may be running out of strength.
Many traders combine this tool with trend analysis rather than using it as a standalone entry system. During strong trends, overbought readings often signal temporary pullbacks instead of major reversals. That’s why context matters.
How the STI Obos Indicator MT4 Works
The indicator measures recent price momentum over a selected lookback period. Although different versions may use slightly different formulas, the goal remains the same: identify when price has moved far enough to suggest a possible correction.
For example, a trader may use the default 14-period setting on the 1-hour chart. If EUR/USD pushes into the overbought area after gaining nearly 90 pips in one trading session, the indicator may warn that buying momentum is slowing. Price might continue higher, but traders now know to wait for confirmation instead of buying immediately.
On the other hand, GBP/USD may fall 120 pips during high volatility. If the indicator enters the oversold zone while price approaches a major daily support level, traders may begin looking for bullish candlestick patterns instead of selling into weakness.
One useful habit is waiting for the indicator to leave the extreme zone before entering a trade. This simple filter removes many weak reversal signals.
Trading Example
During a recent test on EUR/USD H1:
- Price reached a weekly resistance level after climbing approximately 85 pips.
- The STI Obos Indicator entered the overbought zone.
- A bearish engulfing candle formed shortly afterward.
- Price declined nearly 45 pips over the next several hours.
The indicator didn’t trigger the trade by itself. Price action and resistance provided the final confirmation.
Practical Trading Strategies Using the Indicator
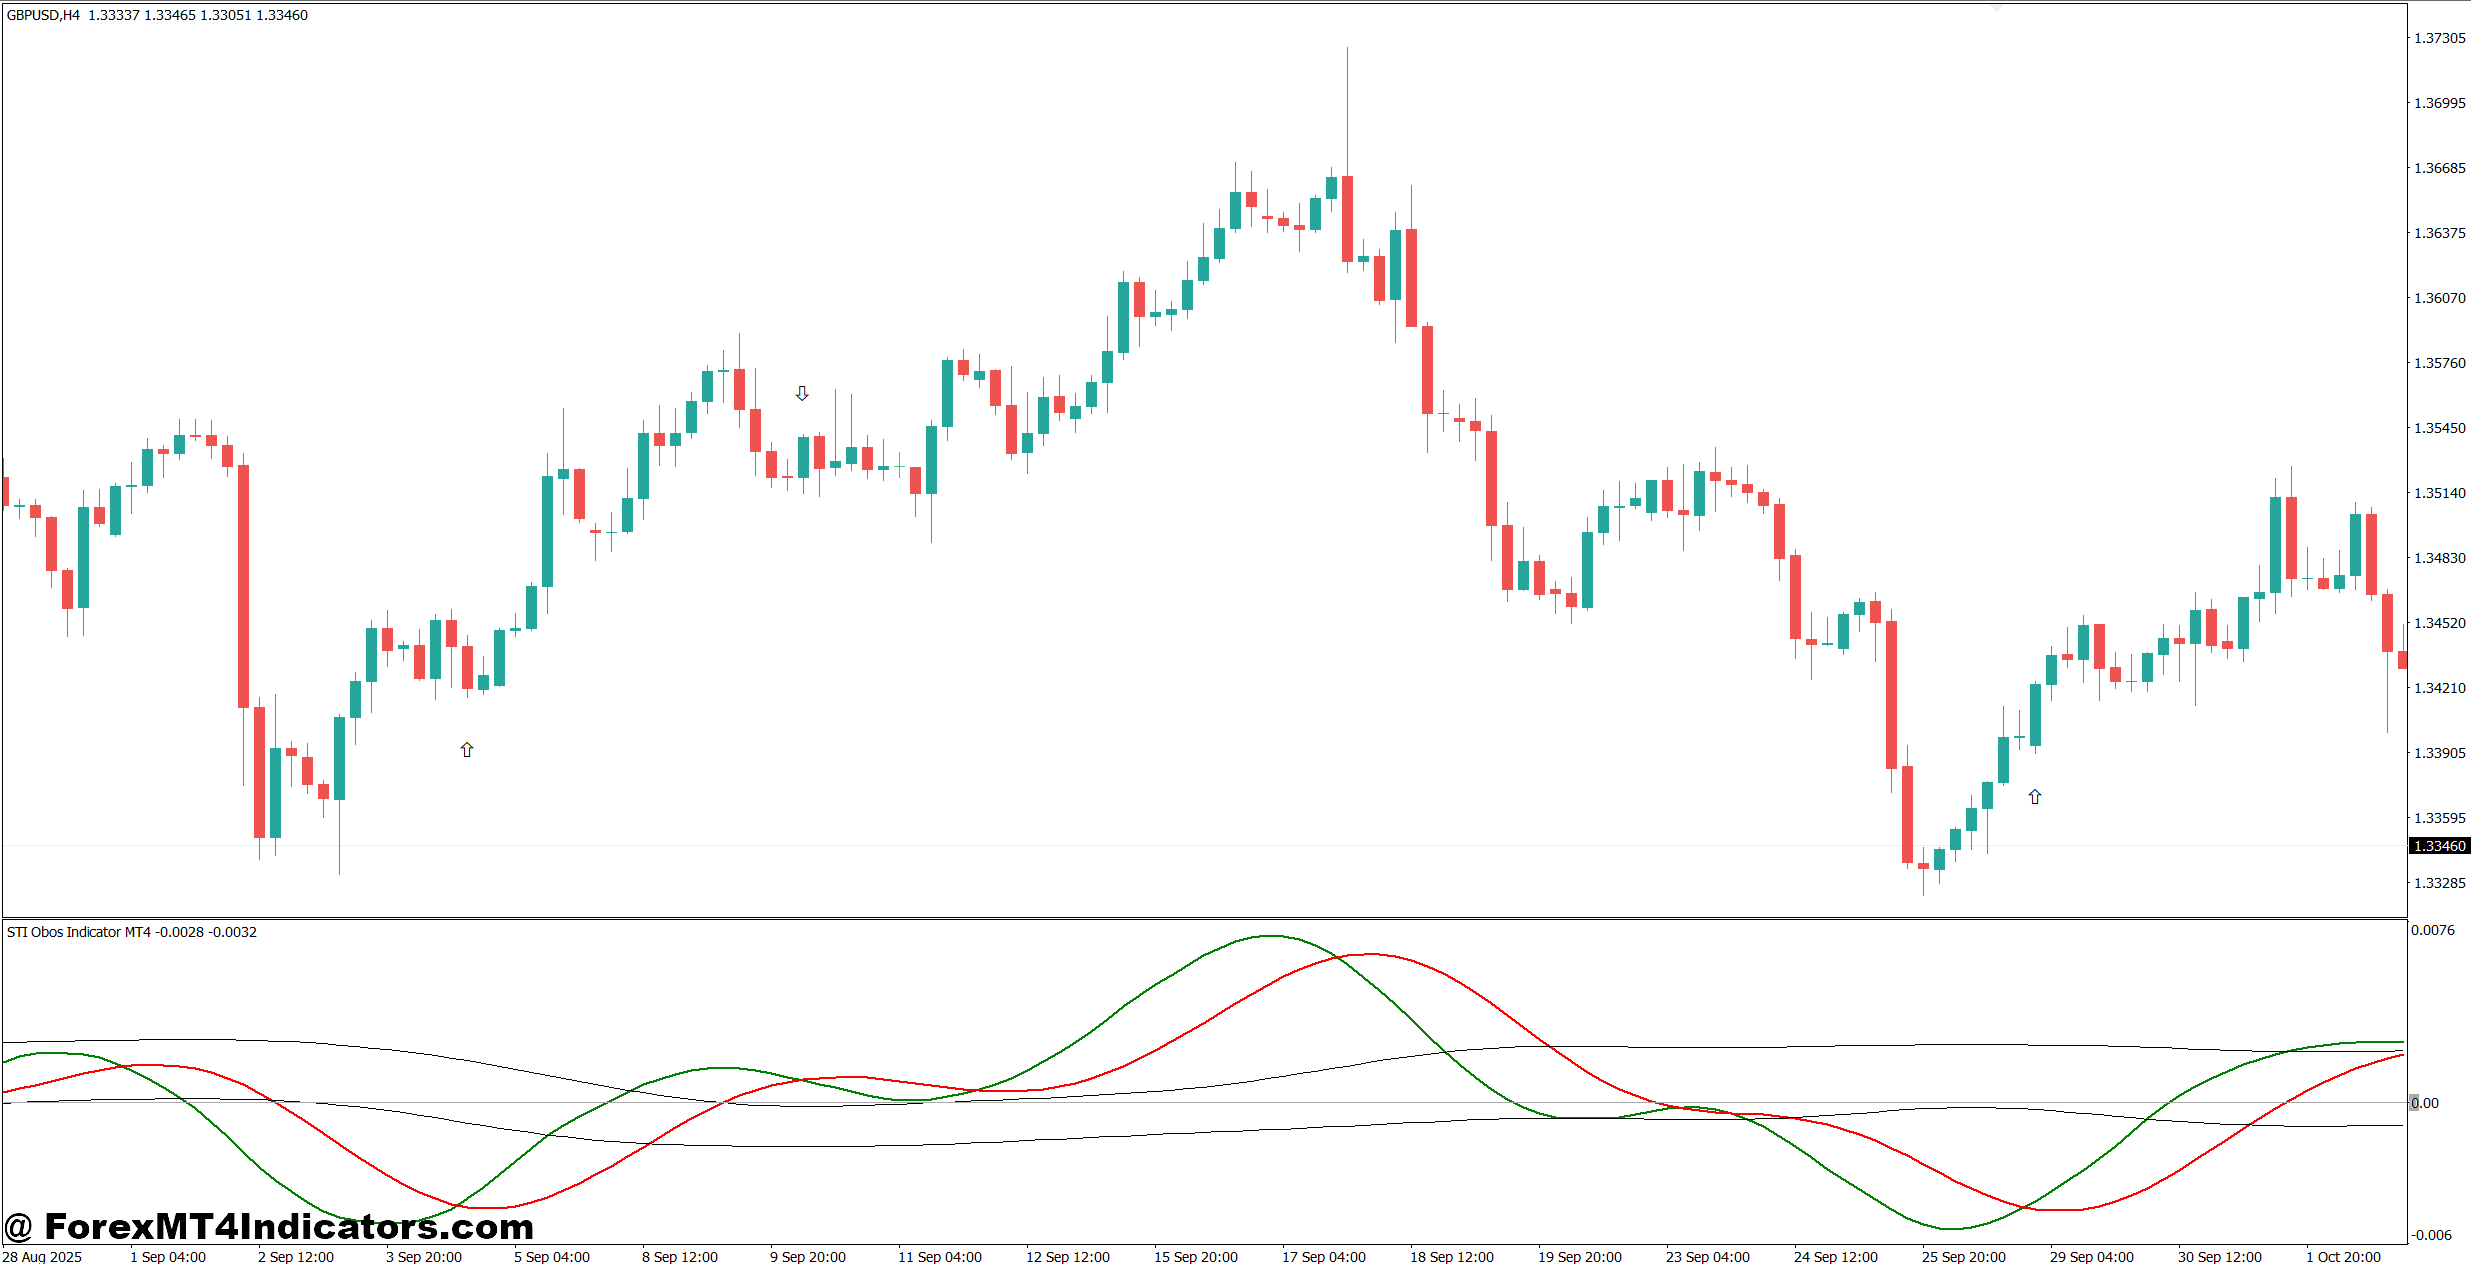
The indicator performs best when combined with market structure instead of being treated as an automatic buy or sell signal.
In an uptrend, traders can ignore early overbought signals while waiting for a pullback toward a moving average such as the 20 EMA or 50 EMA. If the indicator leaves the overbought zone and price forms a bullish rejection candle near support, the probability of continuation often improves.
During ranging markets, the indicator becomes even more useful. Suppose USD/JPY trades between support and resistance for several days on the H4 timeframe. An oversold reading near range support may provide a stronger buying opportunity than the same signal appearing in the middle of the range.
When testing this on volatile NFP days, many traders notice that oscillator signals appear much earlier than actual reversals. Waiting 15 to 30 minutes after the news release often produces cleaner setups because spreads return to normal and momentum becomes more stable.
Risk management remains essential. Trading forex carries substantial risk. No indicator guarantees profits. Many traders limit risk to 1% or 2% of account equity per trade while targeting at least a 1:2 risk-to-reward ratio.
Best Settings and Customization
The default settings work well for many traders, but small adjustments can improve performance depending on trading style.
For scalping on the M5 or M15 chart, traders often reduce the calculation period to make the indicator respond faster. Faster settings generate more signals but also increase market noise.
Swing traders using the H4 or Daily chart usually increase the calculation period to smooth out smaller price fluctuations. This produces fewer signals but improves reliability during long-term trends.
Suggested starting points include:
- M5-M15: 8 to 10 periods
- H1: 14 periods
- H4-Daily: 18 to 21 periods
No setting fits every currency pair. Gold (XAU/USD), for example, tends to produce stronger momentum swings than EUR/USD, so traders should always test settings before applying them on a live account.
Advantages, Limitations, and Comparison
One strength of the STI Obos Indicator MT4 is its simplicity. Traders can quickly identify potential exhaustion without filling the chart with multiple indicators. It also works across most major currency pairs, including EUR/USD, GBP/USD, AUD/USD, and USD/CAD.
Another benefit is that it pairs well with support and resistance analysis. Instead of guessing where reversals might happen, traders receive an objective momentum reading that supports their chart analysis.
But the indicator has limitations.
Strong trends can keep the indicator in overbought or oversold territory for long periods. Traders who immediately trade against the trend often experience repeated stop-losses during these conditions.
Compared with the Relative Strength Index (RSI), the STI Obos Indicator may react differently depending on its internal calculation. RSI uses a fixed momentum formula based on average gains and losses, while STI Obos focuses on its own momentum algorithm. Some traders find STI Obos slightly more responsive during short-term reversals.
Compared with the Stochastic Oscillator, STI Obos generally produces cleaner signals during steady trends, while Stochastic often reacts faster during sideways markets. Neither indicator is superior in every situation, which is why experienced traders usually combine them with price action instead of relying on one tool alone.
Successful traders rarely ask, “What indicator is best?” They ask, “Does this signal match the market structure?”
The answer often determines whether a trade succeeds or fails.
How to Trade with STI Obos Indicator MT4
Buy Entry
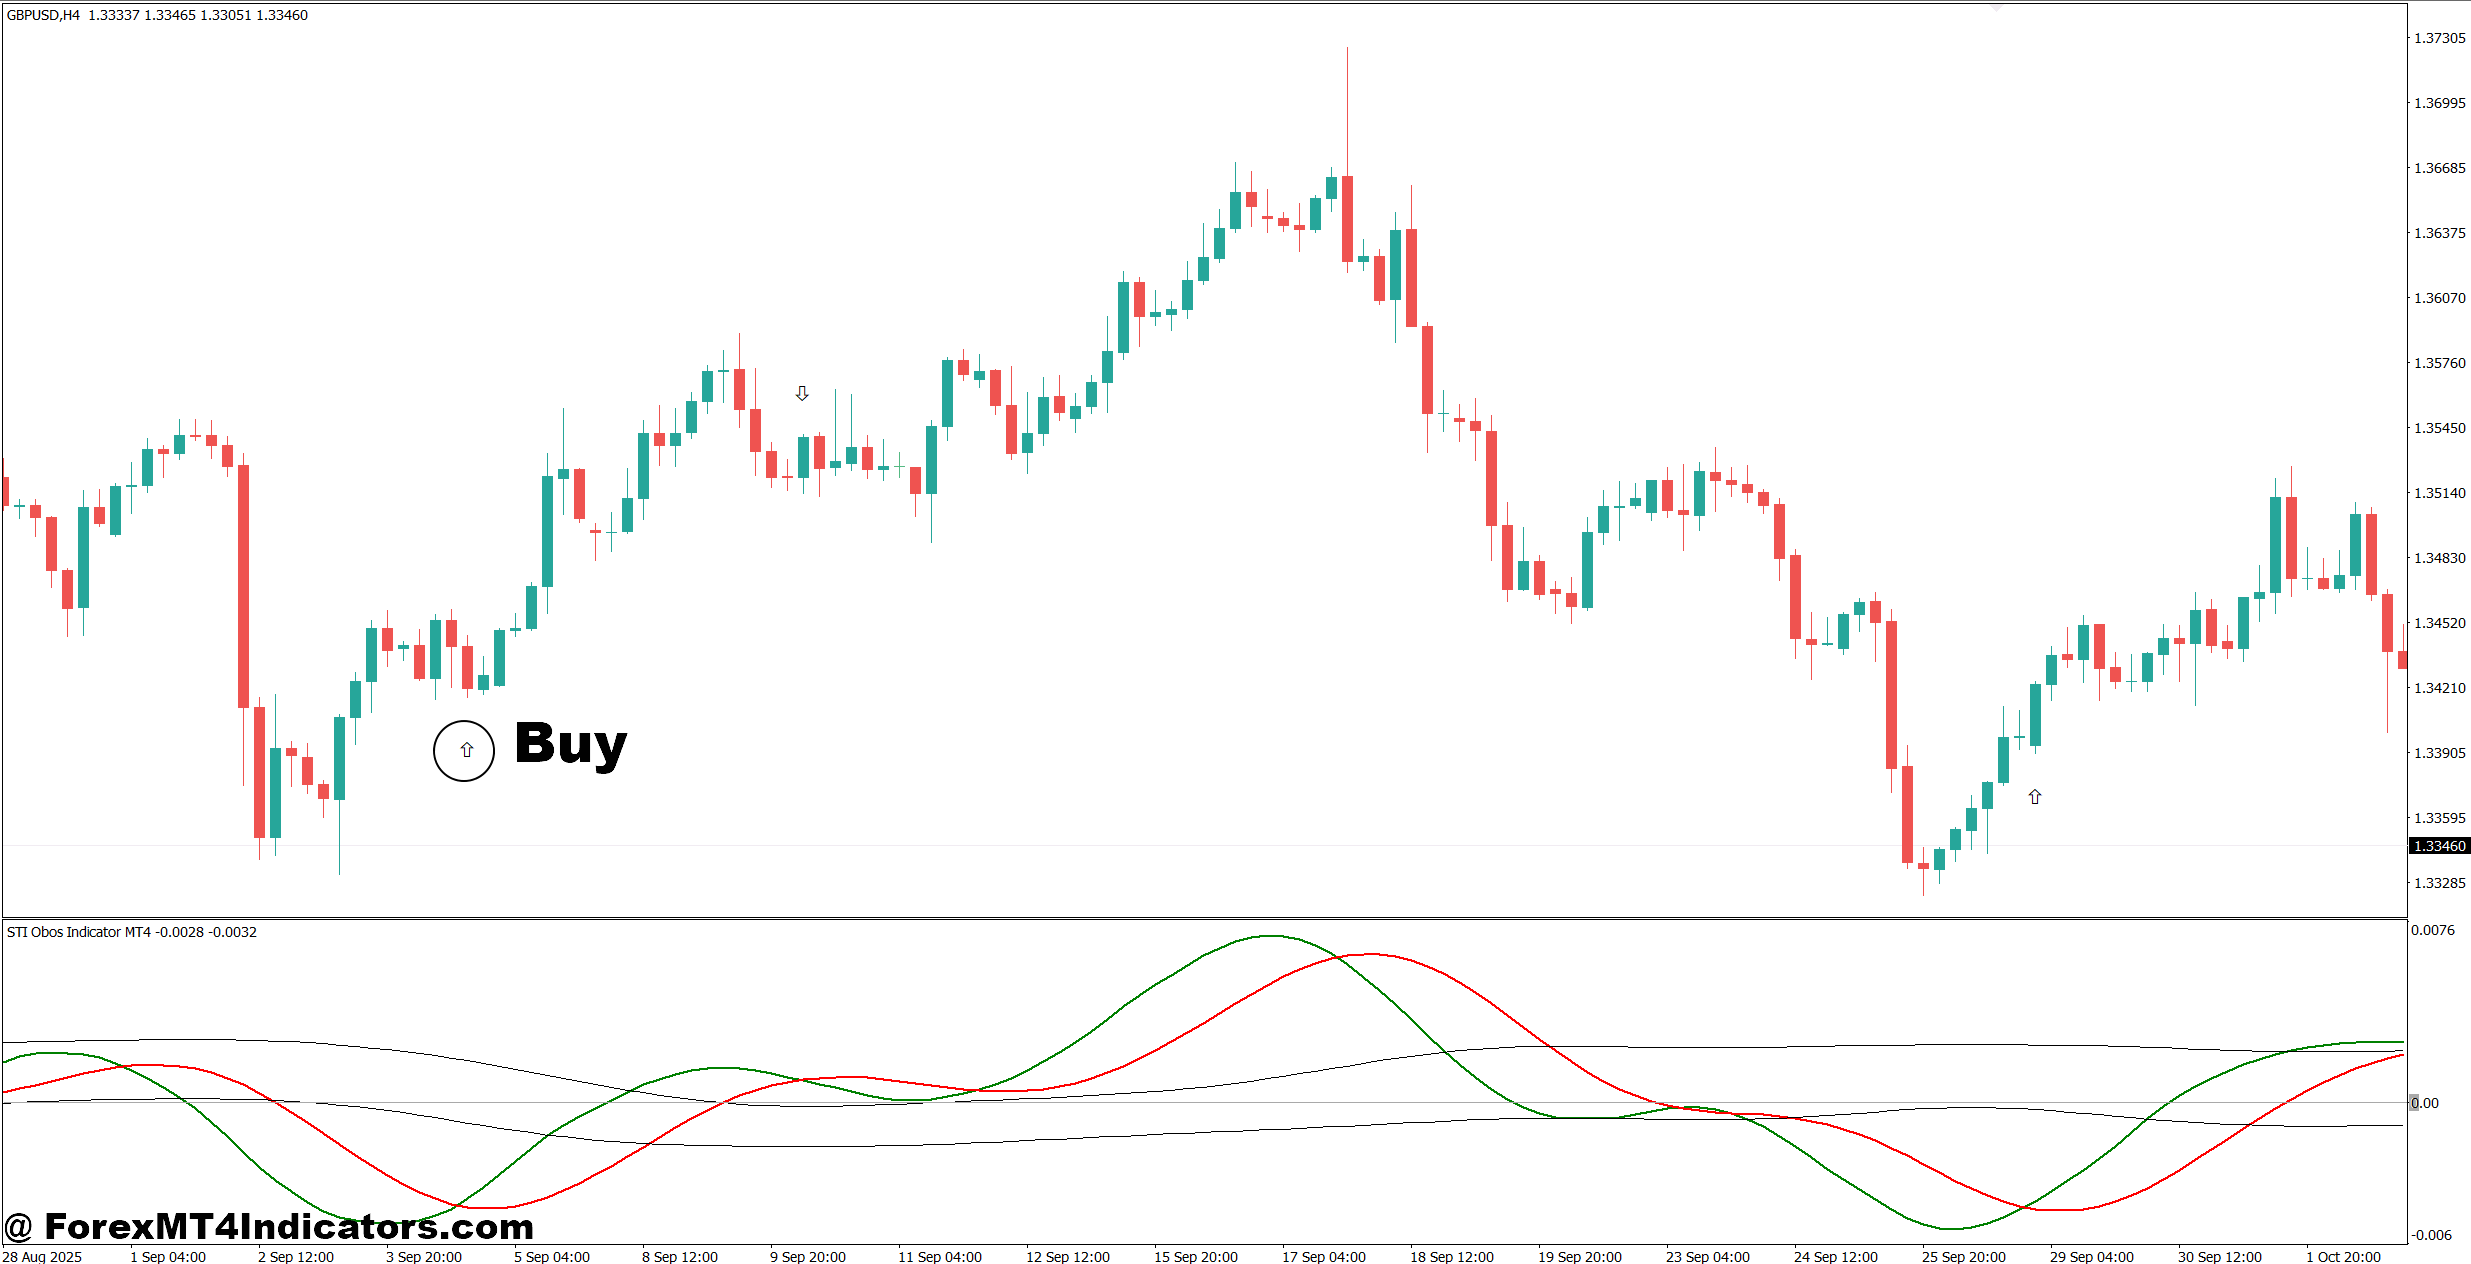
- Buy from oversold zone – Enter when the indicator exits oversold on the EUR/USD 1-hour chart with a bullish candle. Target 30-60 pips.
- Confirm with support – Buy only if price is at a strong support level or demand zone. Place a 20-30 pip stop-loss.
- Trade with the trend – Take buy signals only when the 4-hour trend remains bullish for higher-probability trades.
- Wait for indicator crossover – Enter after the indicator crosses above its trigger line to avoid early entries.
- Use moving average confirmation – Buy when price stays above the 50 EMA and the indicator leaves oversold.
- Risk only 1-2% – Limit risk per trade and aim for at least a 1:2 risk-to-reward ratio.
- Avoid high-impact news – Skip buy signals 15-30 minutes before major events like NFP or CPI releases.
- Ignore weak signals – Don’t buy if the indicator is oversold but price is making strong bearish candles.
Sell Entry
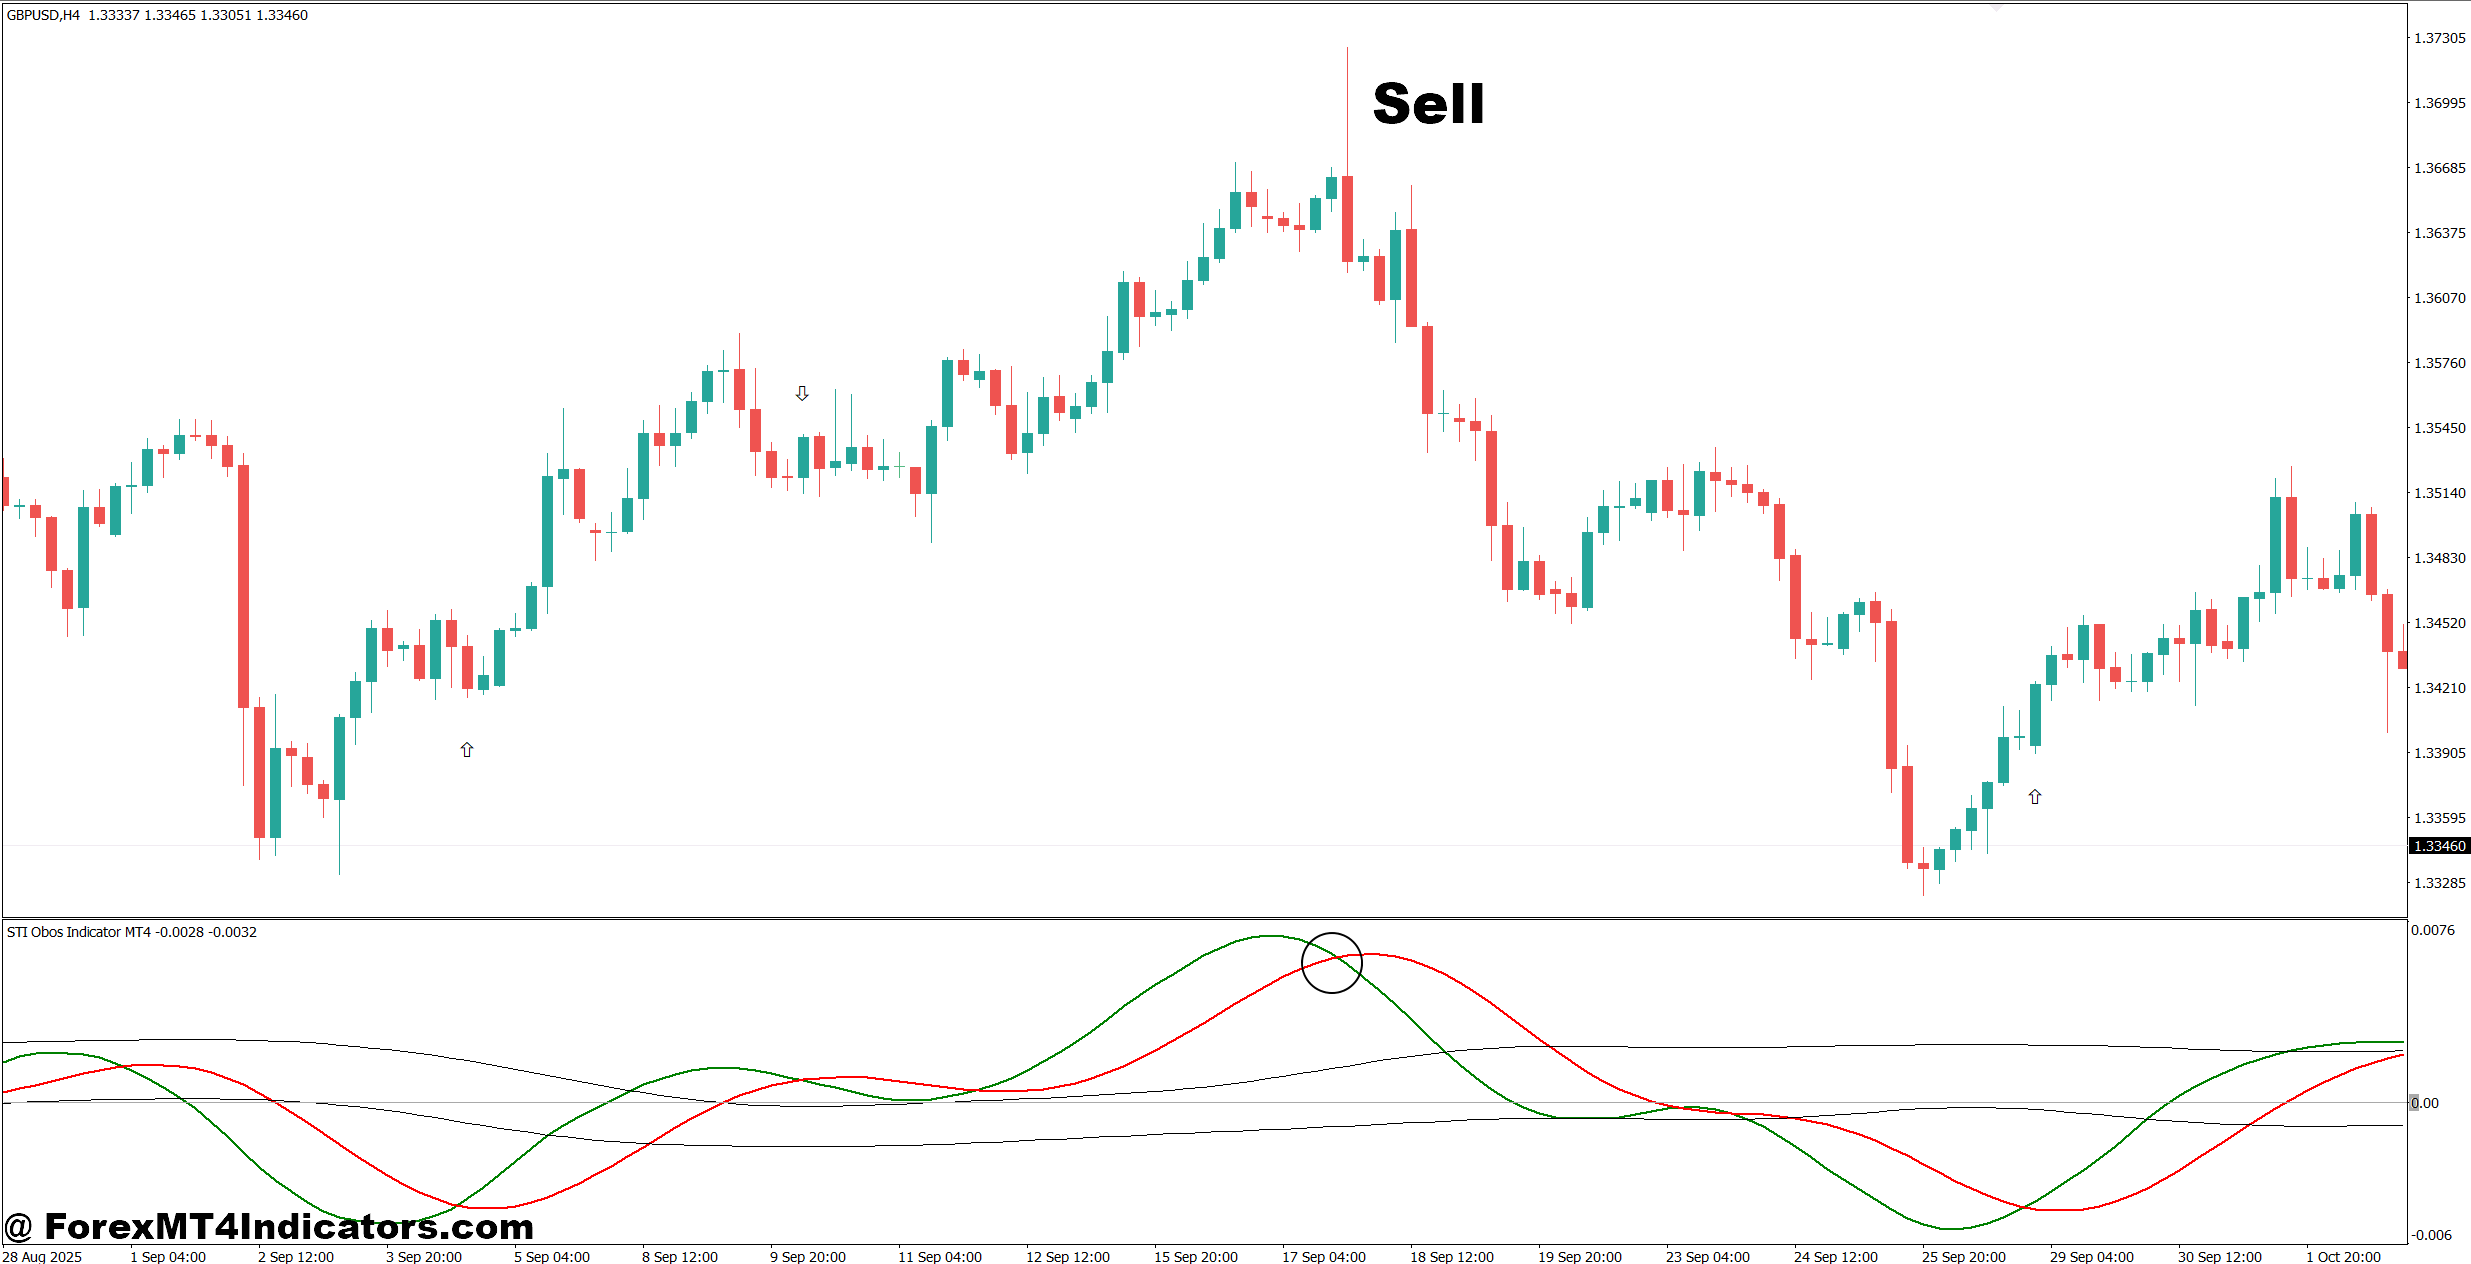
- Sell from overbought zone – Enter when the indicator exits overbought on the GBP/USD 1-hour chart with a bearish candle. Target 30-60 pips.
- Confirm with resistance – Sell only near a proven resistance level. Keep the stop-loss within 20-30 pips.
- Follow the higher trend – Take sell signals only when the 4-hour trend is bearish.
- Wait for bearish crossover – Enter after the indicator crosses below its trigger line for better confirmation.
- Use moving average filter – Sell when price trades below the 50 EMA and the indicator leaves overbought.
- Protect your capital – Risk no more than 2% of account balance on a single trade.
- Avoid strong uptrends – Don’t sell against a powerful daily bullish trend, even if the indicator is overbought.
- Skip low-volume sessions – Ignore sell signals during quiet market hours when false moves are common.
The STI Obos Indicator MT4 can become a valuable part of a trading strategy when used with discipline and proper chart analysis. Traders gain three clear benefits: better awareness of overbought and oversold conditions, stronger confirmation near support and resistance, and improved timing when combined with candlestick patterns. At the same time, they should remember that extreme readings don’t always lead to reversals, especially during strong trends. Trading forex carries substantial risk. No indicator guarantees profits. Traders who test the STI Obos Indicator MT4 on a demo account, refine its settings for their preferred timeframe, and combine it with sound risk management often develop more consistent trading decisions over time.
Level up your trading
Learn to read the chart — not just the indicator
eBook · Instant PDF
Video Course · 12 modules
Recommended MT4/MT5 Brokers
- ✓ *FREE *$50 to start (withdrawable)
- ✓ Deposit bonus up to $5,000
- ✓ Negative balance protection
Trading forex and CFDs carries a significant risk of loss and is not suitable for everyone. Broker links are affiliate links — we may earn a commission at no cost to you.
Free MT4 Indicator Download

Enter Your Email Address below, download link will be sent to you.