
Last updated: August 29, 2026 · By: Tim Morris

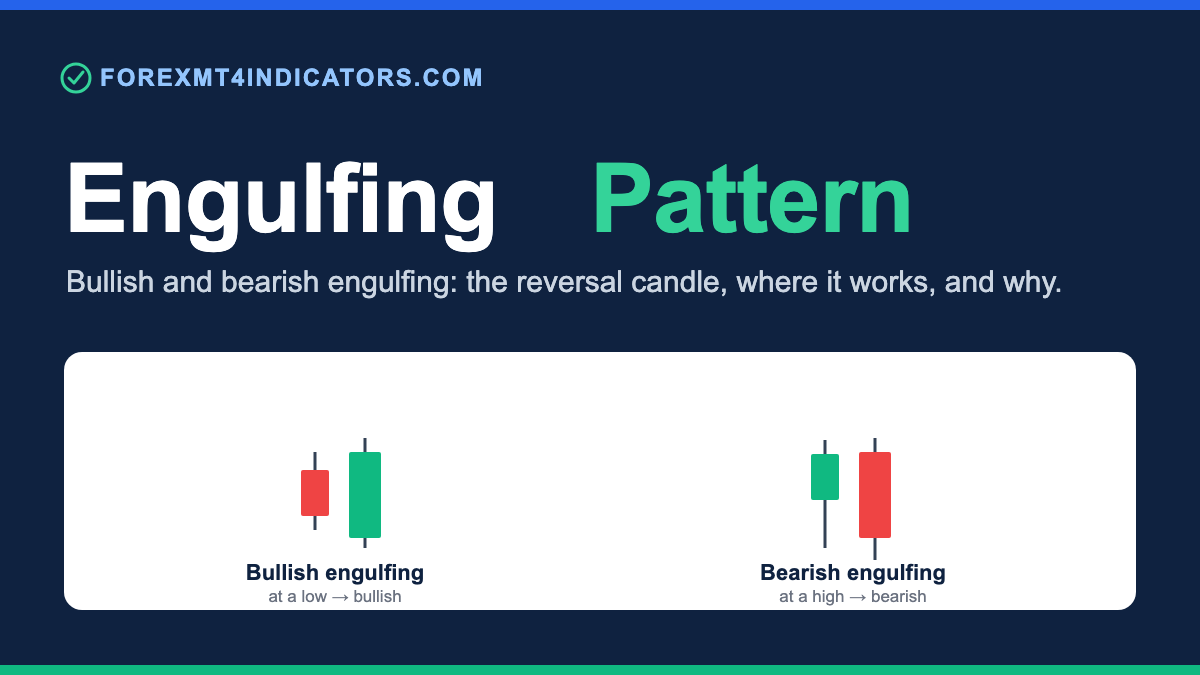
An engulfing candlestick pattern is a two-candle reversal signal where the second candle’s real body fully covers the prior candle’s body. A bullish engulfing forms when a larger up candle swallows a small down candle at a low; a bearish engulfing flips this at a high. The close-through is what matters, and it needs confirmation.
Below we break down the anatomy, the bullish and bearish versions, why location decides the outcome, and how to trade the pattern without turning a probability into a bet. Keep this page open next to your chart.
What is an engulfing candlestick pattern
An engulfing pattern is a two-candle formation that flags a possible shift in who controls price. The first candle moves with the existing trend, and the second candle reverses it, closing with a body large enough to cover the first candle’s body. That reversal of control, printed in two bars, is the whole message.
The pattern belongs to the reversal family. See our full reversal candlestick patterns list for its siblings. It is one of the more watched two-candle signals because the engulfing body is easy to see and hard to fake. Traders read it as a moment where the losing side gave up and the other side took the bar.
One caution up front: an engulfing candle is a probability, not a promise. It tells you the balance of buyers and sellers changed on that bar, not that the trend has ended. Confirmation and location decide whether the shift holds, and we cover both further down.
The anatomy of an engulfing candle
The rule that defines the pattern is body-engulf, not wick-engulf. The second candle’s real body, the distance between its open and close, must fully cover the first candle’s real body. The wicks, also called shadows, do not need to be covered, and a candle that only engulfs the prior wick does not qualify.
Colour follows directly from the direction. In a bullish engulfing the first body is red (a down candle) and the second body is green (an up candle) and larger. In a bearish engulfing the first body is green and the second is red and larger.
The close is the load-bearing part. A bullish engulfing closes above the prior candle’s open, and a bearish engulfing closes below the prior candle’s open. That close-through tells you the second side did not merely test the level. It took the whole body back before the bar shut.
Size is a quality signal, not part of the definition. A second body that dwarfs the first shows a decisive takeover, while a second body that barely clears the first is a marginal engulf worth less. The extreme case is a body with almost no wick; when the engulfing candle approaches a marubozu candlestick pattern, the takeover is as clean as candlesticks get.
Bullish engulfing vs bearish engulfing
The two versions are mirror images, separated by direction and by where they should form. A bullish engulfing is a small down candle followed by a larger up candle; a bearish engulfing is a small up candle followed by a larger down candle. Reading the open-and-close relationship is how you tell a real one from a lookalike.
In a bullish engulfing, the up candle ideally opens at or below the prior close and closes above the prior open. Sellers held control on candle one; buyers opened weak, drove price up, and shut the bar above where the sellers had started. That failed low and strong close is the reversal footprint you are looking for.
In a bearish engulfing, the down candle ideally opens at or above the prior close and closes below the prior open. Buyers held control on candle one; sellers opened strong, pushed price down, and shut the bar below where the buyers had started. The takeover runs in the opposite direction, but the logic is identical.
A short table locks the difference in place.
| Bullish engulfing | Bearish engulfing | |
|---|---|---|
| First candle | Small down (red) body | Small up (green) body |
| Second candle | Larger up (green) body | Larger down (red) body |
| Second candle closes | Above the first candle’s open | Below the first candle’s open |
| Where it should form | Downtrend low / support | Uptrend high / resistance |
| Message | Buyers seized control | Sellers seized control |
How to identify it on a chart
Start with the trend, not the candle. Scroll out and confirm price has been falling into the zone for a bullish engulfing, or rising into it for a bearish engulfing. An engulfing candle inside a flat, directionless range is a shape with nothing to reverse.
Then check the body-cover rule by eye. The second real body should visibly swallow the first real body, close-to-open. If you have to squint to decide whether it engulfs, treat it as marginal and lower its weight in your read.
Confirm the close-through and the colour flip together. A green body that closes above the prior red open, or a red body that closes below the prior green open, is the genuine article. Our complete forex candlestick patterns guide shows how this bar sits alongside hammers, stars, and dojis in one reading system.
Note volume where your feed shows it. An engulfing candle on rising volume shows real participation behind the takeover, while the same shape on thin volume is easier to fake and slower to follow through. Volume is a tie-breaker, not a requirement.
Why location is half the signal
The same engulfing shape means opposite things depending on where it prints, and means nothing at all in the wrong place. A bullish engulfing earns its name at a downtrend low, at support, or at a demand zone you marked before the candle formed. The identical two candles floating mid-range are noise.
A bearish engulfing works the mirror image: at an uptrend high, at resistance, or at a supply zone. Location is what converts a shape into a signal, because a reversal needs an existing move to reverse and a level for the turn to lean on.
Size and volume raise reliability once location is right. A large engulfing body on strong volume, sitting exactly at a tested support level, is a higher-odds read than a small engulf on quiet volume in open space. Stack the filters rather than trusting the candle alone.
How to trade an engulfing pattern
The core logic is confirmation before commitment. An engulfing candle that the next bar has not confirmed is a shape, not a trade. Confirmation means the following candle continues in the pattern’s direction (holding above the bullish engulfing’s high, or below the bearish engulfing’s low) rather than snapping straight back.
The trigger, conceptually, is the market agreeing with the takeover. Some traders enter on the confirming close, and others wait for a shallow retest of the engulfing candle’s midpoint for a better price. Both are valid; the point is that entry follows agreement, not the raw pattern candle before it has closed.
The invalidation is where the idea breaks, and it sits beyond the pattern’s extreme. For a bullish engulfing, a close back below the engulfing candle’s low says the takeover failed; for a bearish engulfing, a close back above its high says the same. That level is where you are wrong, so it anchors the stop: beyond the wick, not at the body.
Context governs all of it, so take engulfing signals that agree with the higher-timeframe trend or form at a major higher-timeframe level. For a fully specified, named entry-and-stop system built on this bar, see the engulfing pattern forex strategy guide. If you want the level-plus-pattern reads walked candle by candle, The Candlestick Playbook covers them in one focused ebook for $27.
How to set a price target
An engulfing pattern does not carry a built-in measured move the way a chart pattern like a double bottom does. Its target comes from structure, not from the candle’s own height. You project to the next place price is likely to stall.
For a bullish engulfing, the first target is the nearest overhead resistance: a prior swing high, a supply zone, or a round number above entry. For a bearish engulfing, it is the nearest support below. Mark those levels before you enter so the exit is decided in advance, not in the heat of the trade.
A structure-based target keeps risk-to-reward honest. If the nearest opposing level sits closer than the invalidation beyond your entry, the trade pays less than it risks, and skipping it is the correct call. Many traders want a first target at least twice the distance to their stop, then trail the rest.
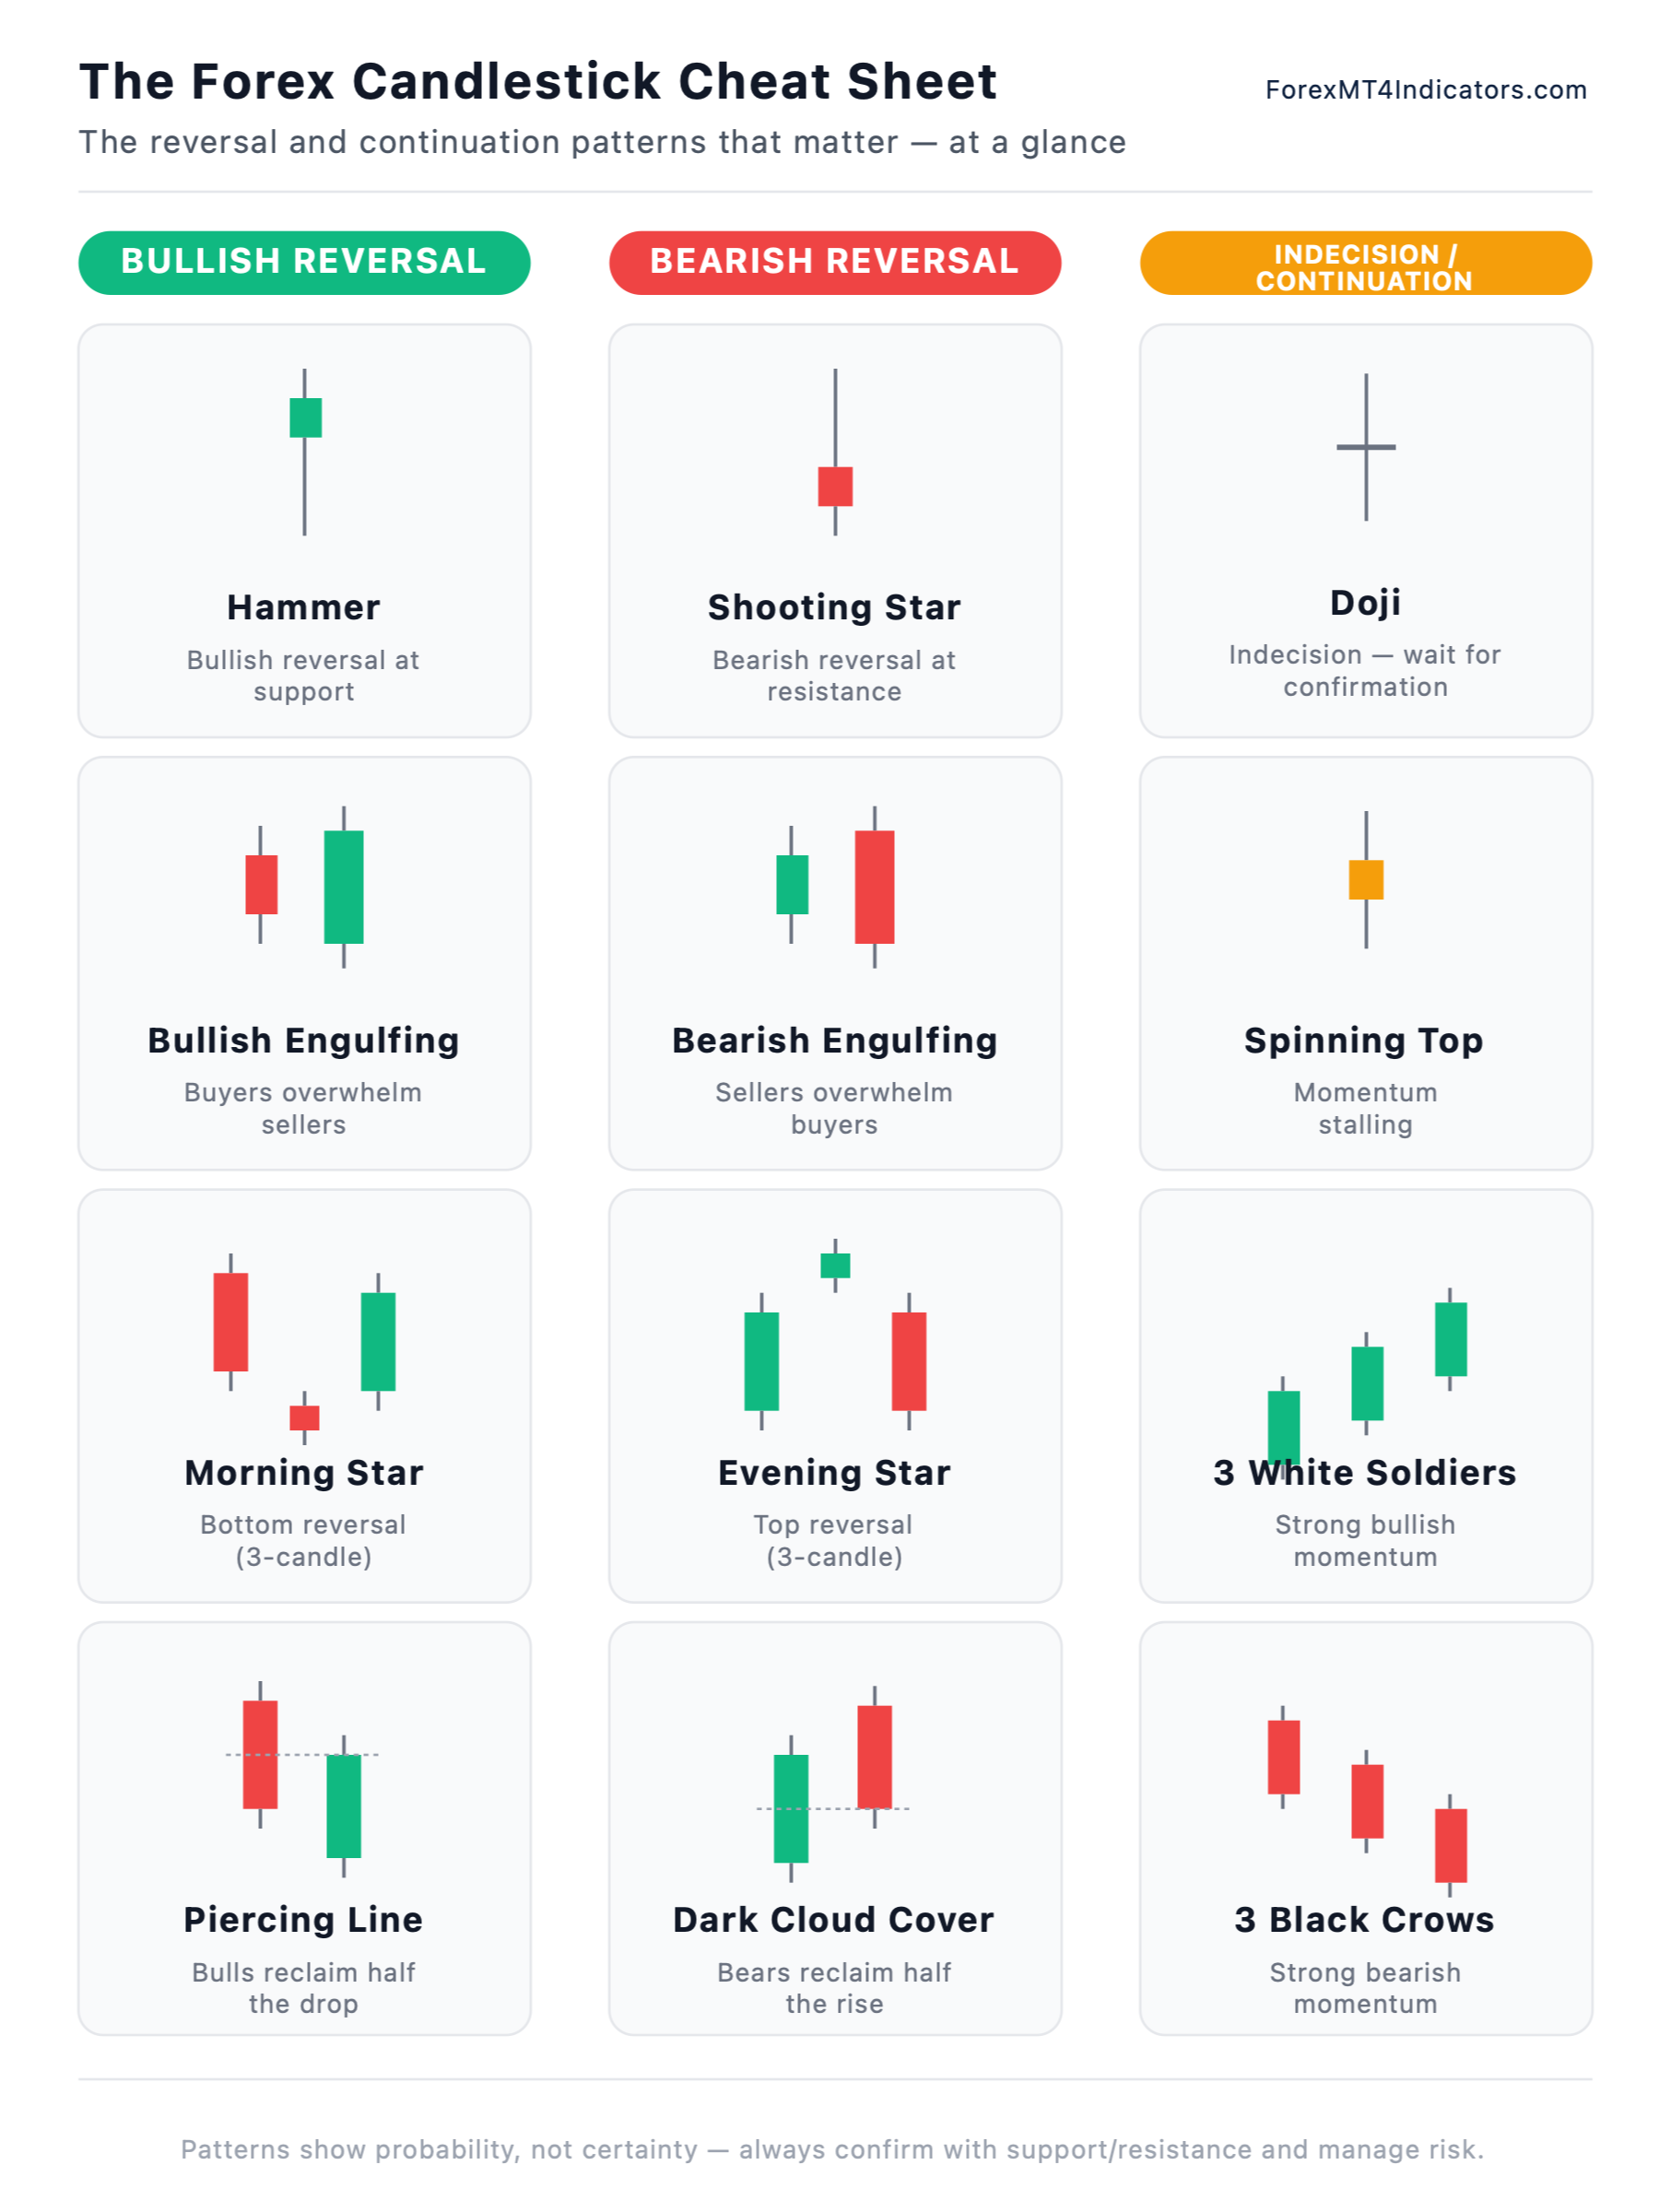
Some traders scale out to manage the uncertainty. Take part of the position at the first structural level, move the stop to breakeven, and let the remainder run toward a farther level while momentum holds. The free candlestick cheat sheet is a handy save-and-print reference for these level-plus-pattern reads.
When an engulfing pattern fails
The most common failure is no follow-through. The engulfing candle prints, the confirming bar never arrives, and price drifts back through the pattern. This is why confirmation exists: an unconfirmed engulf voids the trade before it costs you.
The second failure mode is location. An engulfing candle mid-range, with no trend to reverse and no level to lean on, has nothing behind it and fails at the rate of a coin flip. The shape was right; the place was wrong.
The third is fighting the higher timeframe. A bearish engulfing on H1 inside a strong daily uptrend is usually a pullback the larger trend runs over, not a top. News is the fourth cause: an engulfing candle minutes before CPI, NFP, or FOMC means little, because the release reprices the market regardless of the candle.
Dead liquidity produces the last batch. The quiet late-Asian session prints long wicks and hollow-looking engulfs that fill and reverse by the London open. Treat any engulfing signal in thin conditions as suspect until a live session confirms it.
Common mistakes traders make with engulfing patterns
Reading a wick-engulf as a body-engulf. A candle that only covers the prior wick is not an engulfing pattern. Fix: require the second real body to cover the first real body, open-to-close.
Trading the pattern in mid-air. An engulf with no trend and no level behind it has no reason to hold. Fix: only take engulfing signals at a marked support or resistance, swing point, or supply/demand zone drawn before the candle formed.
Skipping confirmation. Entering on the pattern candle before it closes, or before the next bar agrees, doubles your fakeouts. Fix: wait for the close-through, then for the following candle to hold in the pattern’s direction.
Ignoring relative size. A second body that barely clears the first is a marginal signal dressed as a strong one. Fix: weight large, decisive engulfing bodies higher and discount tiny ones.
Fighting the higher timeframe. A clean H1 engulf against a strong daily trend usually loses. Fix: trade engulfs that agree with H4/D1 structure or form at a major higher-timeframe level.
Placing the stop inside the body. A stop at the pattern’s body gets wicked out on a normal retest. Fix: put the stop beyond the engulfing candle’s extreme wick plus a buffer, and cut lot size to keep the cash risk fixed.
Engulfing patterns on gold (XAU/USD)
Engulfing candles form on gold as clearly as on the majors, but XAU/USD punishes the shape-only reader. Gold’s long wicks and wide range mean marginal engulfs print constantly and fail constantly. Demand a bigger, cleaner body before you trust one.
Frame the trade in price distance first, then in exposure. Gold trades around $4,000 or more per ounce in 2026 with an average daily range near $60 to $110, so a tradeable engulfing takeover should span several dollars per ounce, not a few cents. That price distance, times ounces, times lots, is your cash risk.
On our house convention, one XAU/USD pip is $0.01, which is $1 per pip on a 100-ounce standard lot. A stop placed $6 per ounce beyond the engulfing wick is a 600-pip distance on that ruler and about $600 per standard lot, so the lot size must come down to hold the same cash risk as a tighter forex stop. Size to the dollars-per-ounce distance, not to a pip count borrowed from EUR/USD.
News and session sensitivity are sharper on gold. Engulfing signals during London and New York carry weight, while the same shapes in the quiet Asian session frequently reverse by morning. Stand aside near US CPI, NFP, and FOMC releases.
Frequently asked questions
What is an engulfing candlestick pattern?
It is a two-candle reversal signal in which the second candle’s real body fully covers the first candle’s body and closes past its open. A bullish version forms at a low and a bearish version at a high. The pattern flags a shift in control that still needs confirmation from the next candle.
What is the difference between a bullish and bearish engulfing?
A bullish engulfing is a small down candle followed by a larger up candle that closes above the prior open, and it belongs at a downtrend low or support. A bearish engulfing is a small up candle followed by a larger down candle that closes below the prior open, belonging at an uptrend high or resistance. They are mirror images separated by direction and location.
Does the engulfing candle need to cover the wicks too?
No. The defining rule is body-engulf, not wick-engulf. The second candle’s real body, from open to close, must cover the first candle’s real body, but the shadows can stick out on either side. A candle that covers only the prior wick does not qualify.
How reliable is the engulfing pattern?
Reliability depends far more on location and confirmation than on the shape itself. A large engulfing body at a tested level, on decent volume, confirmed by the next candle, is a higher-odds read; the same shape mid-range is close to a coin flip. Treat every engulf as a probability that needs those filters, never a certainty.
Do I need volume to confirm an engulfing pattern?
Volume is a helpful tie-breaker rather than a requirement. Rising volume on the engulfing candle shows real participation behind the takeover, which raises confidence. On many forex feeds only tick volume is available, so most traders lean on location and the confirming candle as the primary filters.
Where do I place the stop on an engulfing trade?
The invalidation sits beyond the pattern’s extreme wick, because that is where the takeover is proven wrong. For a bullish engulfing the stop goes below the engulfing candle’s low, and for a bearish engulfing above its high, each with a small buffer. Then size the position so the cash risk stays fixed regardless of how wide that distance is.
Does the engulfing pattern work on gold?
Yes, though gold’s long wicks fake more marginal engulfs than any major pair, so demand a bigger, cleaner body. Frame the move in price distance first (several dollars per ounce, not a few cents), then convert to exposure and cash risk. Avoid engulfing signals near US news and in the thin Asian session.
What timeframe is best for engulfing patterns?
H1, H4, and D1 give the most reliable engulfs, because each candle carries enough orders for the takeover to be real and the spread is a small fraction of the range. On M5 and M1 the pattern prints and fails constantly. A daily engulfing at a weekly level is one of the cleaner reversal reads in forex, and also one of the rarer ones.
Glossary of related terms
- Real body: the thick part of a candle between the open and the close; the engulfing rule is measured on this, not on the wicks.
- Wick (shadow): the thin line marking the high and low of a candle; long wicks show rejection.
- Bullish engulfing: a small down candle followed by a larger up candle that closes above the prior open, read at a low.
- Bearish engulfing: a small up candle followed by a larger down candle that closes below the prior open, read at a high.
- Confirmation: the candle after the pattern closing in its direction, turning a shape into a tradeable signal.
- Location filter: the requirement that a reversal form at a level and against a prior trend, not in open space.
- Marubozu: a candle with almost no wick, the cleanest possible takeover bar.
- Reversal pattern: a formation that signals the current trend may be turning rather than continuing.
Related reading
- Reversal candlestick patterns: the complete list, where the engulfing sits among its siblings.
- Complete forex candlestick patterns guide, the full candle-reading system.
- Engulfing pattern forex strategy, a named entry-and-stop system built on this bar.
- Marubozu candlestick pattern, the no-wick body that makes the cleanest engulf.
- Free candlestick cheat sheet, a save-and-print companion for level-plus-pattern reads.
Forex and CFD trading carries a high level of risk and may not be suitable for all traders. The patterns and rules described here are educational, and every pattern shows probability, not certainty. Past performance does not guarantee future results. Test any approach on a demo account before risking real capital.
Ready to put this into practice?
Open an account with a regulated broker and apply what you have learned. These are the three brokers we recommend:
Trading forex and CFDs carries a significant risk of loss and is not suitable for everyone. Broker links are affiliate links — we may earn a commission at no cost to you.