

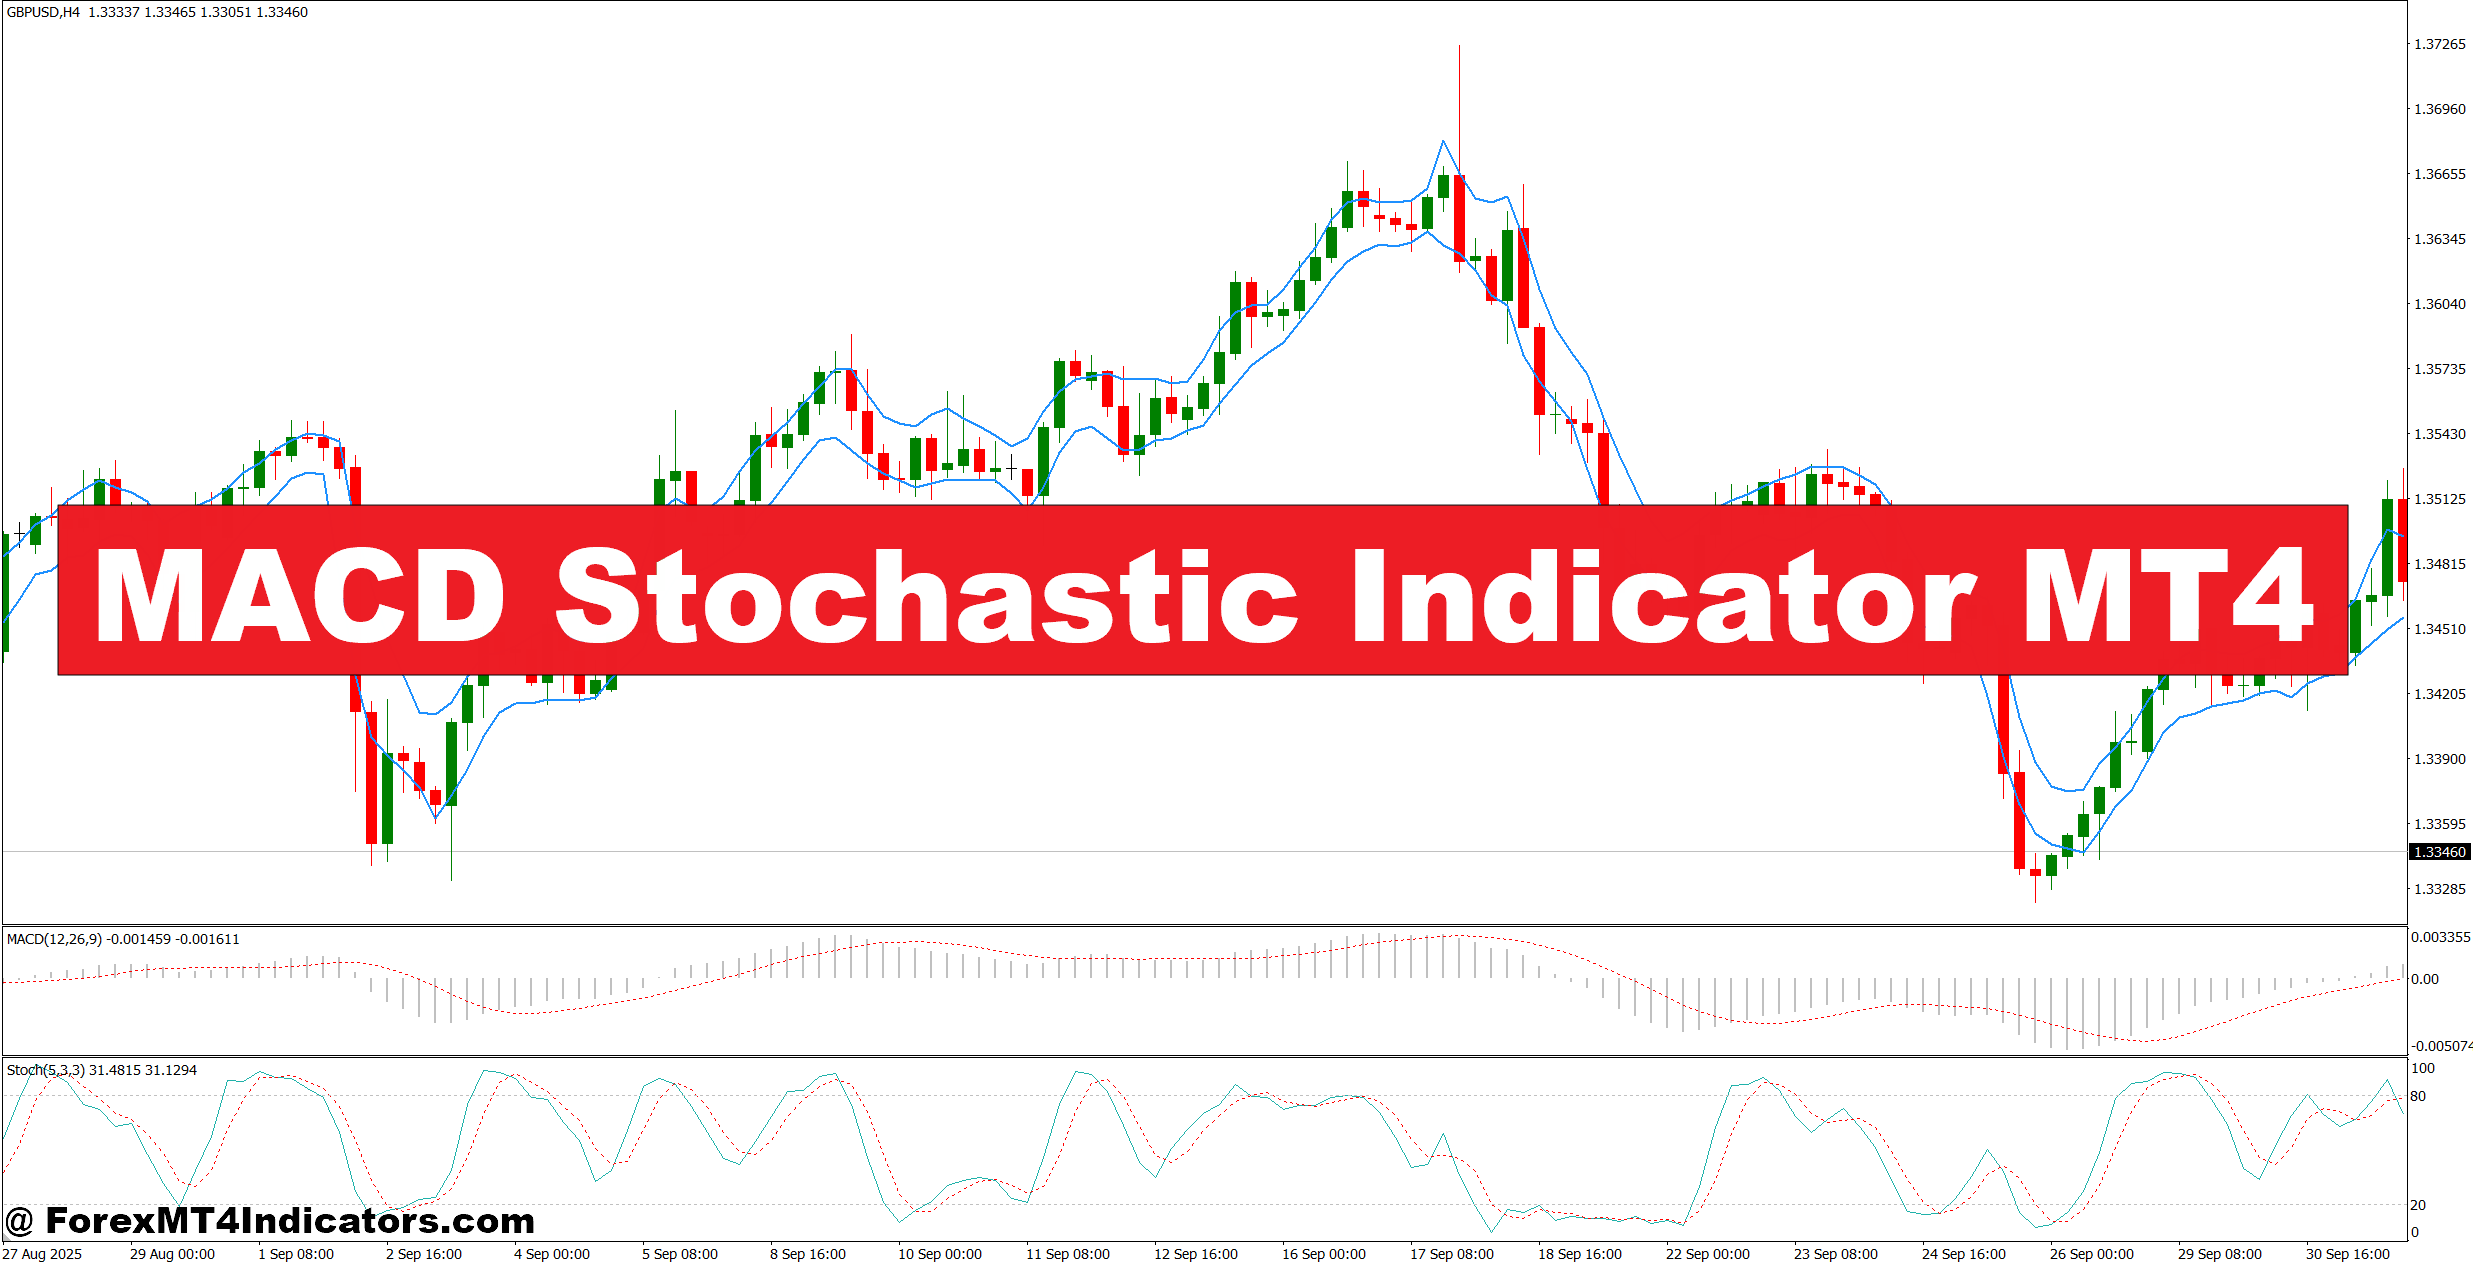
The MACD Stochastic Indicator MT4 combines the logic of the Moving Average Convergence Divergence (MACD) and Stochastic Oscillator. Both measure momentum, but they approach the market differently.
MACD generally compares two exponential moving averages. A common setup uses a 12-period EMA and a 26-period EMA, with a 9-period signal line. The basic calculation is:
MACD Line = 12 EMA − 26 EMA
The Stochastic Oscillator compares the current closing price with its recent trading range. A typical 14-period setting uses:
%K = [(Current Close − Lowest Low) / (Highest High − Lowest Low)] × 100
The indicator then applies smoothing and a signal line to these calculations. MT4 versions can differ in their exact visual presentation and parameters, so traders should check the inputs supplied with their particular indicator.
What makes the combination useful? MACD gives more information about directional momentum, while Stochastic reacts more quickly to short-term price movement. When both point in the same direction, a setup can have more technical support than a signal from either tool alone.
How Traders Can Read Its Signals
The strongest setups usually appear when the indicator agrees with price action rather than replacing it.
Bullish Setup
Suppose GBP/USD is trading on the 1-hour chart. Price holds above a previous support zone around 1.2680 and forms a higher low. The MACD component turns bullish, while the Stochastic lines cross upward from below the 20 level.
A trader could wait for the next candle to close above the recent minor swing high. If that happens near 1.2715, an entry around 1.2720 could be considered. A stop below the structure at 1.2685 gives roughly 35 pips of initial risk.
A potential target near 1.2780 would offer about 60 pips, producing a risk-to-reward ratio close to 1:1.7.
The key point is that the indicator did not create the trade by itself. Support, market structure, and momentum all lined up.
Bearish Setup
Now consider EUR/USD on the 4-hour chart. Price rejects resistance around 1.0940 and creates a lower high near 1.0925. MACD moves below its signal line, while Stochastic falls from above 80.
If price breaks a nearby support level at 1.0895, a trader might consider a short around 1.0890. A stop near 1.0930 represents about 40 pips of risk, while a target around 1.0825 provides approximately 65 pips of potential reward.
This type of confirmation is generally more useful than selling simply because Stochastic reaches 80.
Settings for Different Forex Conditions
There isn’t one perfect setting for every pair and timeframe. Faster charts need different treatment from slower charts because market noise increases as the timeframe falls.
For an H1 or H4 trend-following approach, traders can start with the traditional MACD parameters of 12, 26, 9 and a Stochastic setting around 14, 3, 3. These settings provide a reasonable baseline without making the indicator excessively sensitive.
On an M5 or M15 chart, a trader might test a faster Stochastic such as 9, 3, 3. However, this also creates more signals and more whipsaws. A faster setting isn’t automatically better.
For EUR/USD, 20–30 pips of risk can sometimes be practical during quieter sessions, while GBP/USD may require 30–50 pips because its intraday movement is often larger. Gold requires a completely different approach; traders should calculate stops from recent volatility rather than copying a fixed forex pip value.
When testing the indicator, traders should compare results during London, New York, and Asian sessions. A setup that behaves well during London volatility may produce several fake-outs during a quiet Asian session.
Advantages and Limitations of the Indicator
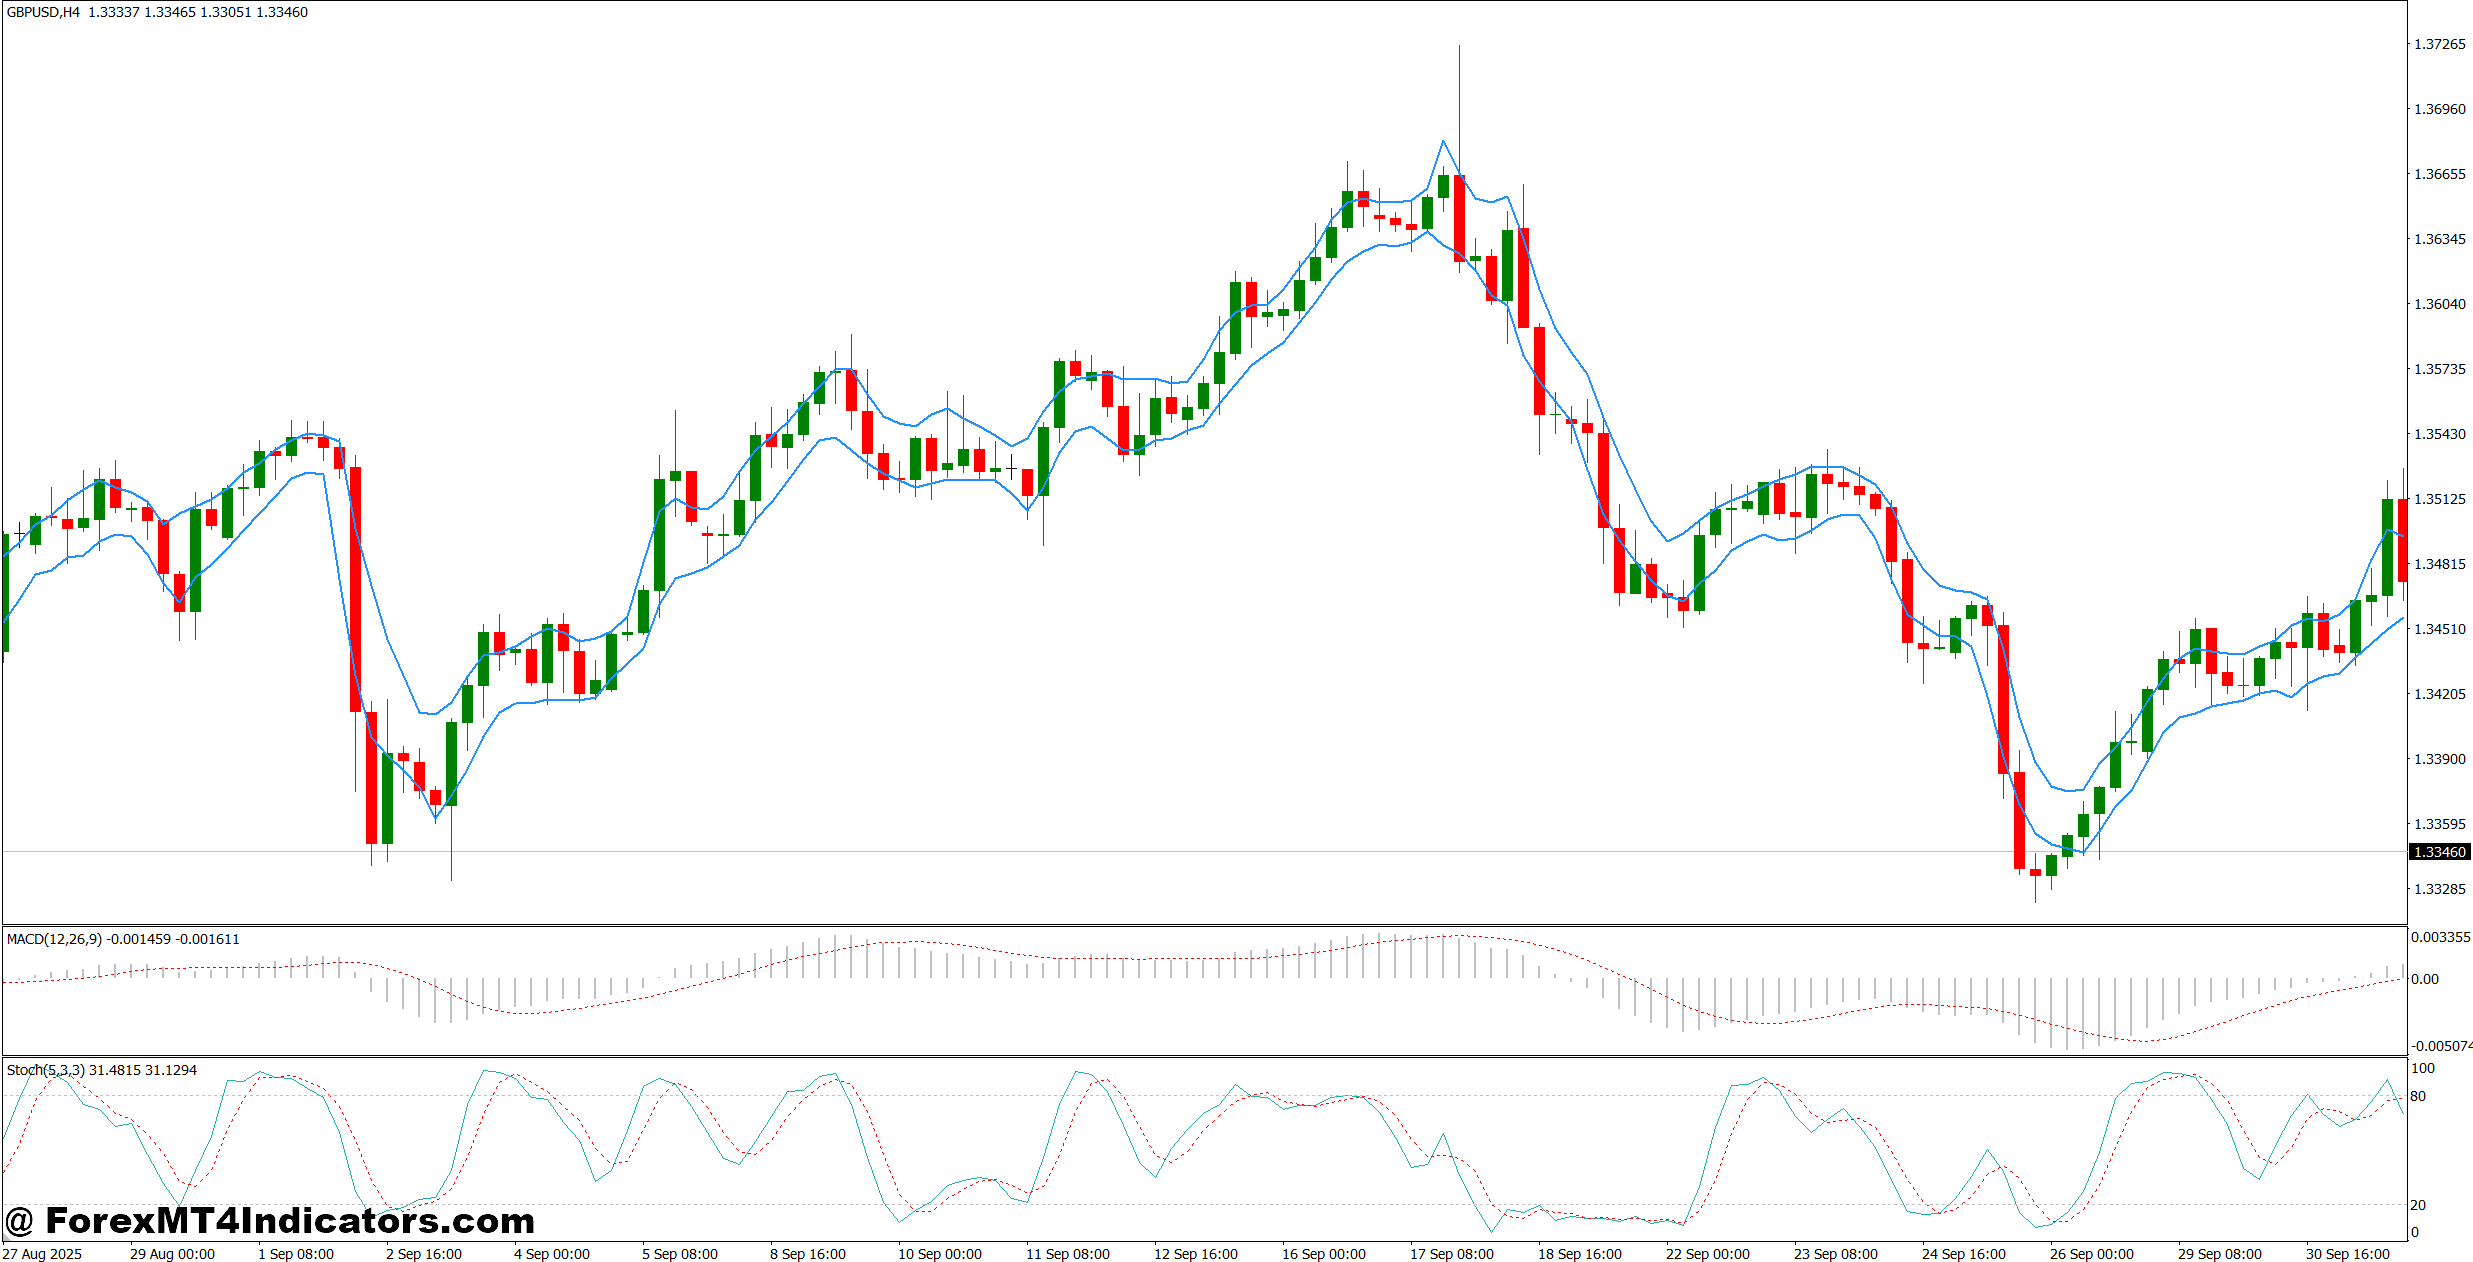
One clear advantage is confirmation. MACD and Stochastic measure momentum from different angles, so their combination can help traders avoid some isolated signals.
It can also work well with support and resistance. For example, a bullish signal at established H1 support deserves more attention than the same signal appearing in the middle of a sideways range.
But there is a catch. Both components are derived from price, so neither provides truly independent information. During strong trends, Stochastic can remain overbought or oversold for a long time. Selling merely because it reaches 80 can be expensive.
The indicator can also lag during sudden moves. On NFP days, for instance, EUR/USD can move 50–80 pips within minutes. Waiting for multiple confirmations may mean missing the first part of the move, while entering immediately can expose the account to a sharp reversal.
A practical approach is to avoid trading the indicator during major news releases unless the trader has a tested news strategy.
MACD Stochastic vs. MACD and Stochastic Alone
Using MACD alone can provide useful trend and momentum information, particularly through zero-line movement and signal-line crossovers. However, entries can arrive late after a strong move.
Stochastic alone reacts faster. That makes it useful for pullbacks, but it can generate frequent signals during trending markets.
The combined MACD Stochastic approach attempts to balance those characteristics. MACD can provide directional confirmation, while Stochastic can help identify a better timing point.
Still, traders shouldn’t assume that combining two indicators automatically creates a superior system. Price structure remains critical. A bearish crossover directly above strong weekly support may be a poor short, even if both indicator components agree.
One useful routine is to start with the higher timeframe. A trader can identify the H4 trend, mark important H1 support and resistance, then use the indicator on M15 or H1 for timing. That simple top-down process often produces cleaner decisions than watching indicator signals in isolation.
How to Trade with MACD Stochastic Indicator MT4
Buy Entry
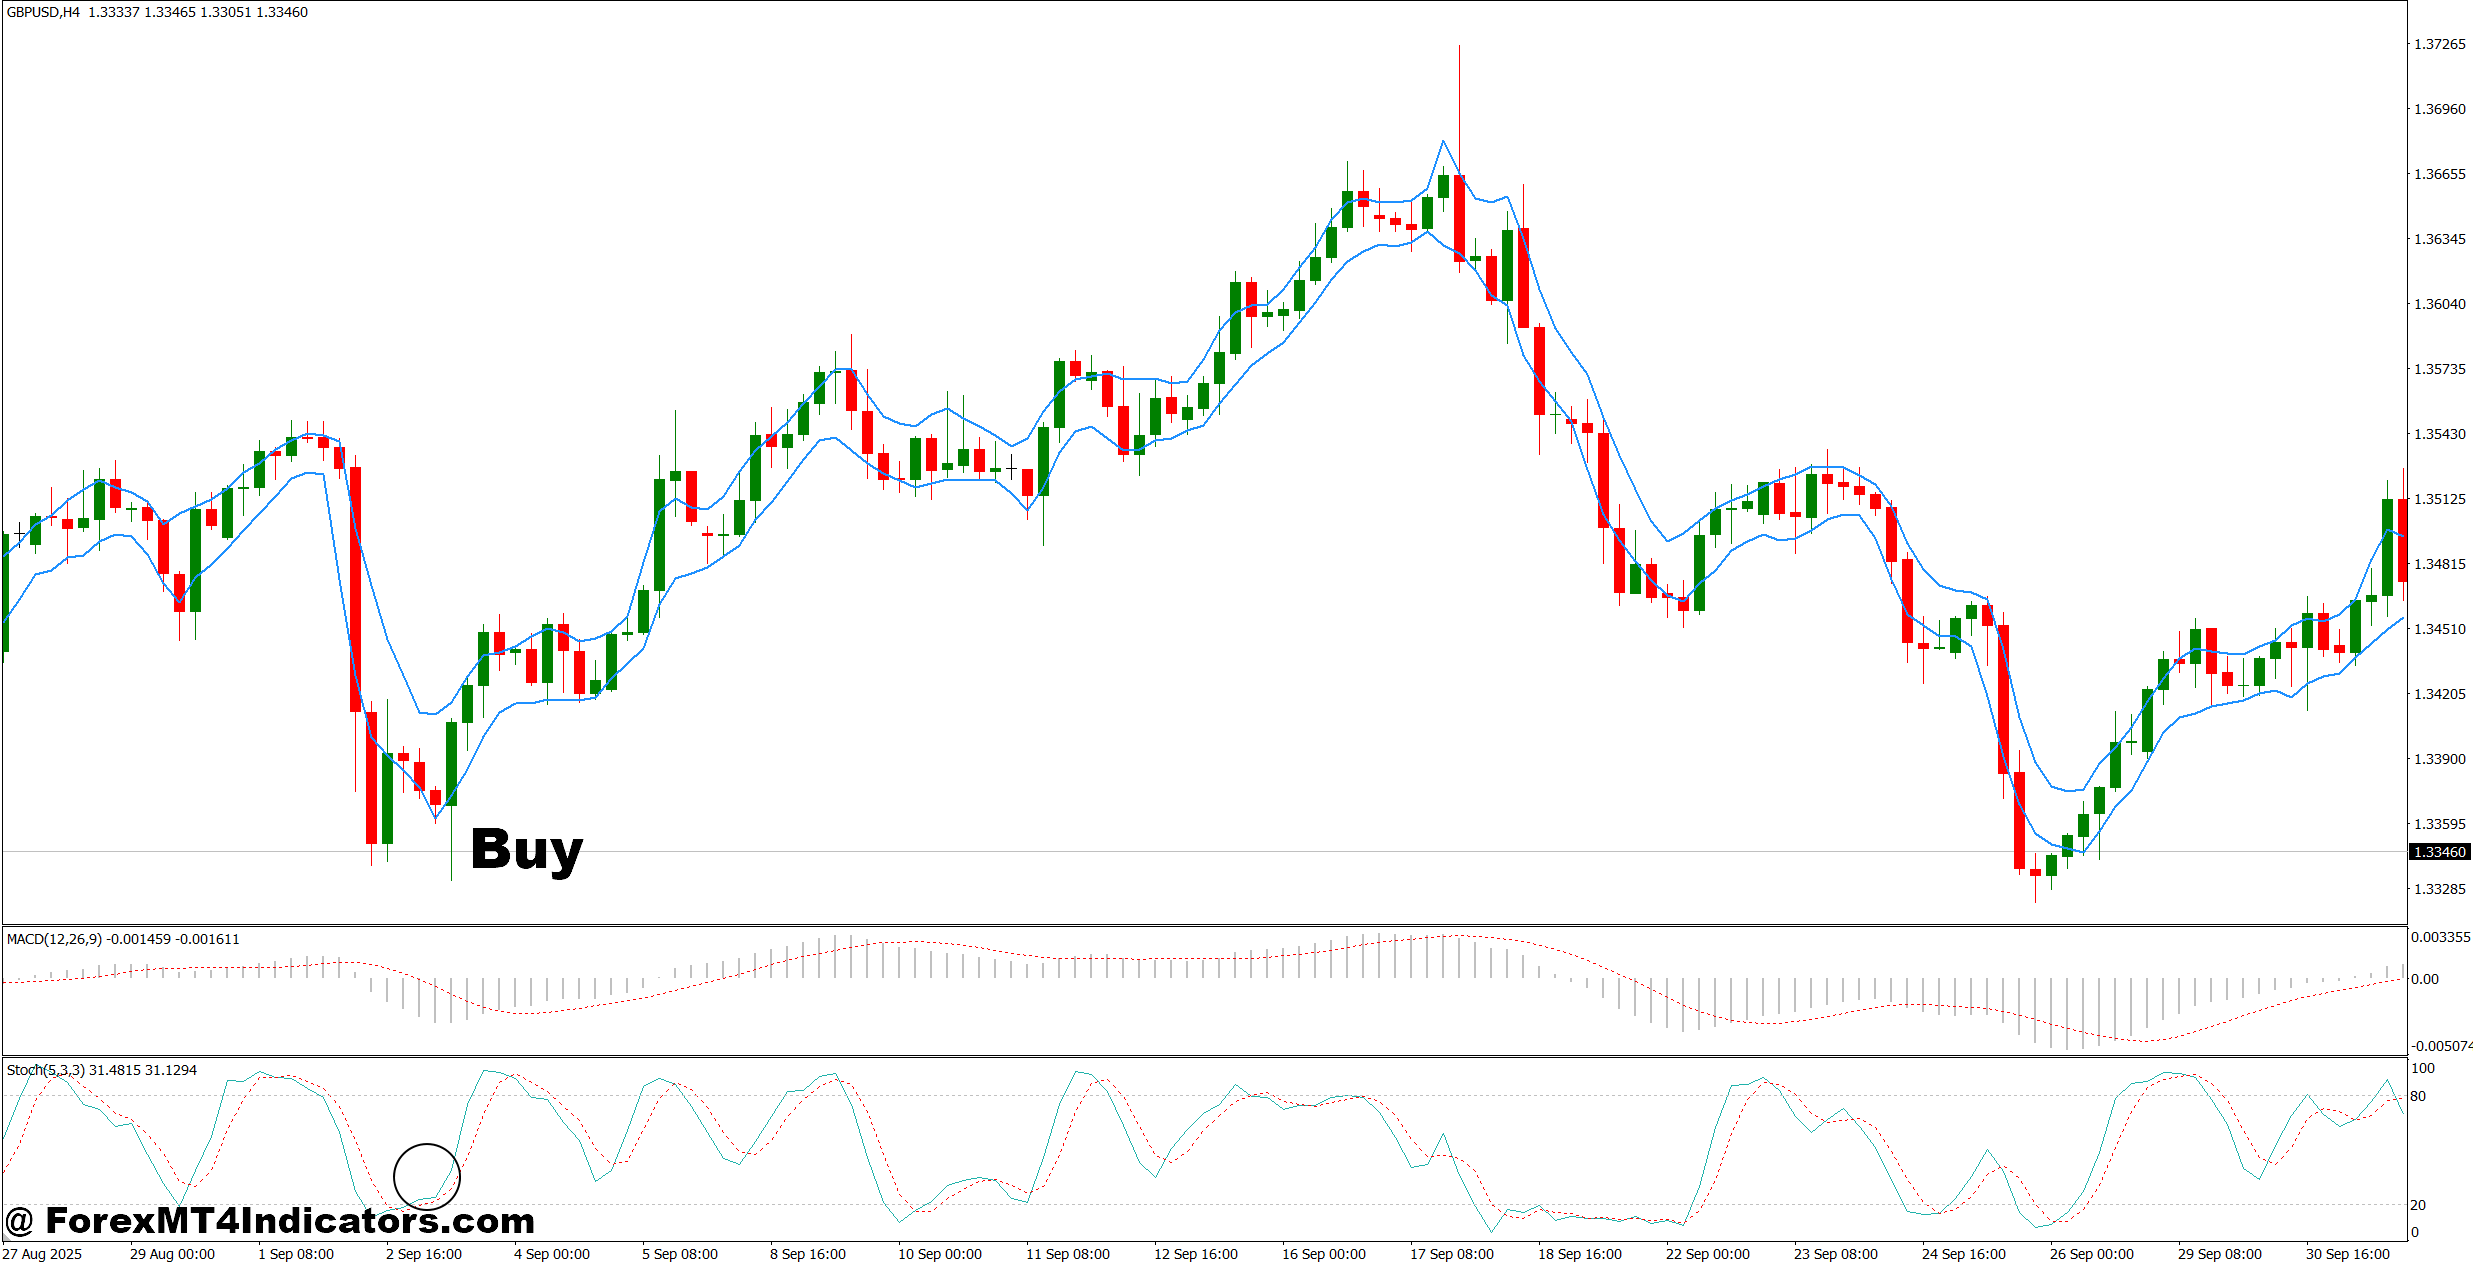
- Wait for a Bullish MACD Cross – Enter after MACD crosses above its signal line on the 1-hour chart, preferably with a 15–30 pip stop.
- Confirm Stochastic Momentum – Look for Stochastic crossing upward below 20, then consider a buy after the candle closes.
- Buy Above Support – On EUR/USD H1, consider buys when price rejects support and MACD turns bullish; risk no more than 1–2% per trade.
- Check the 4-Hour Trend – Take H1 buy signals when the H4 structure shows higher highs and higher lows.
- Use Breakout Confirmation – On GBP/USD H1, wait for a 10–15 pip breakout above resistance before entering.
- Target at Least 1:2 Risk/Reward – If the stop is 25 pips, aim for roughly 50 pips or more instead of taking small profits.
- Avoid Overbought Chasing – Don’t buy EUR/USD after a 50+ pip rally when Stochastic is already above 80 without a fresh pullback.
- Reduce Risk During News – Avoid new BUY trades 15–30 minutes before major events such as NFP or central-bank decisions.
Sell Entry
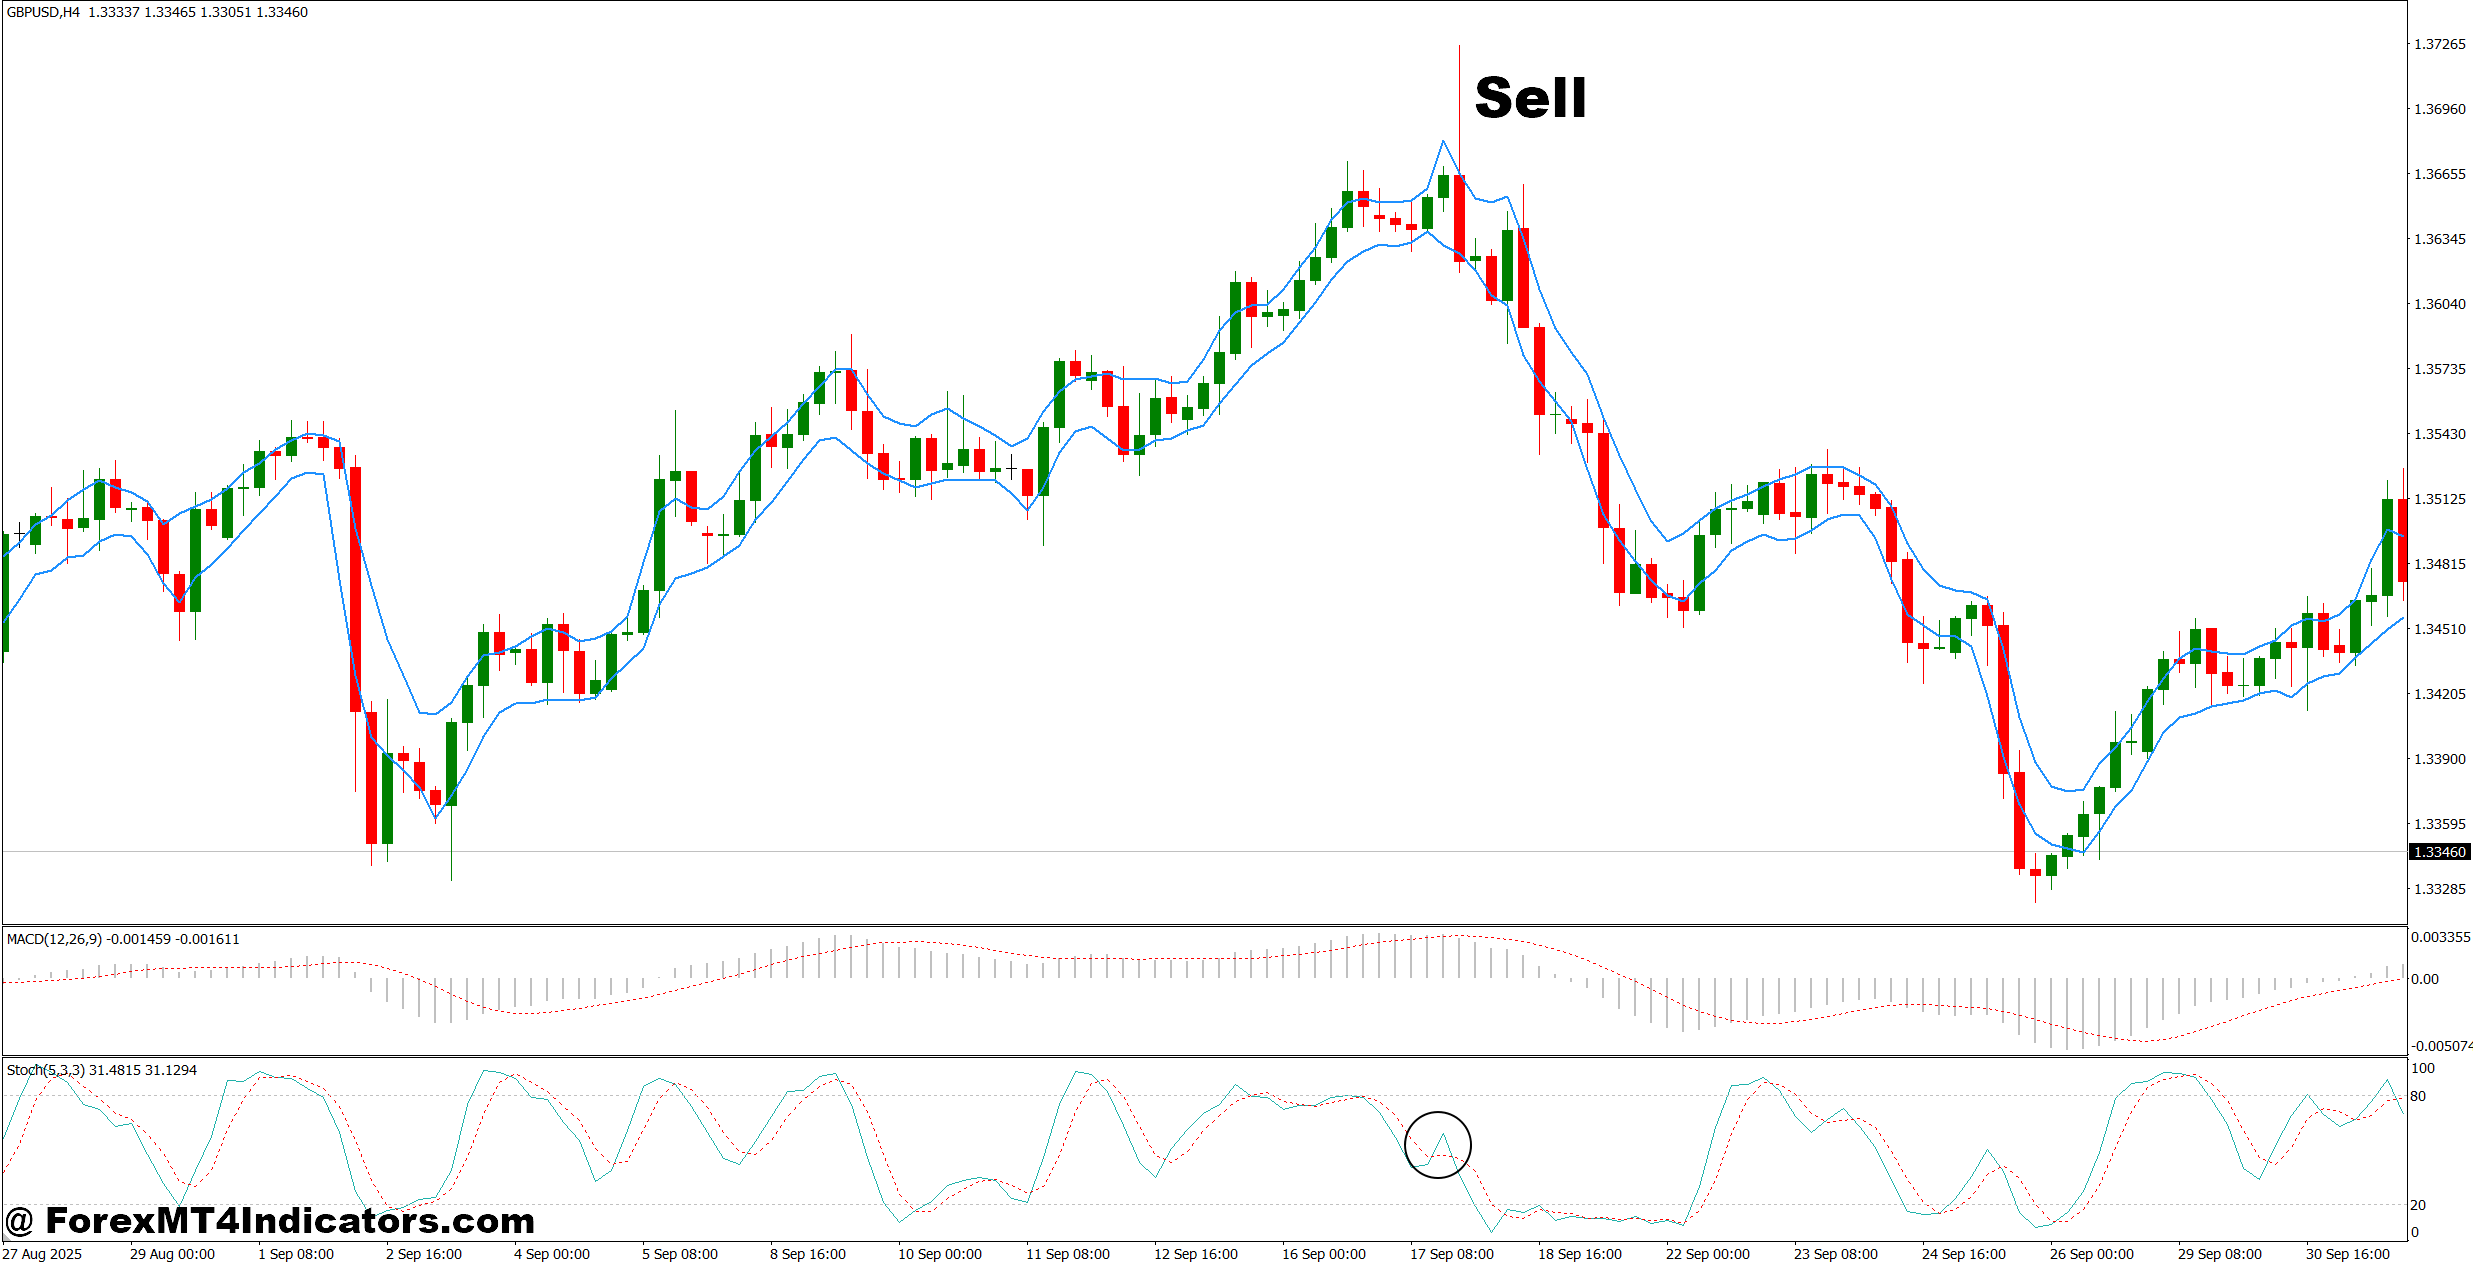
- Wait for a Bearish MACD Cross – Consider selling after MACD crosses below its signal line on H1 with bearish price confirmation.
- Confirm Stochastic Reversal – Look for Stochastic crossing downward above 80 before taking a short position.
- Sell Near Resistance – On EUR/USD H1, consider a sell after rejection around resistance with a 20–40 pip protective stop.
- Follow the 4-Hour Trend – Favor H1 SELL signals when the H4 chart shows lower highs and lower lows.
- Confirm Support Breaks – On GBP/USD H1, wait for a 10–20 pip break below support before entering a short.
- Protect the Account – Keep individual trade risk around 1–2% and reduce position size when volatility expands.
- Avoid Selling Strong Rallies – Don’t short simply because Stochastic reaches 80; strong trends can remain overbought for hours or days.
- Skip Weak Signals in Chop – Avoid SELL entries when MACD repeatedly crosses its signal line around zero on the 1-hour chart.
Final Thoughts on MACD Stochastic Indicator MT4
The MACD Stochastic Indicator MT4 can be useful for traders who want momentum confirmation without watching two separate indicator windows. Its strongest use comes from combining the signal with market structure, support and resistance, and sensible risk control.
- MACD helps assess directional momentum.
- Stochastic can improve timing around pullbacks.
- Price structure should confirm the technical signal.
- Stop-loss placement should reflect volatility rather than a fixed number.
The indicator won’t prevent every losing trade, and it can struggle badly in sideways conditions or during sudden news moves. Traders should test their preferred settings on historical data and then forward-test them on a demo account before risking real money.
Trading forex carries substantial risk. No indicator guarantees profits. The real edge comes from how the trader manages entries, exits, position size, and losing streaks—not from the indicator alone.
Level up your trading
Learn to read the chart — not just the indicator
eBook · Instant PDF
Video Course · 12 modules
Recommended MT4/MT5 Brokers
- ✓ *FREE *$50 to start (withdrawable)
- ✓ Deposit bonus up to $5,000
- ✓ Negative balance protection
Trading forex and CFDs carries a significant risk of loss and is not suitable for everyone. Broker links are affiliate links — we may earn a commission at no cost to you.
Free MT4 Indicator Download

Enter Your Email Address below, download link will be sent to you.