

The Heiken Ashi Smoothed Arrow Indicator is an MT4 technical analysis tool designed to show the underlying direction of price with less noise than standard candlesticks. It typically displays smoothed bullish and bearish candles along with arrows when its internal conditions suggest a possible directional shift.

Standard Heiken Ashi candles use modified open, high, low, and close values. A common calculation is:
- HA Close = (Open + High + Low + Close) ÷ 4
- HA Open = (Previous HA Open + Previous HA Close) ÷ 2
- HA High = maximum of High, HA Open, and HA Close
- HA Low = minimum of Low, HA Open, and HA Close
The smoothed version adds moving-average calculations before or after the Heiken Ashi transformation, depending on the indicator’s coding. This reduces the effect of isolated price spikes and makes sustained moves appear cleaner.
The arrow normally appears when the indicator’s trend conditions change. Exact arrow logic can vary between MT4 versions, so traders should check the specific indicator’s input settings and source code rather than assuming every version calculates signals identically.
How the Indicator Works in Real Trading
The main idea is simple: reduce candle noise, identify directional changes, then confirm the signal with price action.
Consider EUR/USD on the 1-hour chart. Suppose price has been trading between 1.0840 and 1.0880 for several hours. A bullish arrow appears near 1.0845 after price rejects the lower part of the range. Instead of buying immediately, a trader can wait for an H1 candle to close above a nearby minor resistance level around 1.0860.
That extra confirmation changes the setup. The arrow provides direction, while the breakout provides evidence that buyers are actually gaining control.
A practical setup might look like this:
- Entry: 1.0862 after an H1 close above resistance
- Stop-loss: 1.0837, approximately 25 pips
- Initial target: 1.0900, approximately 38 pips
- Risk-to-reward: about 1:1.5
The same principle works on GBP/USD, but the stop may need to be wider because the pair often produces larger intraday swings.
Traders should also pay attention to market structure. A bullish arrow below a sequence of higher lows has more context than an identical arrow appearing directly beneath major resistance. The indicator can help with timing, but support, resistance, volatility, and trend structure still matter.
Settings for Different Timeframes and Pairs
There isn’t one perfect configuration for every market. A setting that looks clean on EUR/USD H1 can become too slow on a 5-minute chart.
For M5 and M15 trading, shorter smoothing settings can make the indicator react faster. That can help scalpers catch smaller moves, but it also increases the number of false arrows. During the London session, a trader might focus on 8–15 pip moves on EUR/USD, where even a small delay can affect the trade’s risk-to-reward ratio.
On H1 and H4, stronger smoothing often makes more sense. Traders can focus on moves of 30–80 pips rather than reacting to every minor candle change.
A useful starting approach is:
- M5: lower smoothing for faster signals
- M15: moderate smoothing for intraday setups
- H1: moderate-to-higher smoothing for cleaner trends
- H4: higher smoothing for broader directional moves
These aren’t universal settings. They should be tested on the specific pair and broker feed.
One practical habit is to test the indicator across at least 50–100 historical setups. NFP, CPI, FOMC announcements, and other major events should be tested separately because normal trend behavior doesn’t always apply during those periods.
Advantages, Limitations, and Better Signal Filtering
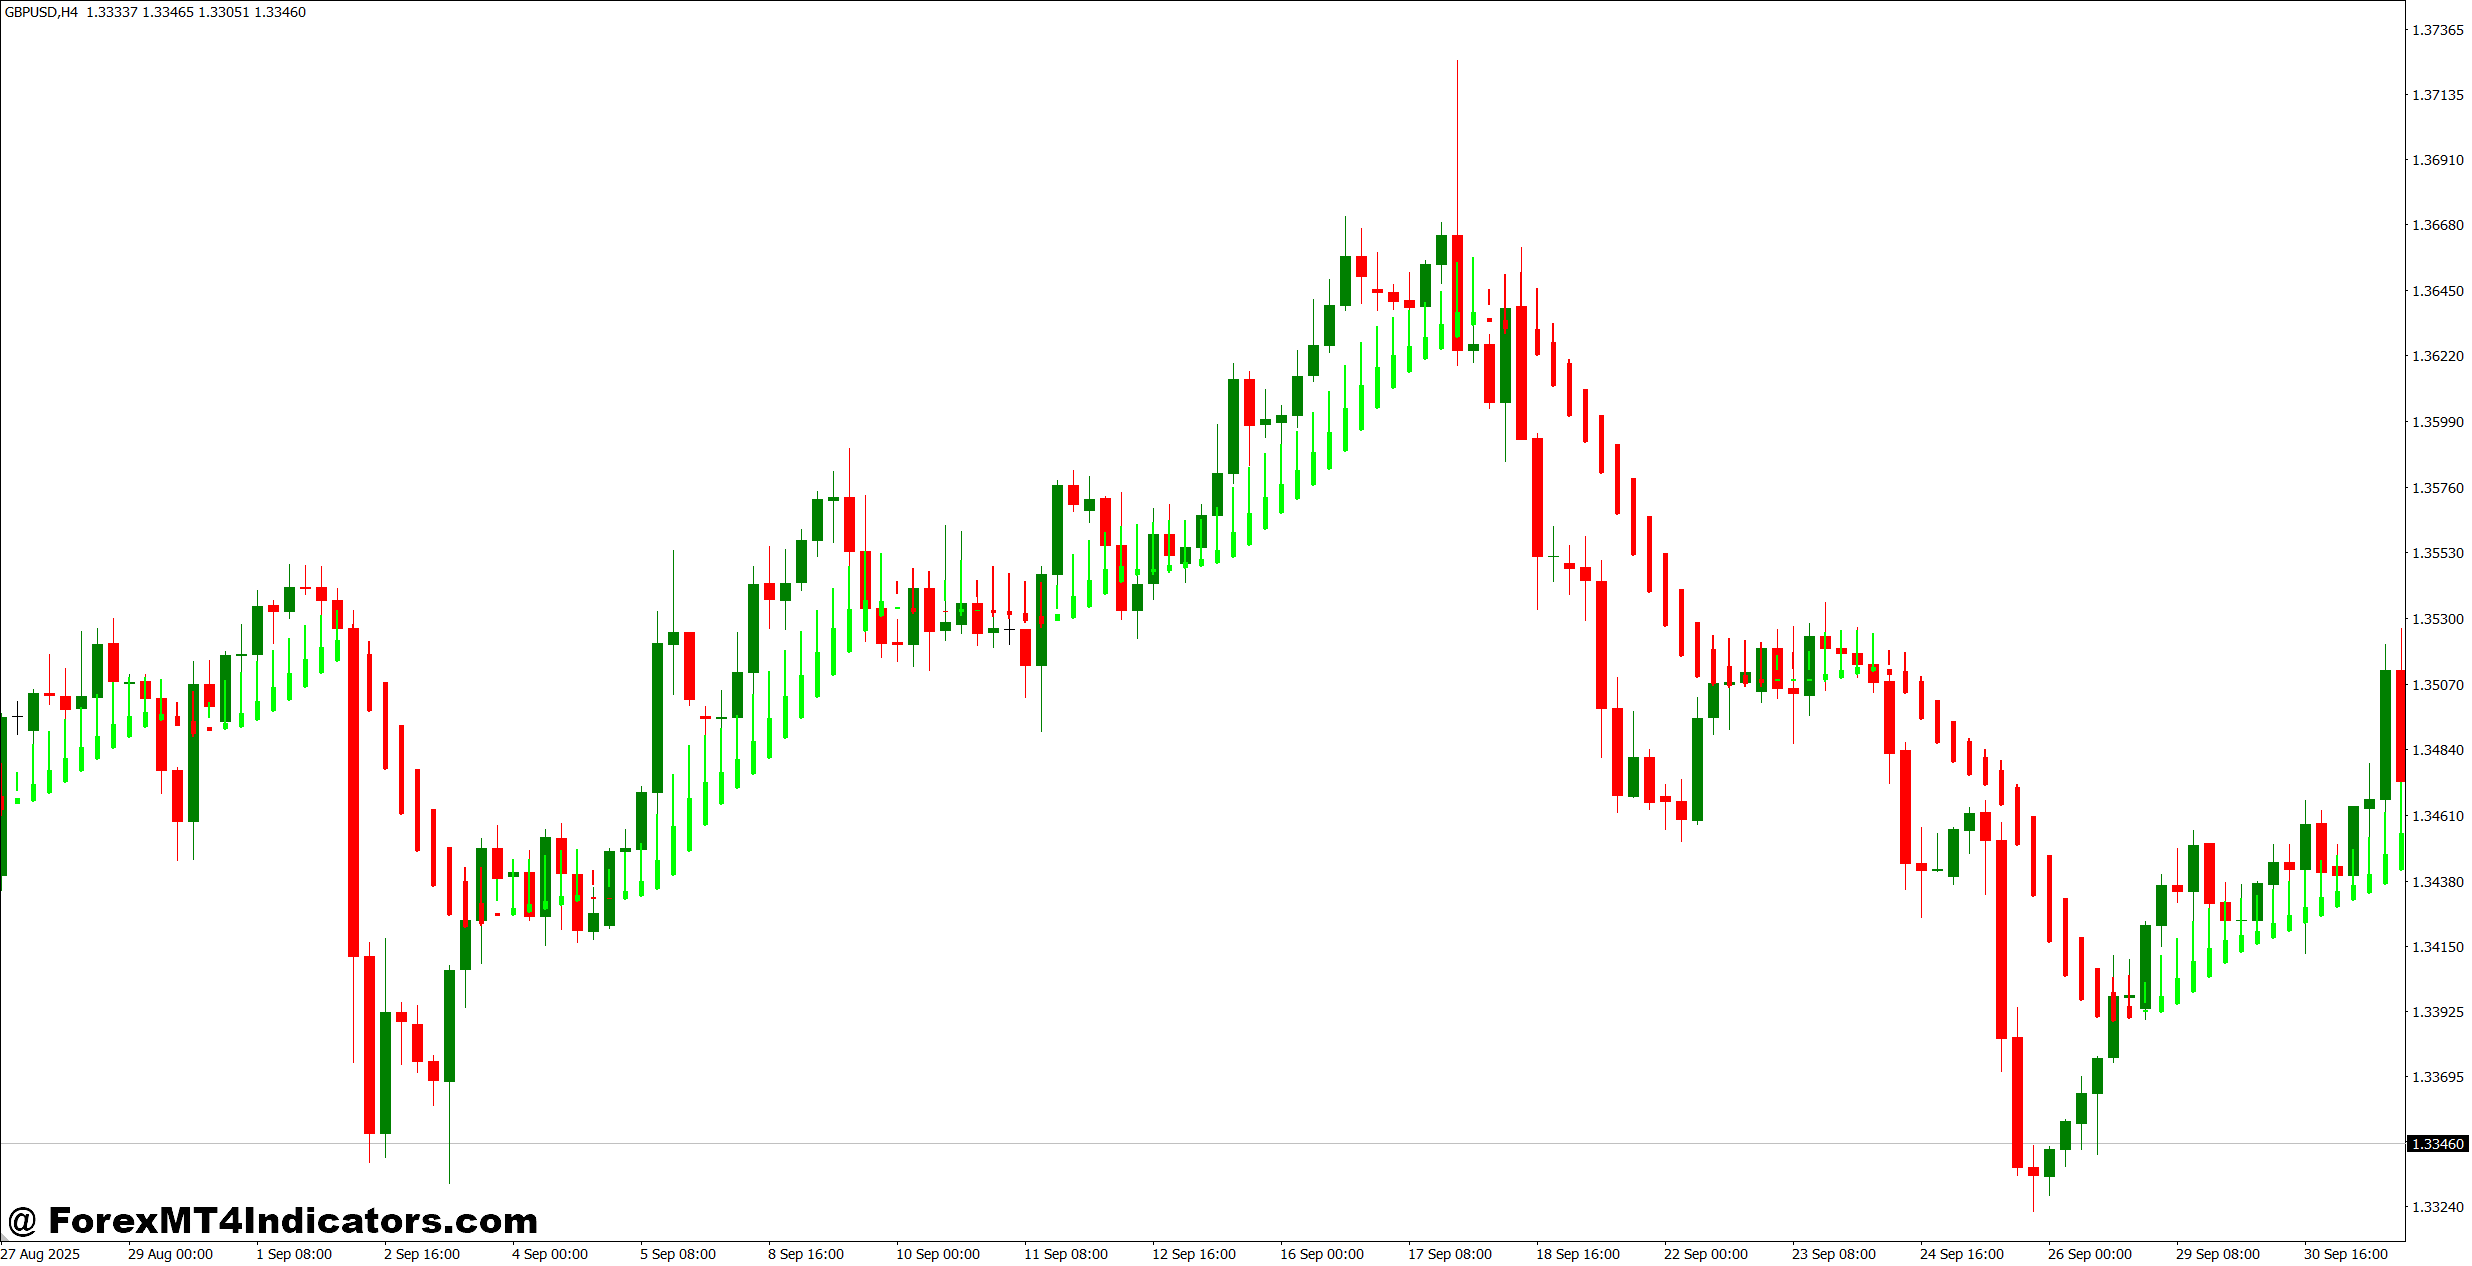
The biggest advantage is visual clarity. Smoothed Heiken Ashi candles can make a sustained trend easier to follow, while arrows provide a quick reference for possible entry changes.
It can also help traders stay in a move. For instance, if GBP/USD remains bullish on H1 and several consecutive smoothed candles hold their bullish direction, a trader may avoid exiting simply because one normal candle pulls back 8–12 pips.
But there is a catch: smoothing creates lag.
A reversal can begin at 1.2700, while the confirmed arrow might appear closer to 1.2720. On a fast market, those 20 pips matter. The indicator can also produce whipsaws when price moves sideways.
This is why experienced traders often add simple filters. A bullish arrow above a rising 50-period moving average can be stronger than one below it. Likewise, a bearish arrow near a well-tested resistance zone deserves more attention than a bearish signal in the middle of a strong bullish trend.
The indicator should also be treated carefully around major economic releases. During an NFP spike, EUR/USD can move 40–70 pips within minutes and then reverse sharply. An arrow printed during that kind of volatility isn’t enough evidence for a trade.
Heiken Ashi Smoothed vs Regular Heiken Ashi and Other Indicators
Regular Heiken Ashi is useful for identifying trend direction, but the smoothed version aims to remove even more short-term noise. That can make it easier to follow trends, although the extra smoothing may delay entries.
Compared with a 50-period moving average, the Heiken Ashi Smoothed Arrow Indicator can offer more visual entry information because it attempts to identify directional changes rather than simply showing the average price.
Compared with MACD, the arrow indicator is generally easier to read at a glance, while MACD provides more information about momentum and the relationship between moving averages.
Compared with RSI, it serves a different purpose. RSI can identify overbought and oversold conditions, while Heiken Ashi-based signals are more focused on directional movement.
A stronger trading plan can combine them without cluttering the chart. For example, a trader could wait for a bullish arrow, confirm that price is above the 50 EMA, and check that the 14-period RSI is above 50. No single indicator has to carry the entire decision.
Risk Management Still Comes First
An arrow doesn’t determine position size, stop placement, or acceptable risk. Those decisions should come from the trading plan.
A trader risking 1% on a $2,000 account has a maximum planned loss of $20. If the EUR/USD setup requires a 25-pip stop, the position size should be calculated from that $20 risk rather than choosing a lot size first.
Traders should also avoid moving a stop farther away simply because an arrow changes direction. If the original setup is invalidated, taking the planned loss is often better than turning a short-term trade into an uncontrolled position.
Trading forex carries substantial risk. No indicator guarantees profits. Backtesting, demo testing, and disciplined position sizing are essential before applying any indicator to a live account.
How to Trade with Heiken Ashi Smoothed Arrow Indicator for MT4
Buy Entry
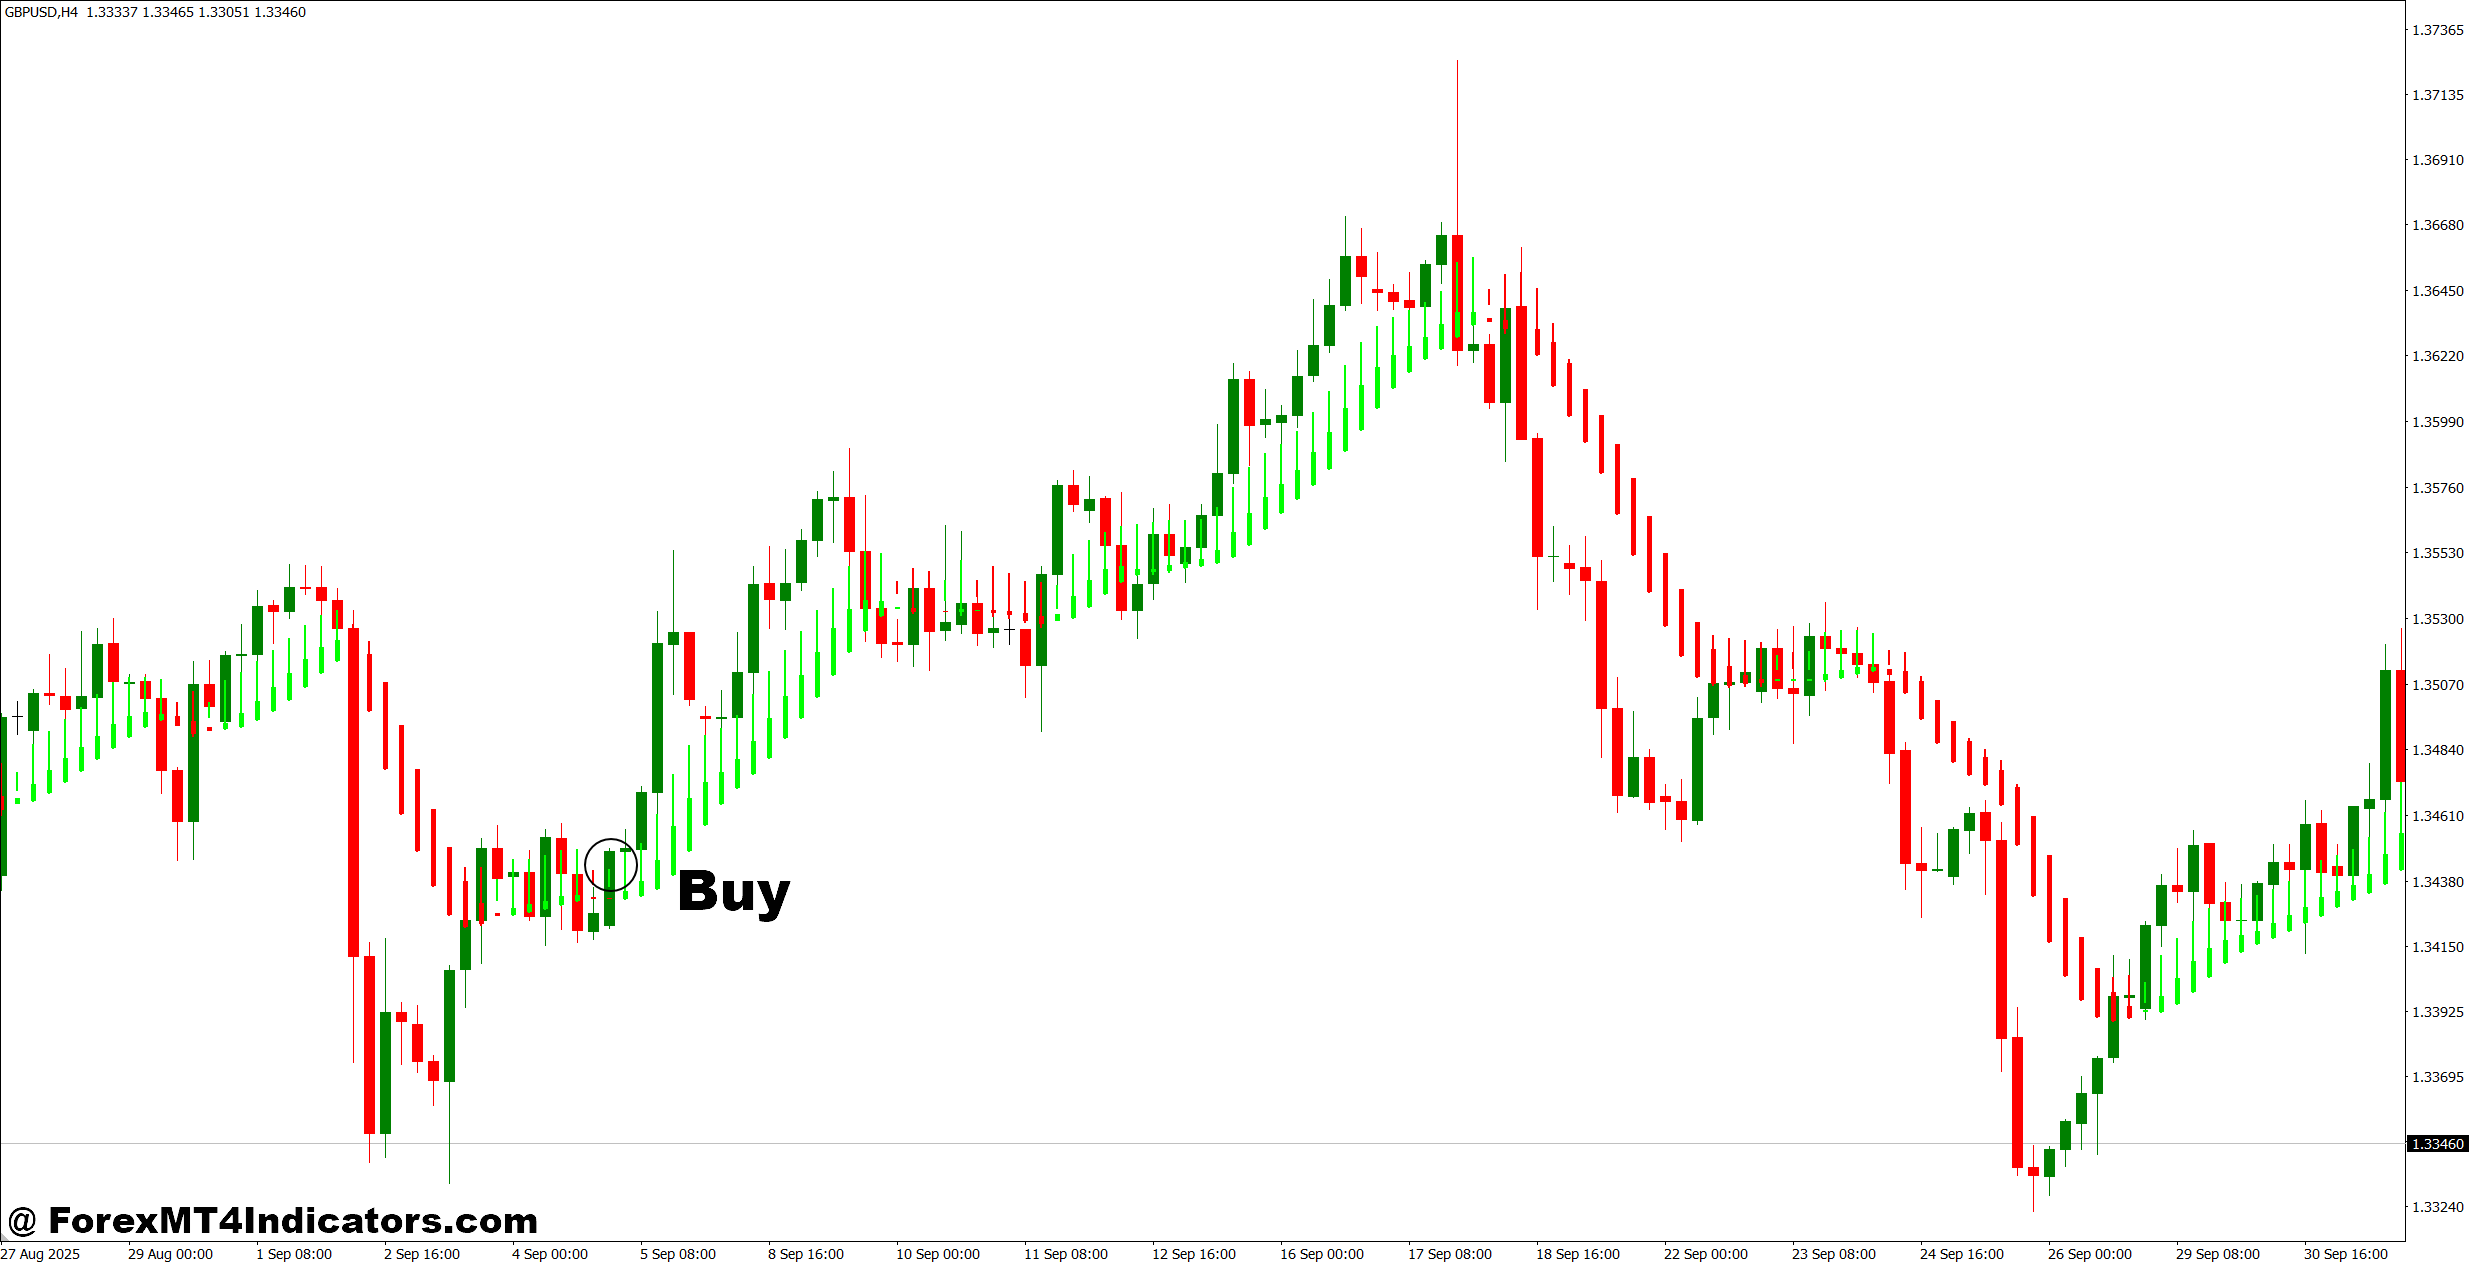
- Wait for a bullish arrow – Enter after a confirmed buy arrow closes on the 1-hour chart, rather than trading an intrabar signal.
- Confirm higher highs – Buy EUR/USD when the arrow appears with a higher-high structure and price breaks at least 5–10 pips above resistance.
- Check H4 direction – Prefer BUY signals when the 4-hour Heiken Ashi trend is bullish, reducing trades against the larger move.
- Use a 20–30 pip stop – Place the stop below the recent swing low, keeping the planned risk near 1% of trading capital.
- Target 40–60 pips – Look for at least a 1:2 risk-to-reward setup when trading EUR/USD or GBP/USD on H1.
- Confirm momentum – A bullish arrow with consecutive green smoothed candles gives stronger confirmation than an isolated arrow.
- Avoid major resistance – Don’t buy GBP/USD if the signal forms within 10–15 pips of strong H1 or H4 resistance.
- Skip choppy signals – Avoid BUY entries when arrows repeatedly switch direction within 3–5 candles, as this often signals a sideways market.
Sell Entry
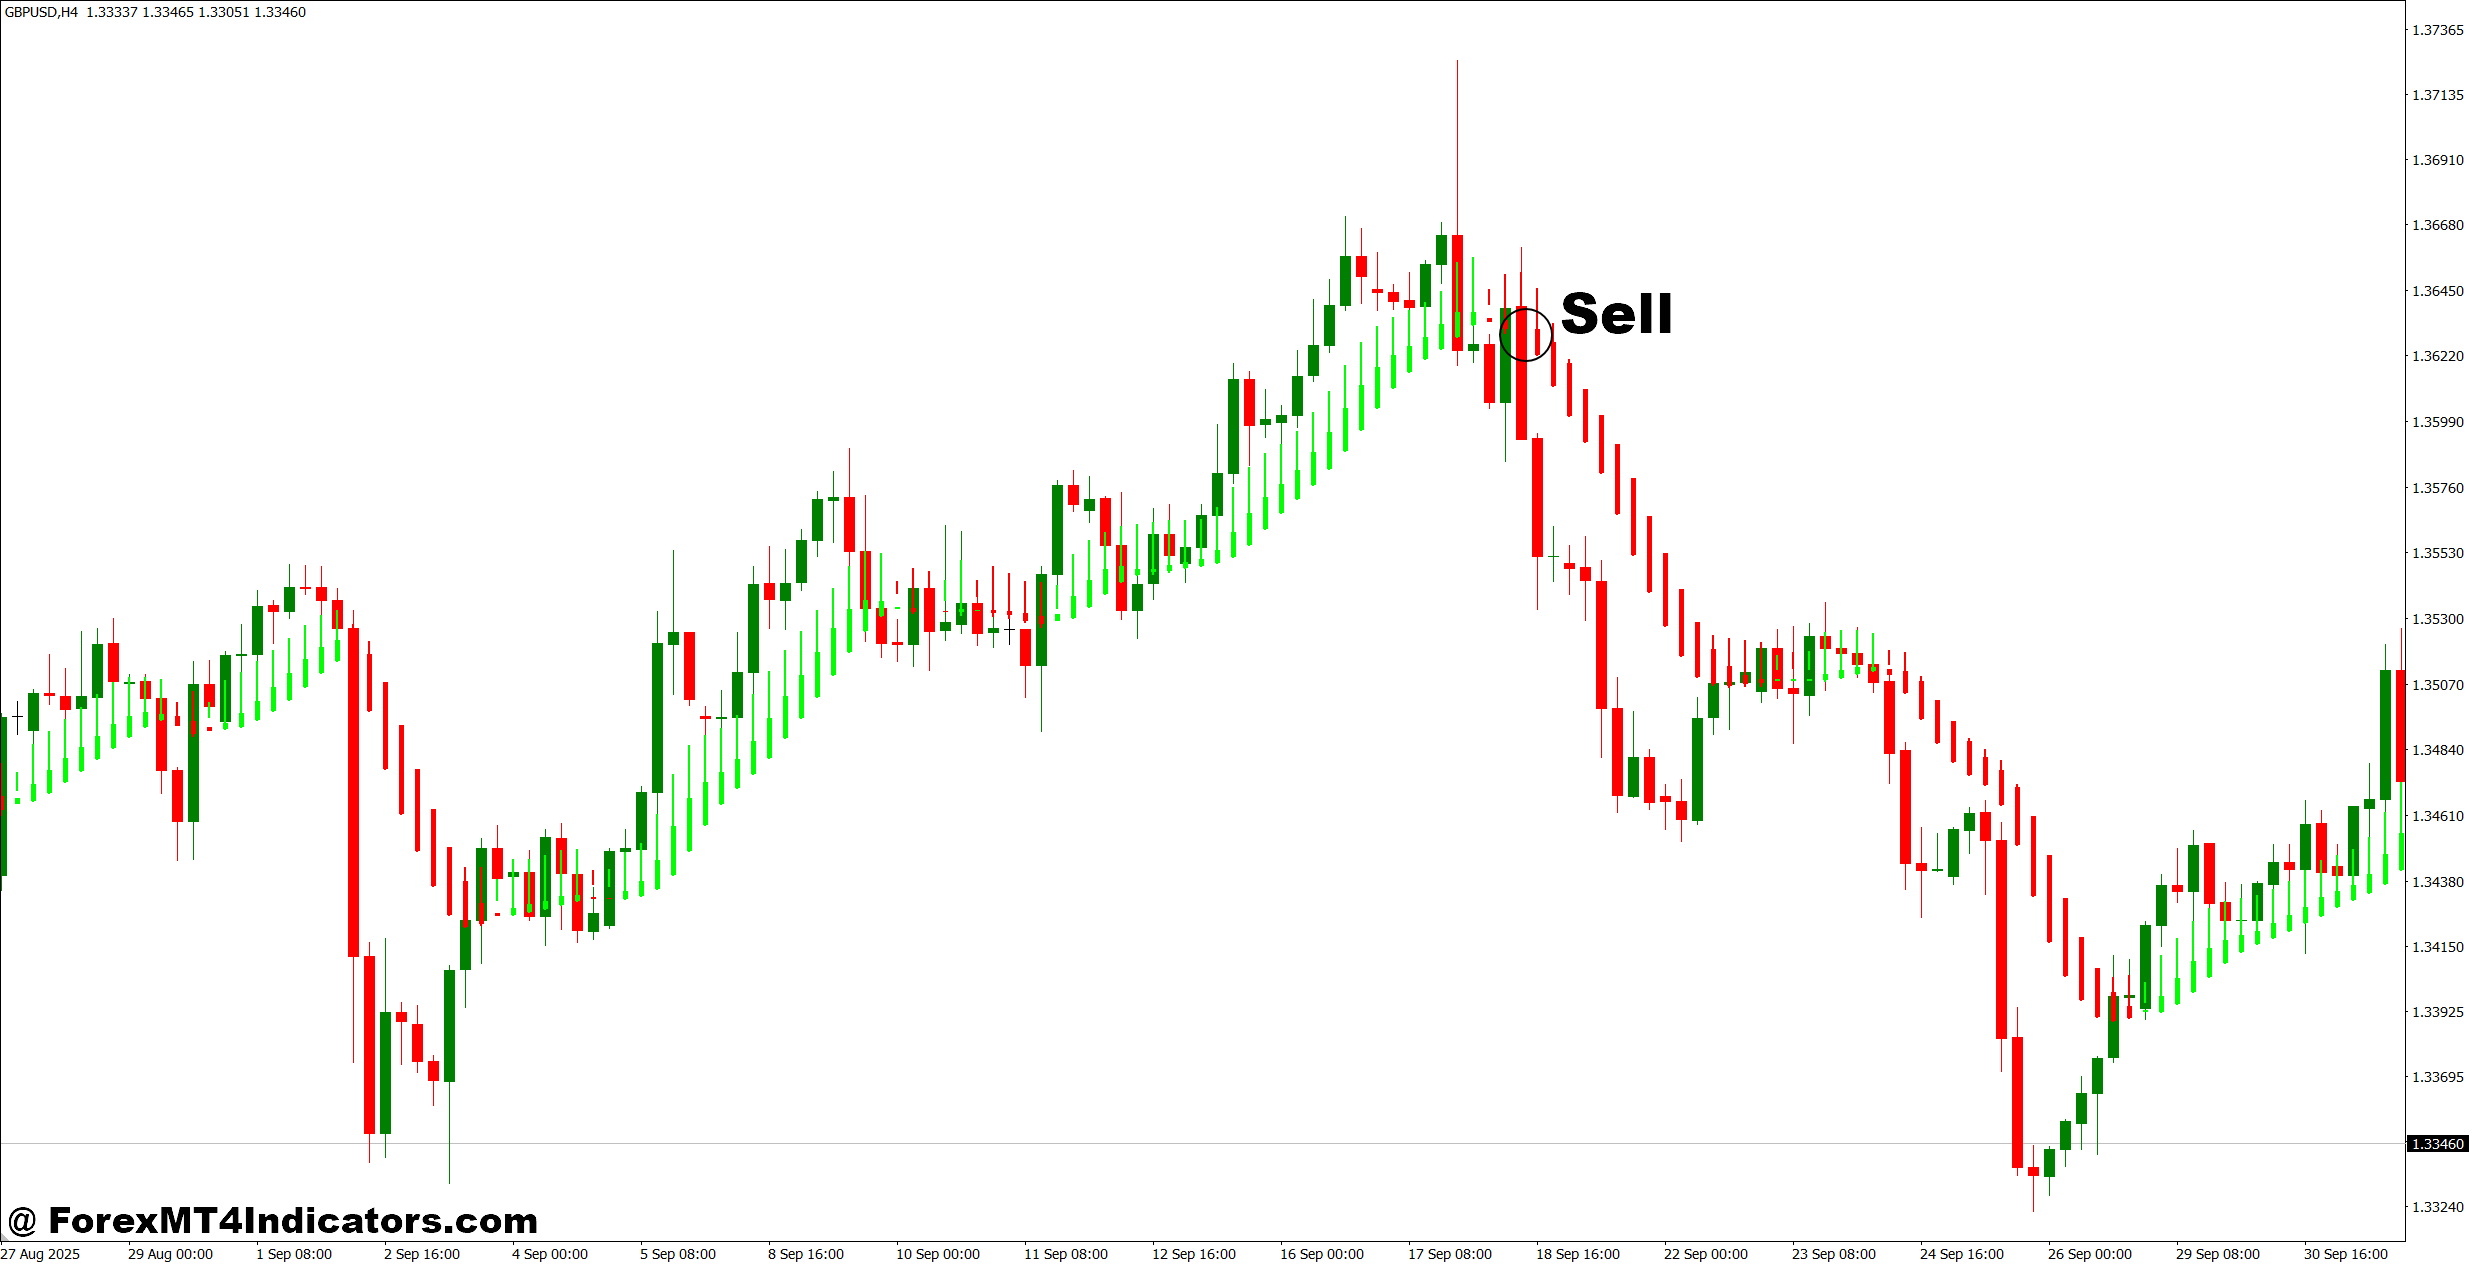
- Wait for a bearish arrow – Sell only after the bearish signal candle closes on the 1-hour or 4-hour chart.
- Confirm lower lows – Sell EUR/USD when price breaks 5–10 pips below recent support and the smoothed candles remain bearish.
- Check daily direction – Give more weight to SELL signals when the Daily chart also shows a bearish trend.
- Set a 20–35 pip stop – Place the stop above the latest swing high and limit planned account risk to around 1%.
- Aim for 40–70 pips – Look for a minimum 1:2 risk-to-reward ratio before entering GBP/USD or EUR/USD SELL trades.
- Confirm bearish momentum – Consecutive red smoothed candles after the arrow can provide stronger confirmation than the arrow alone.
- Avoid nearby support – Don’t sell when price is only 10–15 pips above strong H1 or H4 support.
- Skip reversal traps – Avoid SELL signals immediately after a sharp 30–50 pip drop, especially when price is approaching a major Daily support zone.
Final Takeaways
The Heiken Ashi Smoothed Arrow Indicator for MT4 can be a practical trend-following tool when used with price structure and sensible risk controls.
- It smooths price movement to make directional trends easier to read.
- Arrows can help identify possible changes in bullish or bearish momentum.
- H1 and H4 charts generally provide cleaner signals than very low timeframes.
- Support, resistance, moving averages, and volatility should confirm the setup rather than be ignored.
Its main weakness is lag and false signals during sideways markets. Traders who understand that limitation can use the indicator more effectively instead of expecting every arrow to produce a profitable trade. The best next step is to test the setup on 50–100 historical trades and record which market conditions produce the cleanest results.
Level up your trading
Learn to read the chart — not just the indicator
eBook · Instant PDF
Video Course · 12 modules
Recommended MT4/MT5 Brokers
- ✓ *FREE *$50 to start (withdrawable)
- ✓ Deposit bonus up to $5,000
- ✓ Negative balance protection
Trading forex and CFDs carries a significant risk of loss and is not suitable for everyone. Broker links are affiliate links — we may earn a commission at no cost to you.
Free MT4 Indicator Download

Enter Your Email Address below, download link will be sent to you.
