

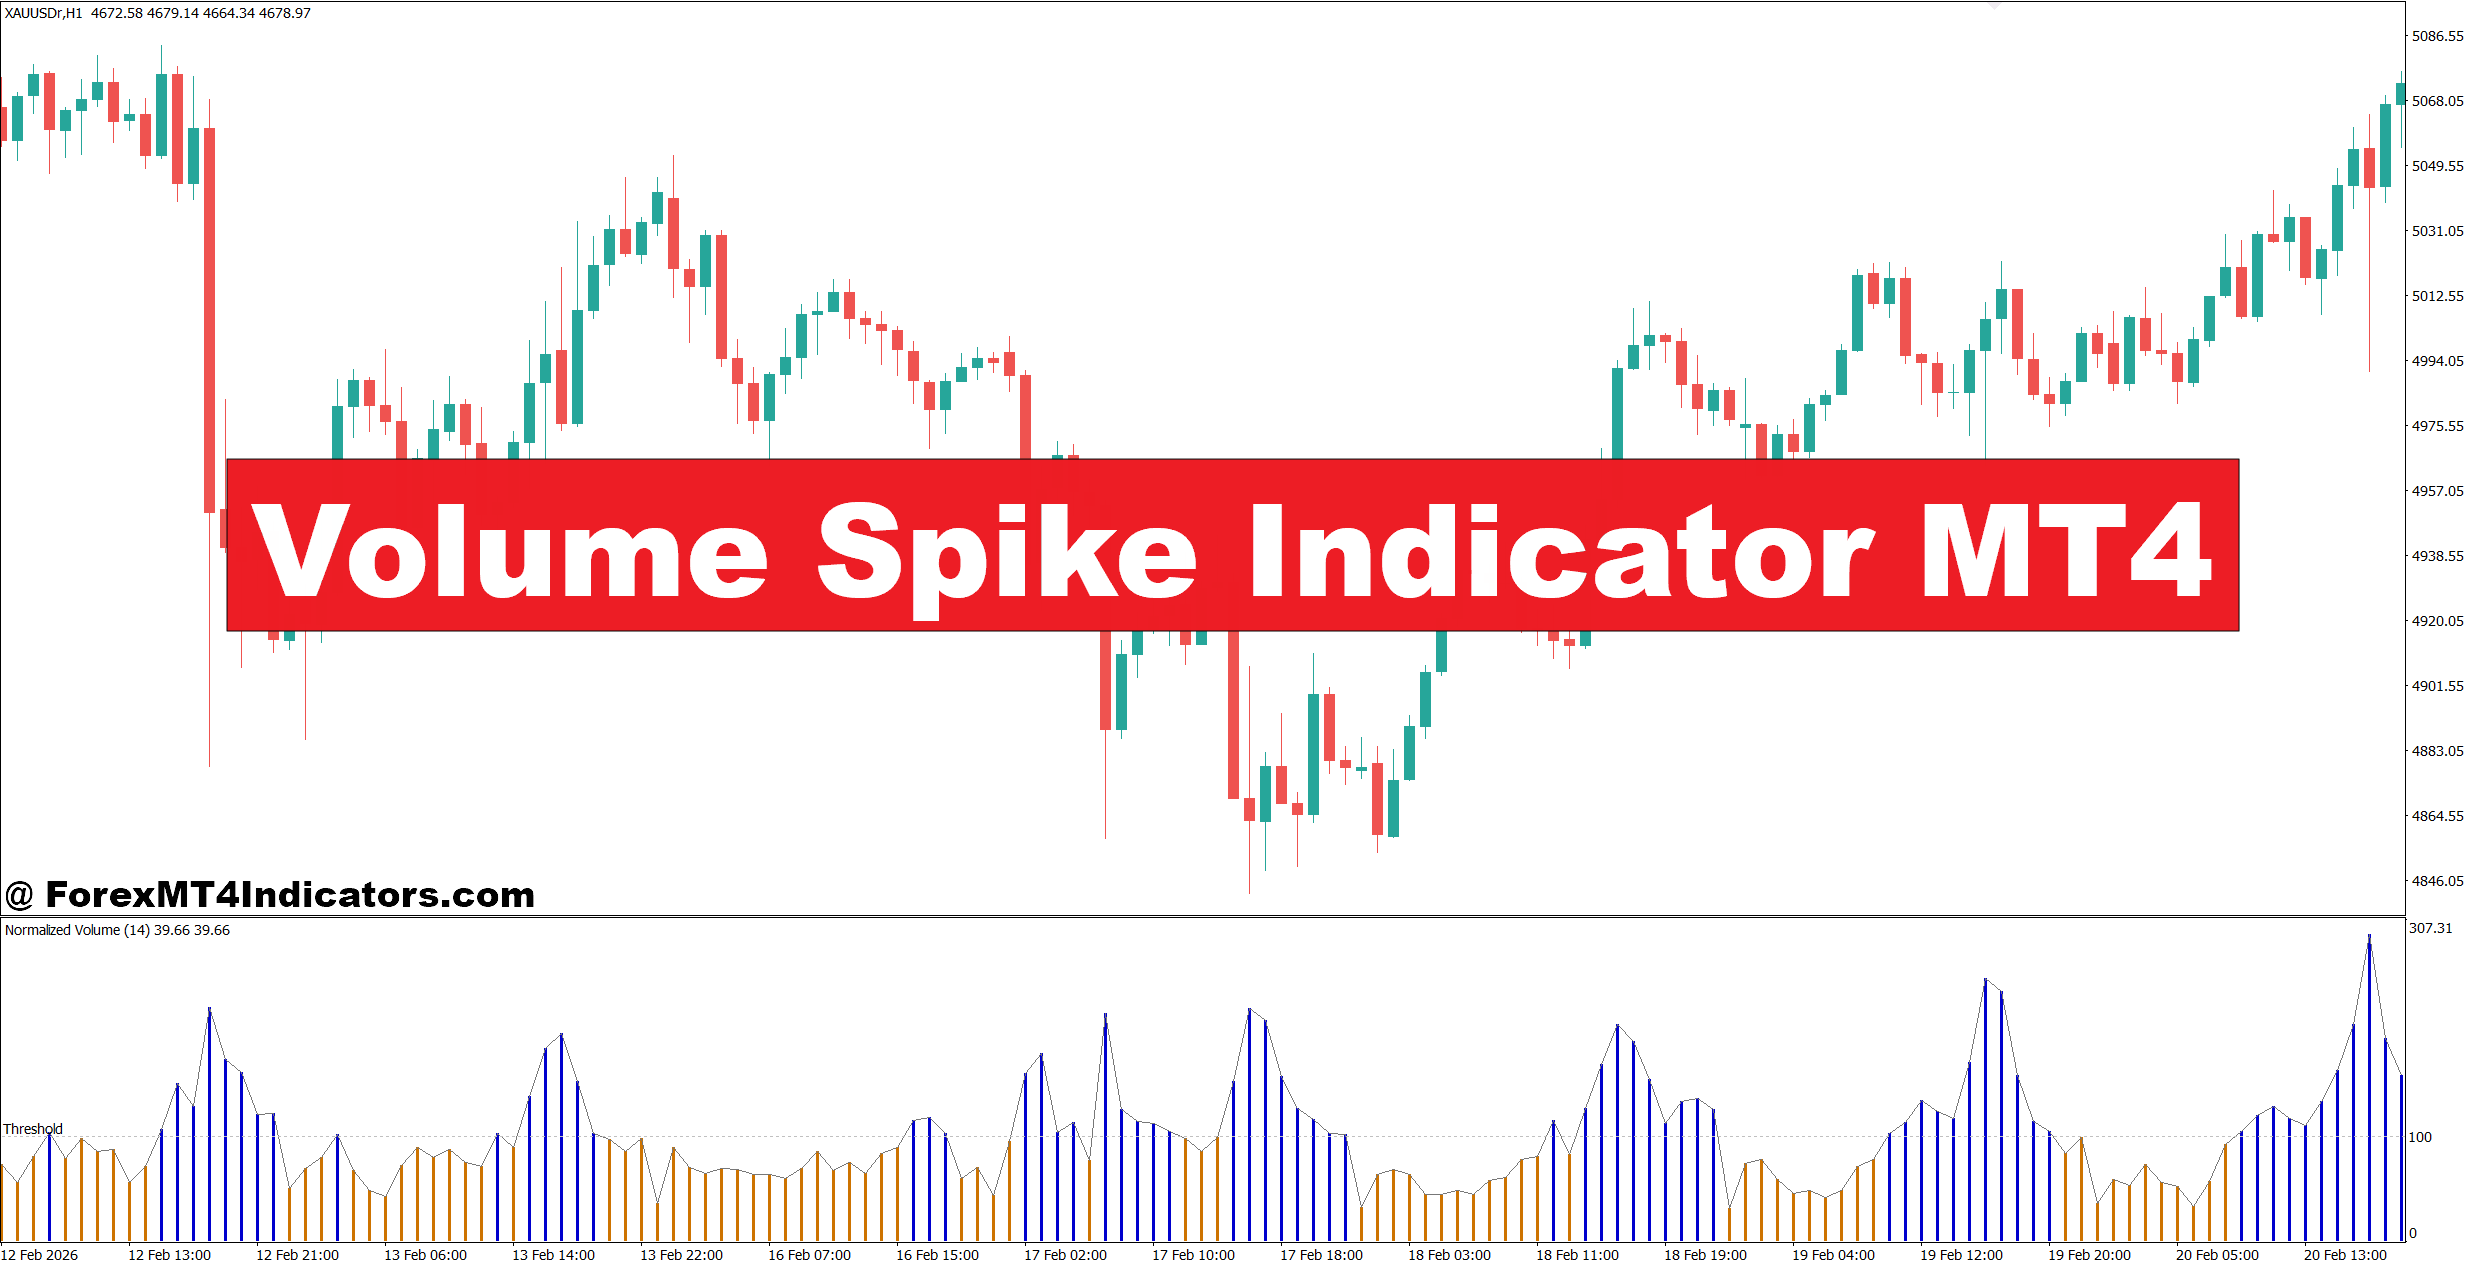
The Volume Spike Indicator MT4 helps solve part of that problem by highlighting unusual increases in market activity. While Forex doesn’t provide centralized exchange volume, MetaTrader 4 uses tick volume, which measures how frequently prices change. Large spikes in tick volume often appear when institutions, news events, or aggressive buyers and sellers enter the market.
During several weeks of testing around major economic releases such as the Non-Farm Payroll report, many traders noticed that volume spikes appeared just before strong momentum candles or sharp reversals. The indicator doesn’t predict direction, but it reveals where the market is suddenly becoming active. That information becomes much more valuable when combined with price action, support and resistance, or trend analysis. Here’s how this indicator works and where it fits into a practical trading plan.
Understanding the Volume Spike Indicator MT4
The Volume Spike Indicator MT4 is a technical analysis tool that detects unusually high trading activity by comparing the current tick volume with previous candles. When volume exceeds a predefined threshold, the indicator marks the chart with a histogram, colored bar, or alert.
Unlike stock markets, Forex volume represents price updates rather than actual contracts traded. Even so, experienced traders often find tick volume surprisingly useful because it closely follows periods of increased participation.
The indicator usually measures volume over a selected lookback period. For example, if the current candle records 350 ticks while the average of the previous 20 candles is only 140 ticks, the indicator identifies that candle as a volume spike.
The spike itself doesn’t generate a buy or sell signal. Instead, it tells traders that something unusual is happening. Price movement still determines the trading decision.
How the Indicator Works in Live Market Conditions
Most versions of this indicator compare current tick volume against a moving average or historical average. When the current value exceeds the chosen multiplier, a spike appears on the chart.
For instance:
- Average tick volume over the last 20 candles: 180
- Current candle volume: 420
- Spike threshold: 200%
Since the current volume is well above normal, the indicator highlights the candle.
This becomes especially useful during London and New York trading sessions when liquidity increases.
A practical example came from EUR/USD on the 1-hour chart. Price spent nearly eight hours moving inside a 35-pip range before breaking above resistance. The breakout candle also produced one of the largest volume spikes of the day. Instead of chasing the move immediately, experienced traders waited for a small pullback toward the breakout level. The second bullish candle confirmed buyers remained in control, leading to a move of roughly 65 pips before slowing near the next resistance zone.
But the opposite can happen too.
On USD/JPY during a low-liquidity Asian session, a sharp volume spike appeared after unexpected news. Price jumped quickly but failed to close above resistance. Within two candles, sellers pushed the pair back inside the range. The spike reflected heavy activity, but not sustained buying pressure.
That is why traders rarely use this indicator alone.
Using Volume Spikes with Price Action
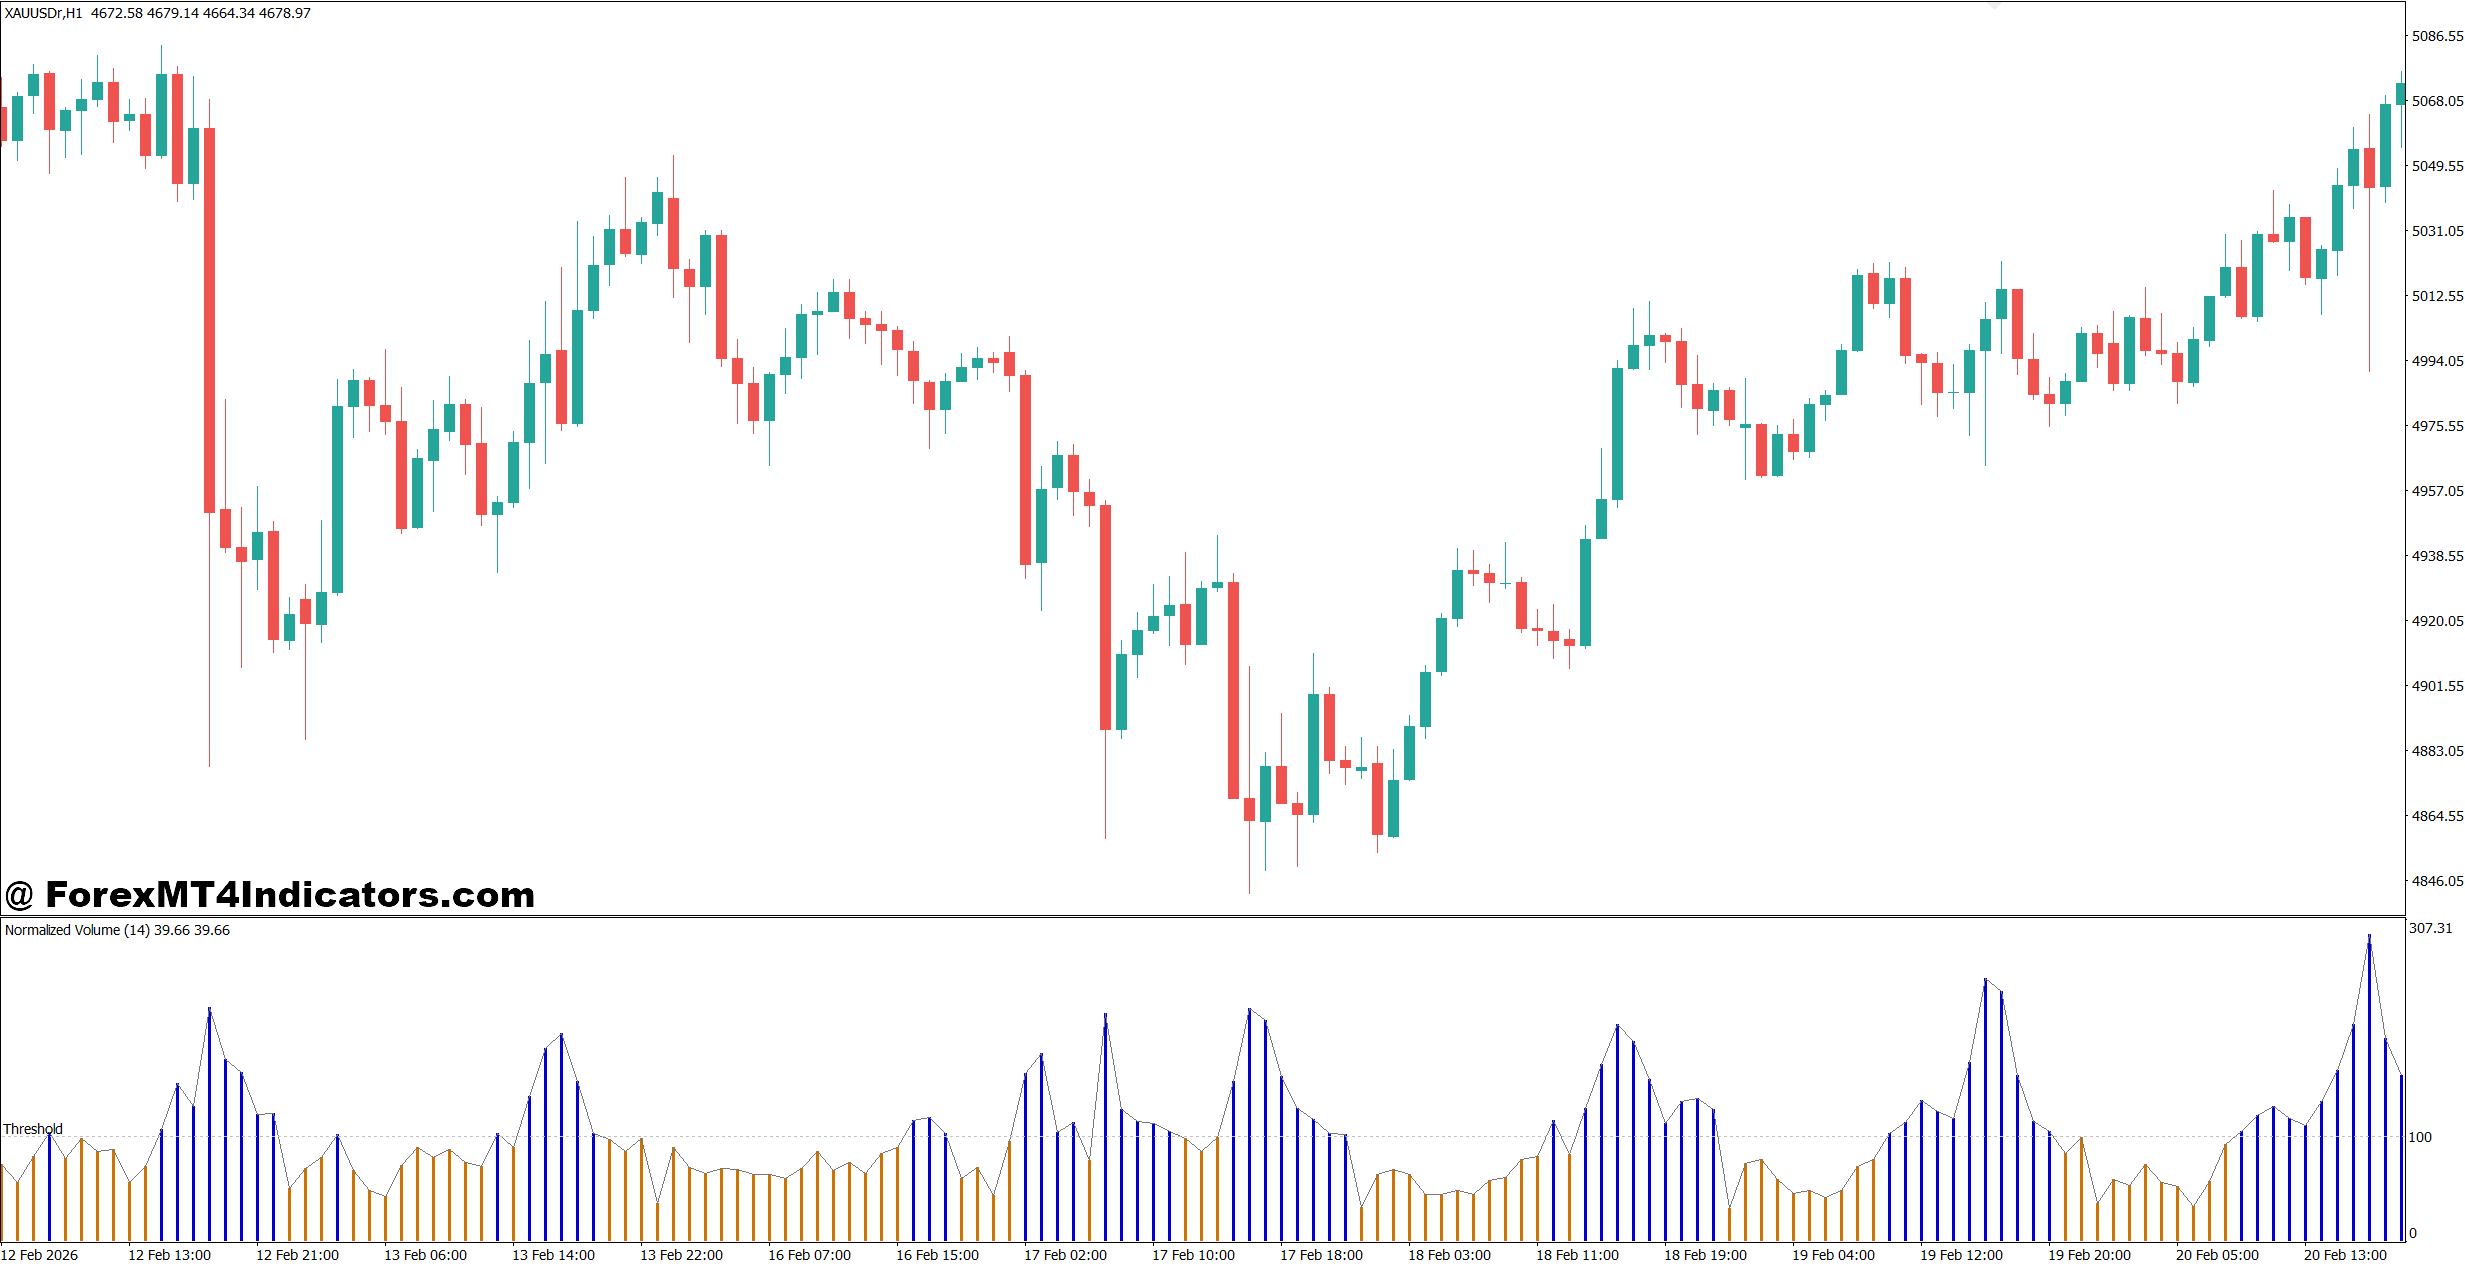
Volume spikes become much more reliable when combined with market structure.
Breakout Confirmation
When price closes above resistance with a strong volume spike, buyers are showing commitment rather than simply pushing price temporarily.
For example:
- Currency pair: GBP/USD
- Timeframe: 4-hour
- Resistance: 1.2850
- Breakout candle: 48 pips
- Volume spike: More than twice the recent average
Instead of buying immediately, many traders wait for price to retest the breakout area before entering.
Reversal Clues
Large volume spikes appearing after an extended trend sometimes signal exhaustion.
A bearish trend on AUD/USD may continue for several days before printing a long lower wick supported by unusually high volume. That combination often shows sellers taking profits while buyers begin entering the market.
The reversal isn’t guaranteed. Traders still need confirmation from the following candles.
News Trading
When testing this indicator on volatile NFP days, volume spikes often appeared during the first few minutes after the announcement. Waiting 10 to 15 minutes before entering helped reduce the number of trades caught in early whipsaws.
Fast markets can produce several spikes within minutes, making patience just as valuable as the indicator itself.
Best Settings and Practical Adjustments
There isn’t a single setting that works for every market condition.
Many traders start with these values:
| Trading Style | Timeframe | Suggested Lookback |
|---|---|---|
| Scalping | M5-M15 | 10-15 candles |
| Intraday | M30-H1 | 20 candles |
| Swing Trading | H4-Daily | 30-50 candles |
Higher thresholds reduce false alerts but may miss smaller opportunities. Lower thresholds identify more activity, although they also generate extra noise during choppy sessions.
The indicator tends to perform best during active market hours, especially London and New York overlaps, where liquidity supports stronger price movement.
Some traders pair it with:
- 20-period EMA for trend direction
- RSI (14) for momentum confirmation
- Support and resistance zones
- Supply and demand areas
- Break-and-retest strategies
Combining several factors usually produces higher-quality trade setups than relying on volume alone.
Strengths, Weaknesses, and Comparison with Similar Indicators
The biggest advantage of the Volume Spike Indicator MT4 is its ability to highlight moments when market participation suddenly increases. That helps traders focus on important candles instead of watching every small price movement.
Another benefit is its flexibility. The indicator works across multiple currency pairs, commodities, and even indices available through MT4 brokers.
Still, it has limits.
Since Forex relies on tick volume rather than centralized exchange volume, the readings vary slightly between brokers. Traders should also remember that high volume doesn’t reveal whether buyers or sellers control the move. It simply confirms increased activity.
Compared with the On Balance Volume (OBV) indicator, the Volume Spike Indicator reacts much faster to sudden changes. OBV tracks longer-term accumulation and distribution, while volume spikes concentrate on immediate market activity.
Compared with Volume Profile, the Volume Spike Indicator is much simpler. Volume Profile identifies price levels where heavy trading occurred over time, whereas this indicator focuses on individual candles experiencing exceptional activity.
Trading forex carries substantial risk. No indicator guarantees profits. Position sizing, stop-loss placement, and disciplined risk management remain essential regardless of the trading tool being used.
How to Trade with Volume Spike Indicator MT4
Buy Entry
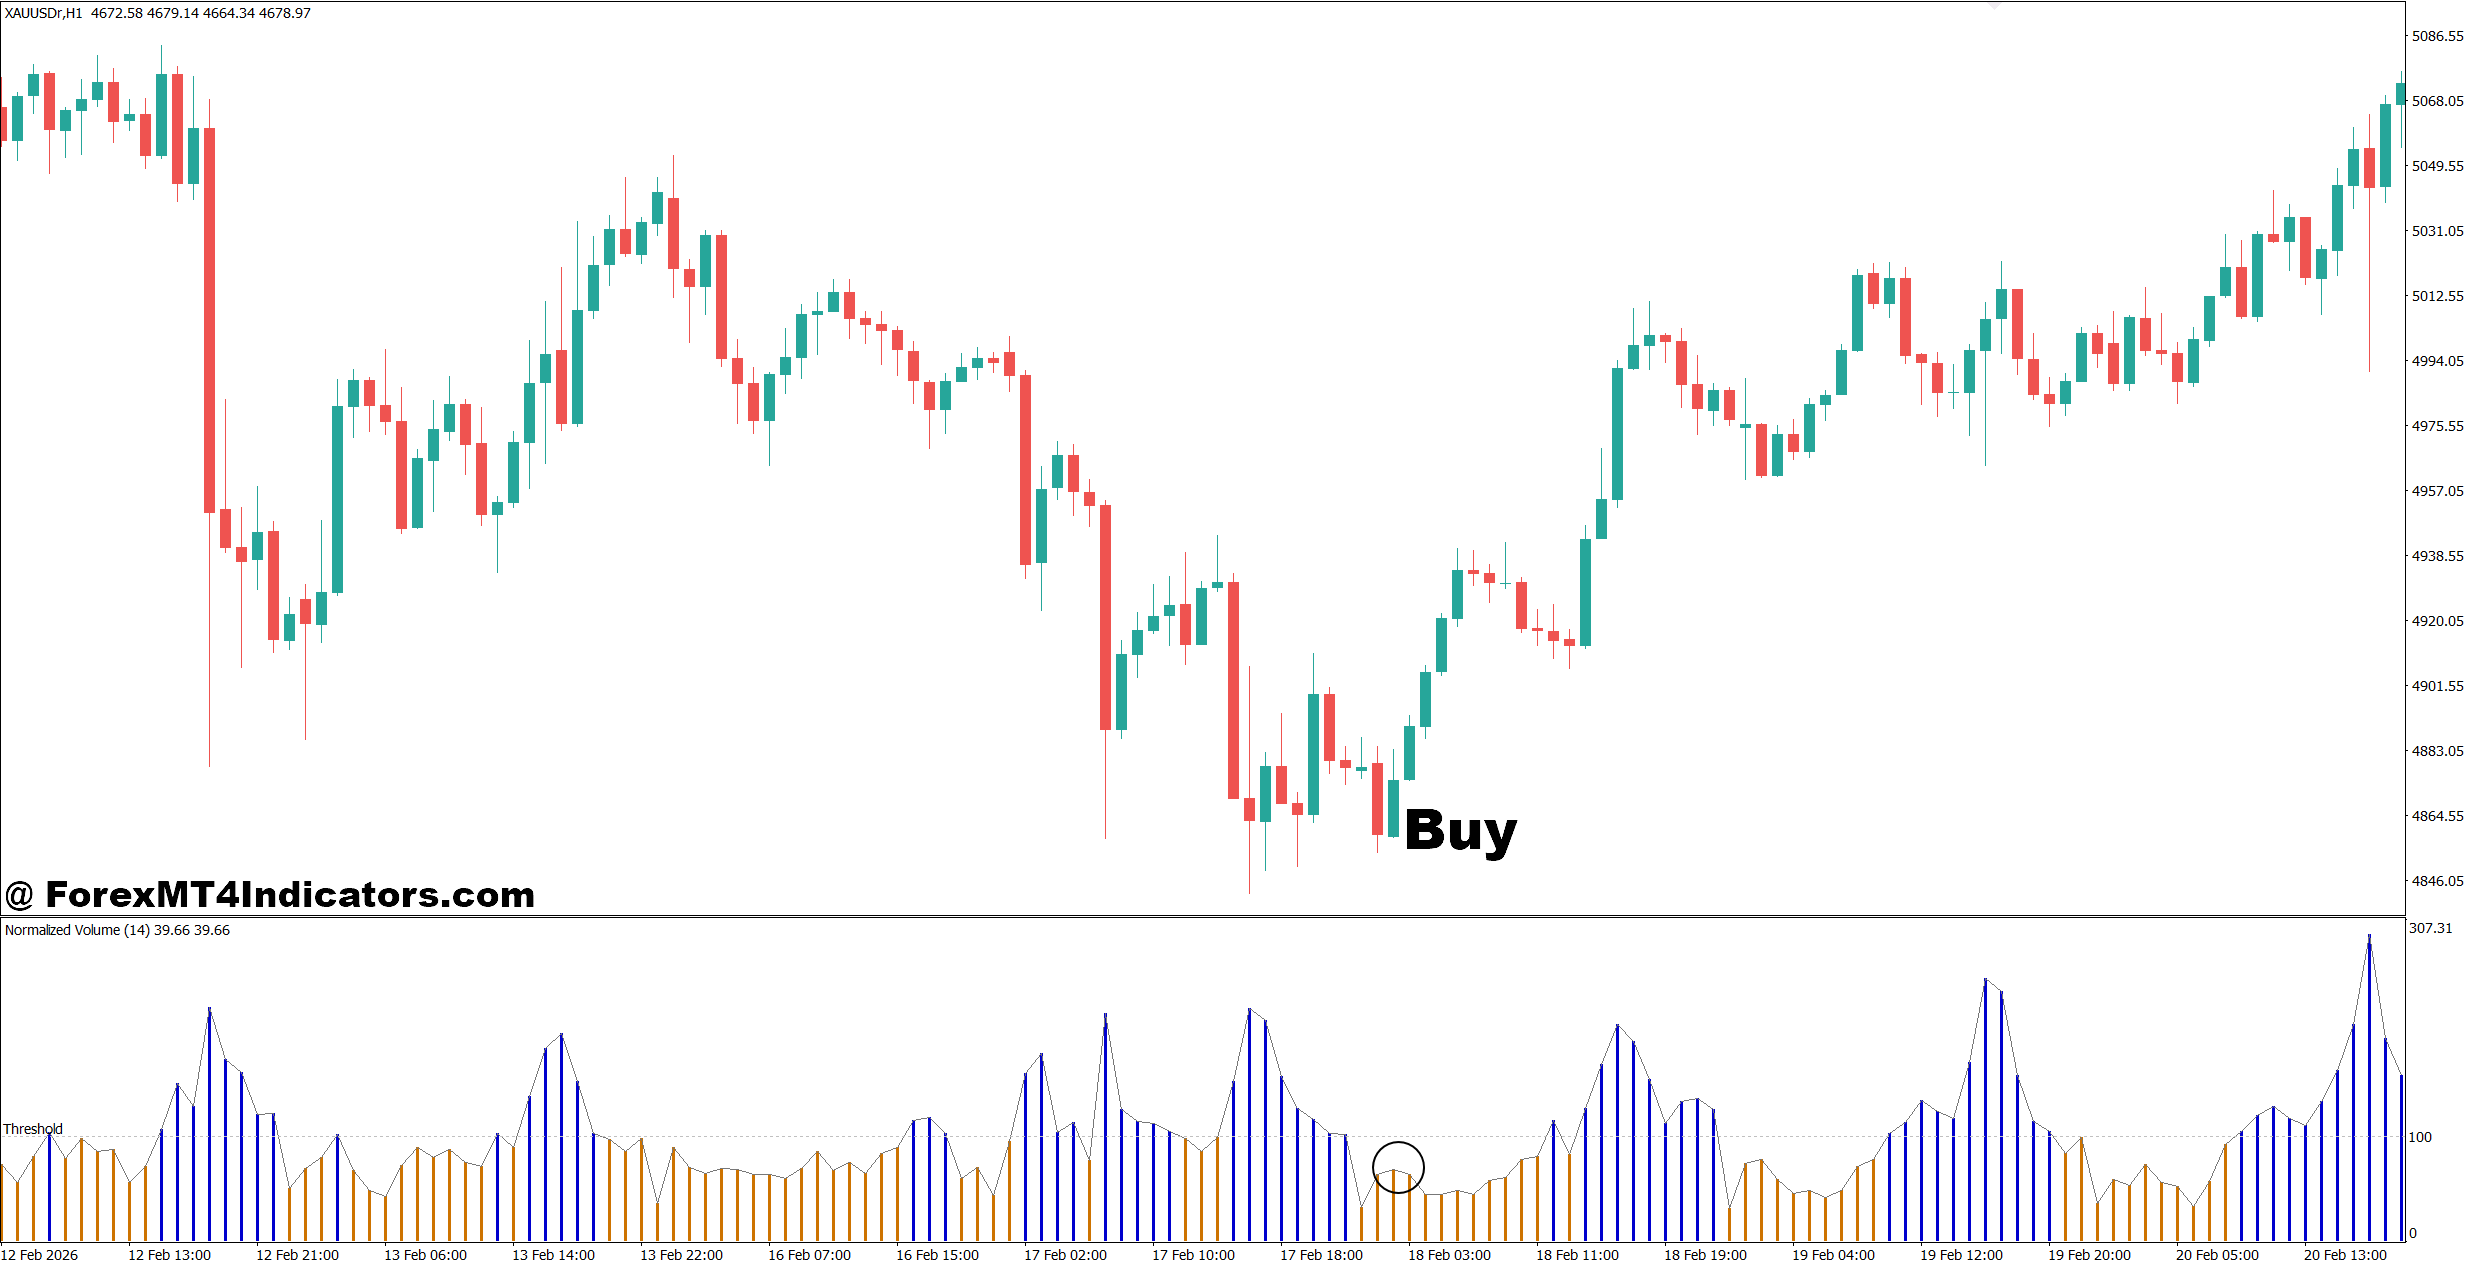
- Buy after a bullish volume spike – Enter when a bullish candle closes with a volume spike on the 1-hour EUR/USD chart. Target 30-50 pips with a 20-pip stop-loss.
- Wait for breakout confirmation – Buy only if price closes 10-15 pips above resistance with strong volume on the 4-hour GBP/USD chart.
- Enter on the retest – After a volume-spike breakout, buy the first successful retest of support for a safer entry.
- Trade with the trend – Take buy signals only when price stays above the 50 EMA on the 1-hour or 4-hour timeframe.
- Confirm with RSI – Buy when RSI is above 55 and a volume spike confirms increasing buying pressure.
- Avoid low-volume sessions – Skip buy trades during the quiet Asian session unless major news drives volatility.
- Risk only 1-2% per trade – Keep position size small even when the volume spike looks strong.
- Secure profits early – Move the stop-loss to breakeven after 20-25 pips in profit to reduce risk.
Sell Entry
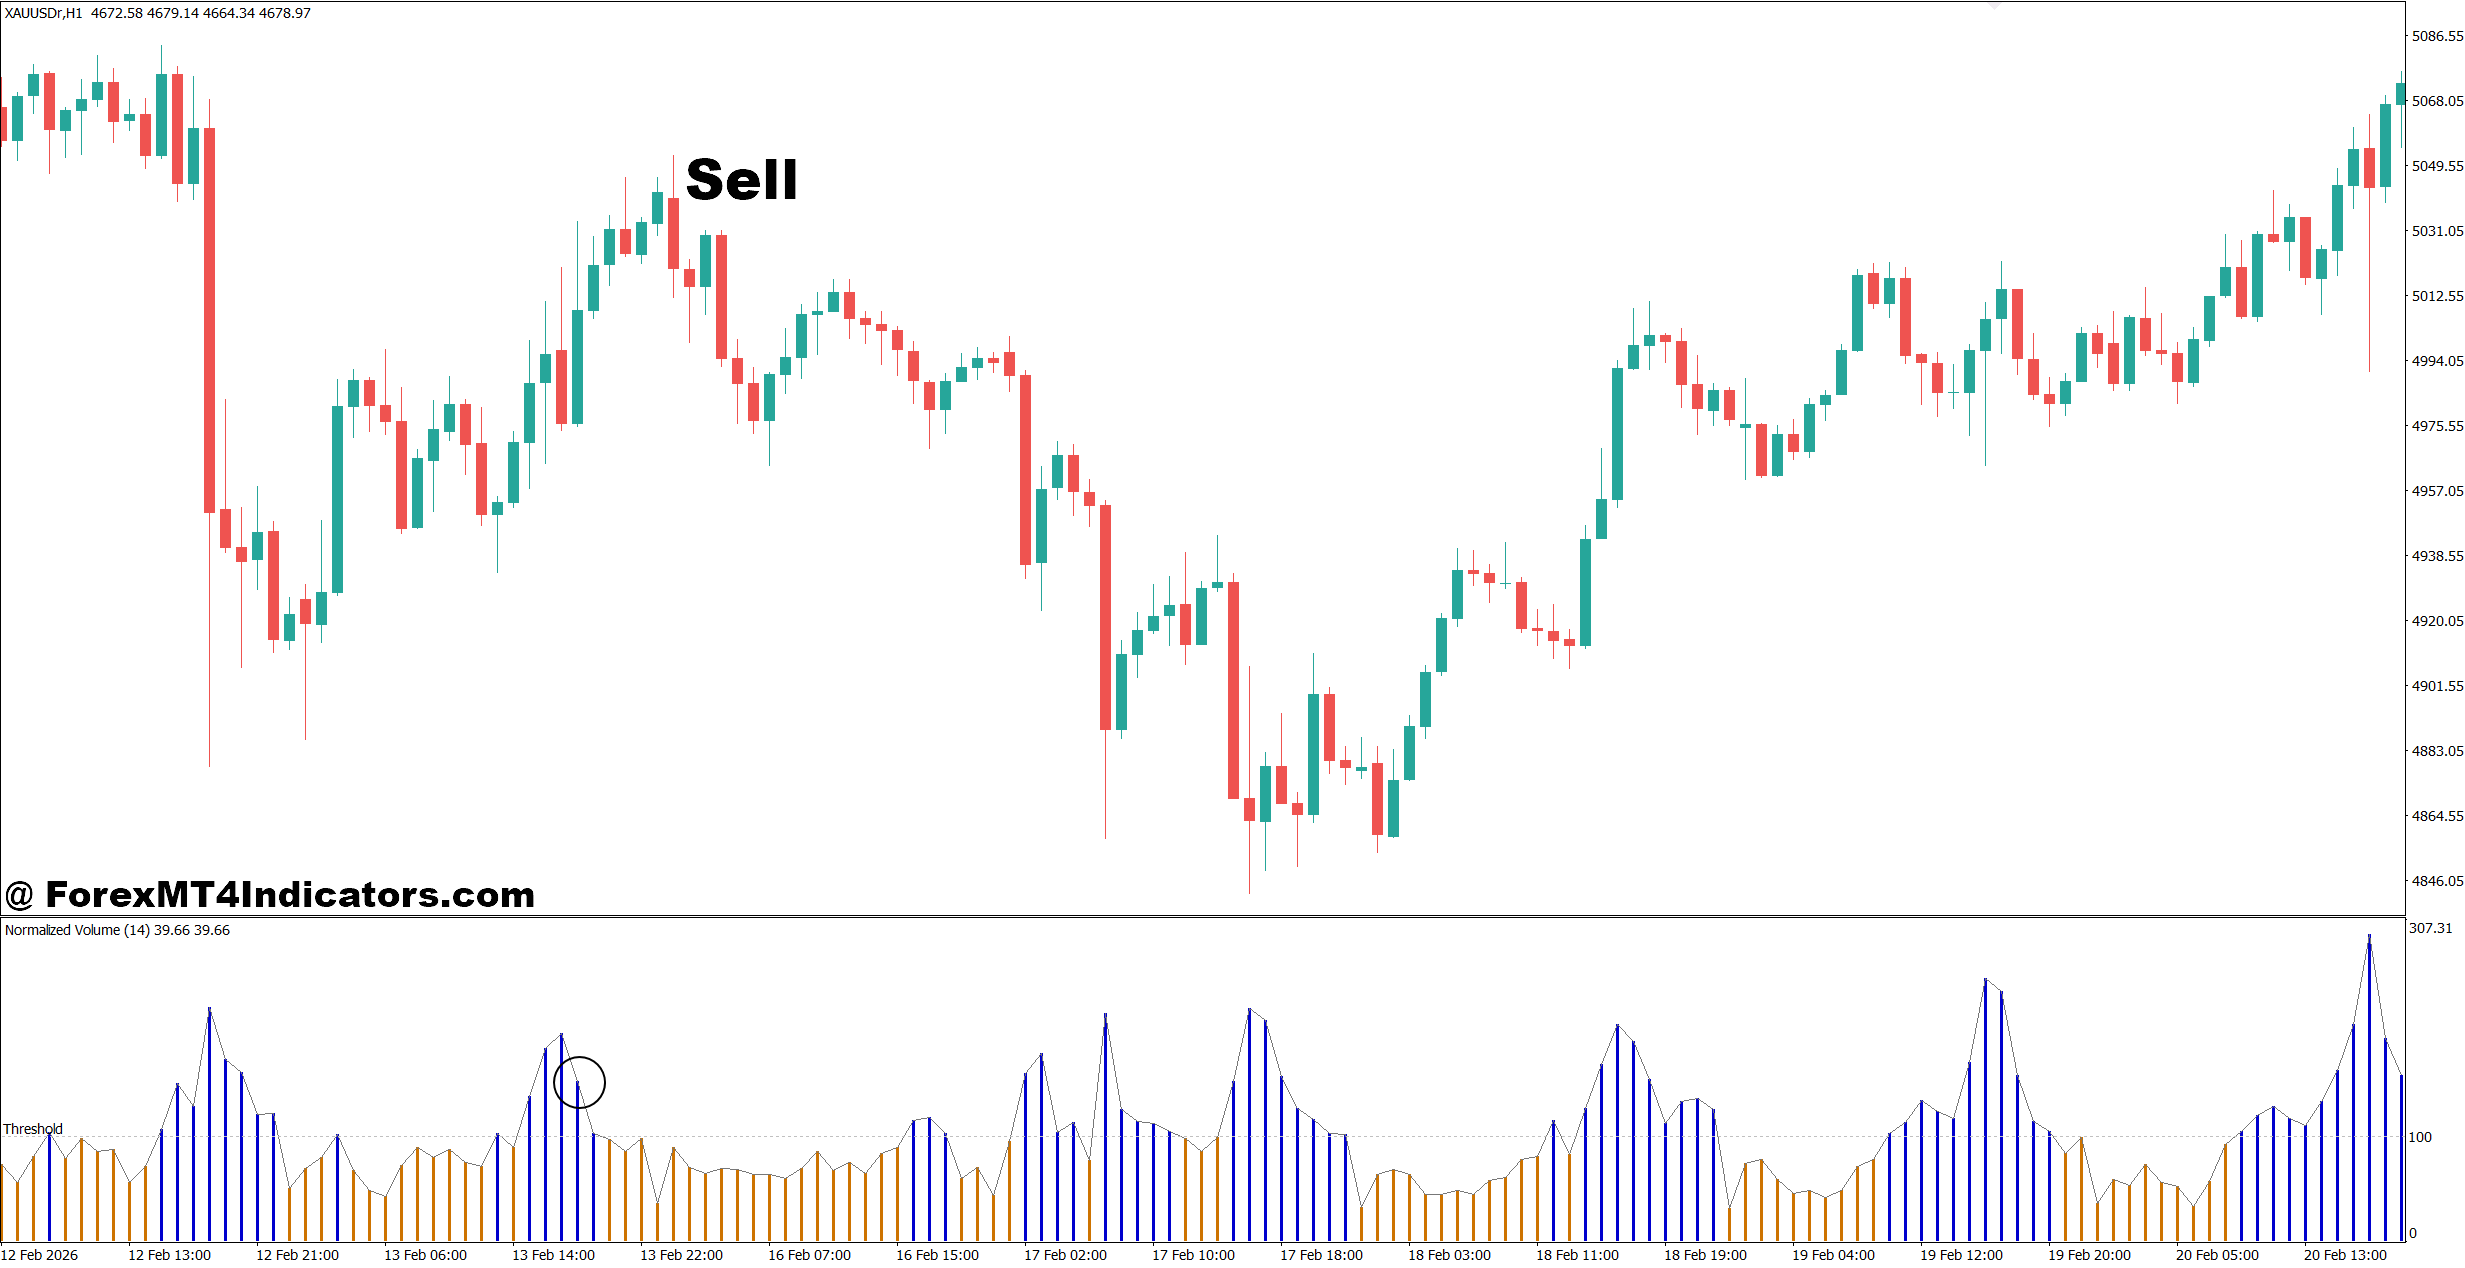
- Sell after a bearish volume spike – Enter when a bearish candle closes with a volume spike on the 1-hour EUR/USD chart. Aim for 30-50 pips with a 20-pip stop-loss.
- Confirm resistance rejection – Sell only if a strong volume spike forms below resistance on the 4-hour GBP/USD chart.
- Wait for the pullback – Enter after price retests the broken resistance as new resistance before selling.
- Trade below the 50 EMA – Take sell setups only when the overall trend remains bearish on the 1-hour or daily chart.
- Use RSI confirmation – Sell when RSI falls below 45 and volume increases with bearish momentum.
- Avoid trading before major news – Skip sell entries 15-30 minutes before high-impact events like NFP or CPI.
- Limit risk to 1-2% – Never increase lot size because of one strong volume spike.
- Exit near support – Take profits before major support levels instead of expecting every trend to continue.
Final Thoughts on the Volume Spike Indicator MT4
The Volume Spike Indicator MT4 gives traders another way to understand what is happening behind price movement. It highlights periods of unusually high activity, helps confirm breakouts, supports reversal analysis, and works well alongside price action rather than replacing it. Many traders find it most effective during active trading sessions and major economic events, while also recognizing that tick volume has its limitations. The best results usually come from combining volume spikes with trend direction, support and resistance, and solid risk management. Instead of treating every spike as a trading signal, traders should view it as a clue that deserves closer attention before making a decision.
Level up your trading
Learn to read the chart — not just the indicator
eBook · Instant PDF
Video Course · 12 modules
Recommended MT4/MT5 Brokers
- ✓ *FREE *$50 to start (withdrawable)
- ✓ Deposit bonus up to $5,000
- ✓ Negative balance protection
Trading forex and CFDs carries a significant risk of loss and is not suitable for everyone. Broker links are affiliate links — we may earn a commission at no cost to you.
Free MT4 Indicator Download

Enter Your Email Address below, download link will be sent to you.