

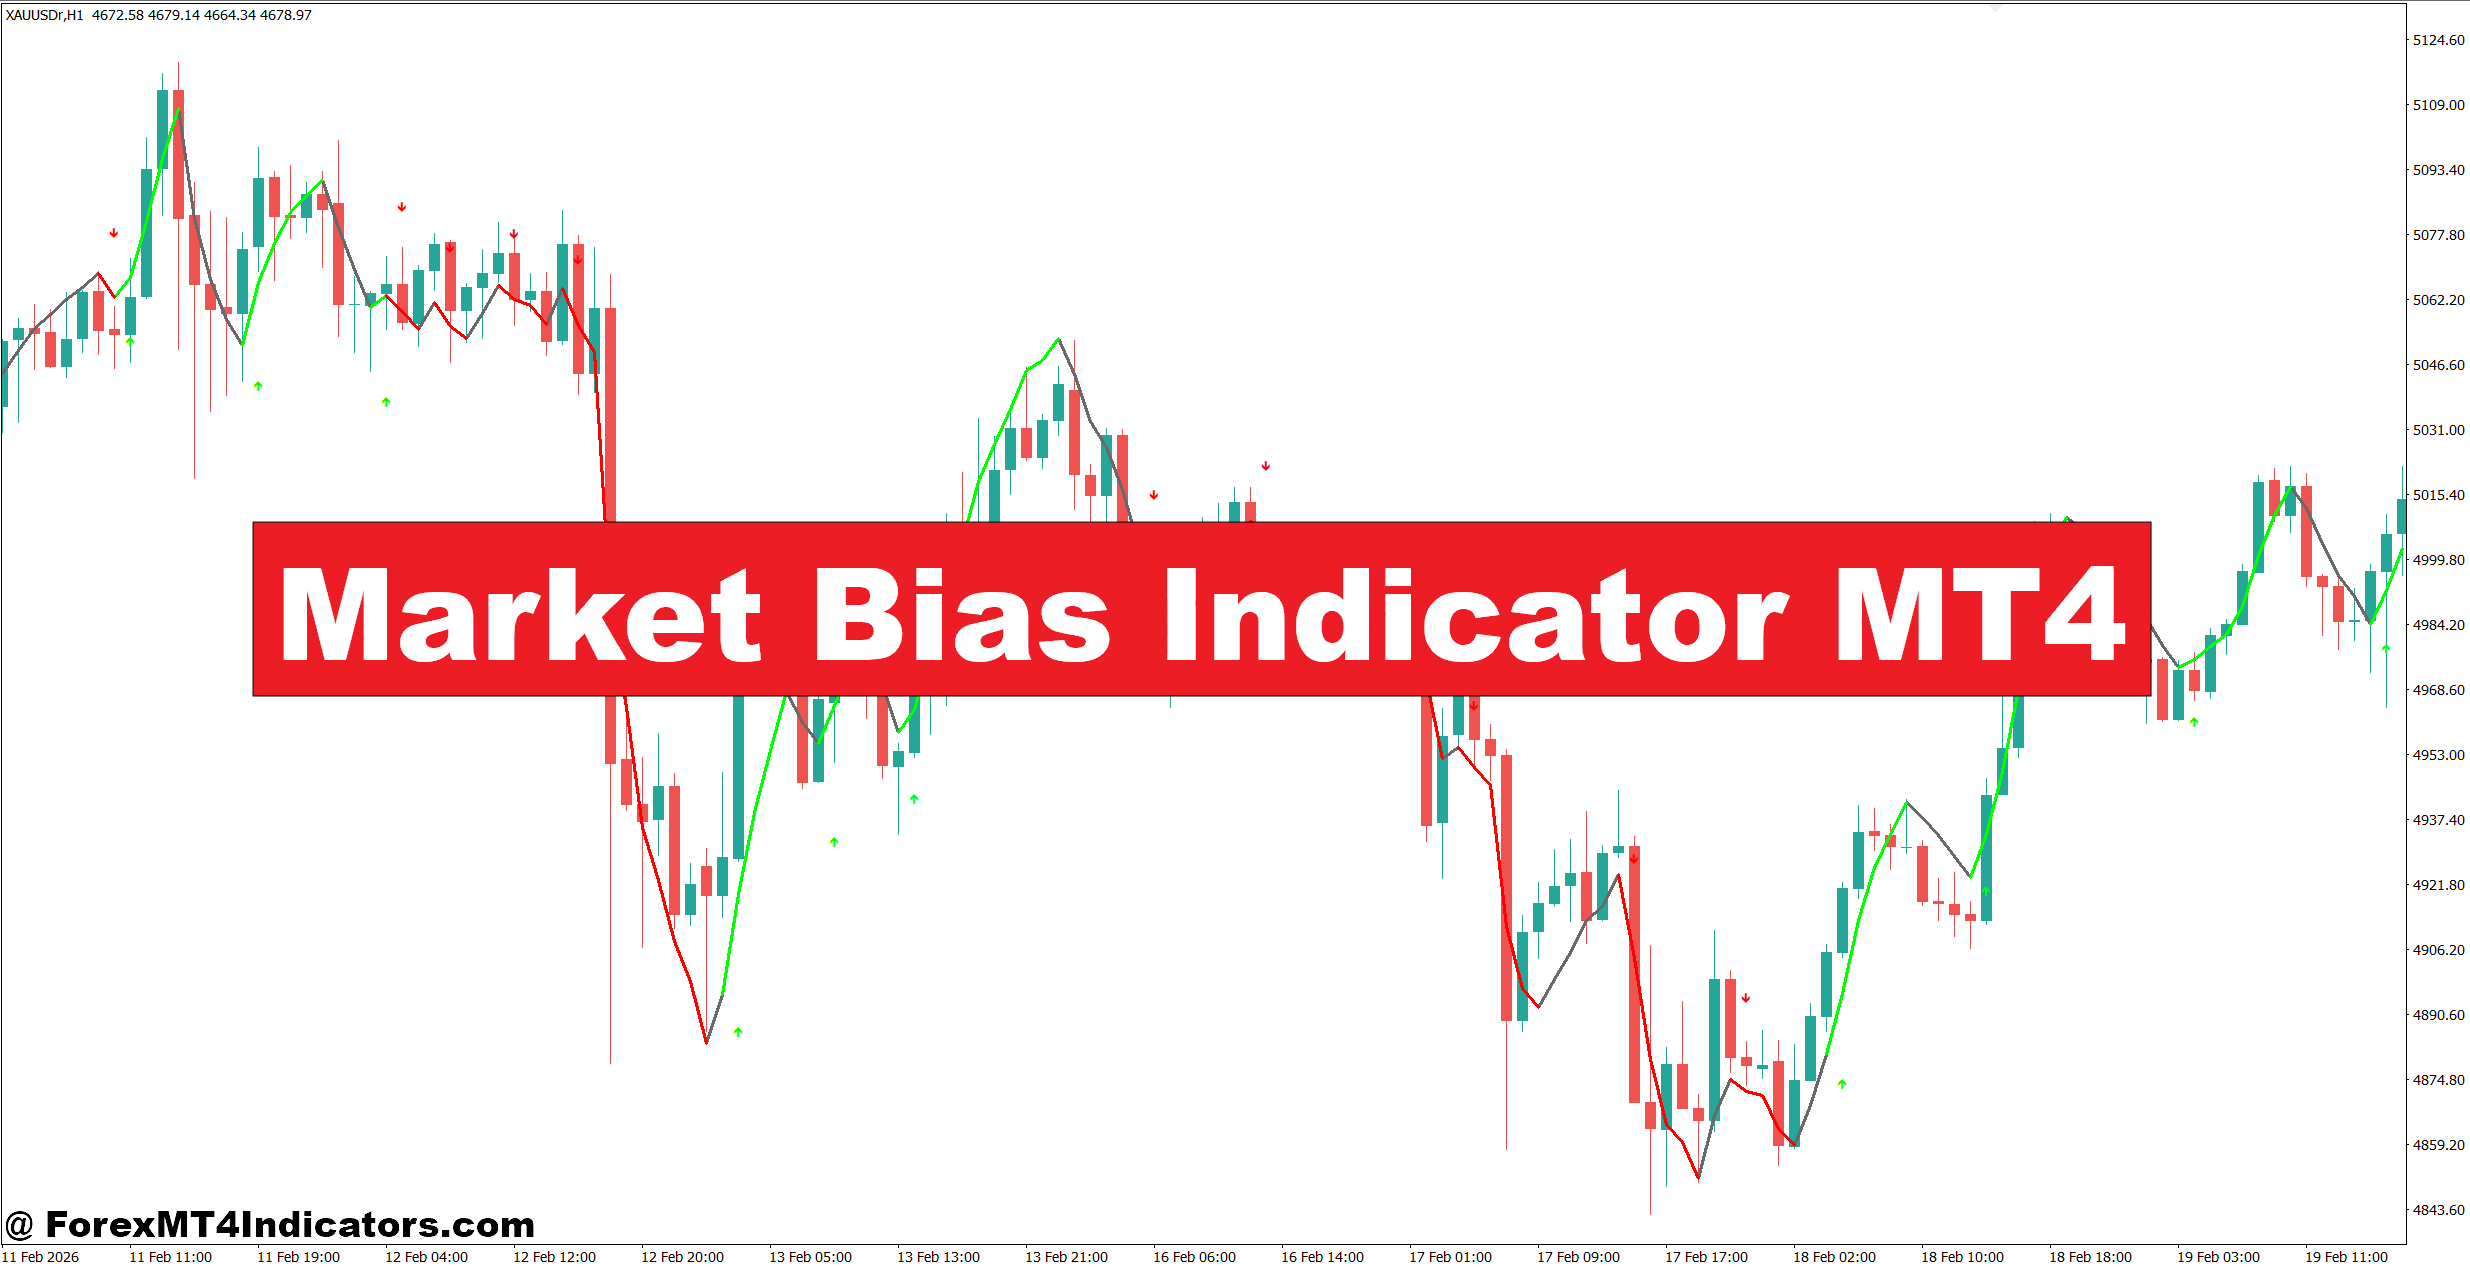
The Market Bias Indicator MT4 helps reduce that problem by showing the dominant direction before a trader commits to an entry. Instead of reacting to every small price movement, traders can focus on setups that match the overall trend. That simple shift often filters out many low-quality trades and improves decision-making.
No indicator can predict every move, but using market bias as a filter gives traders another layer of confirmation. The sections below explain how this indicator works, where it performs best, and how traders can fit it into a disciplined trading plan.
What Is the Market Bias Indicator MT4?
The Market Bias Indicator MT4 is a trend-filtering tool designed to identify whether buyers or sellers currently control the market. Rather than generating constant buy and sell arrows, it measures the overall directional strength and presents a bullish, bearish, or neutral market condition.
Most versions calculate bias by combining moving average direction, price momentum, candle positioning, or volatility measurements. Some advanced versions also include trend strength filters that ignore weak price movements during sideways markets.
Instead of chasing every signal, traders use the indicator as a guide.
For example:
- Bullish bias means traders look mainly for buying opportunities.
- Bearish bias suggests focusing on selling setups.
- Neutral bias signals caution because price lacks a clear direction.
This approach works well because many professional traders first determine market direction before searching for trade entries.
How the Indicator Calculates Market Bias
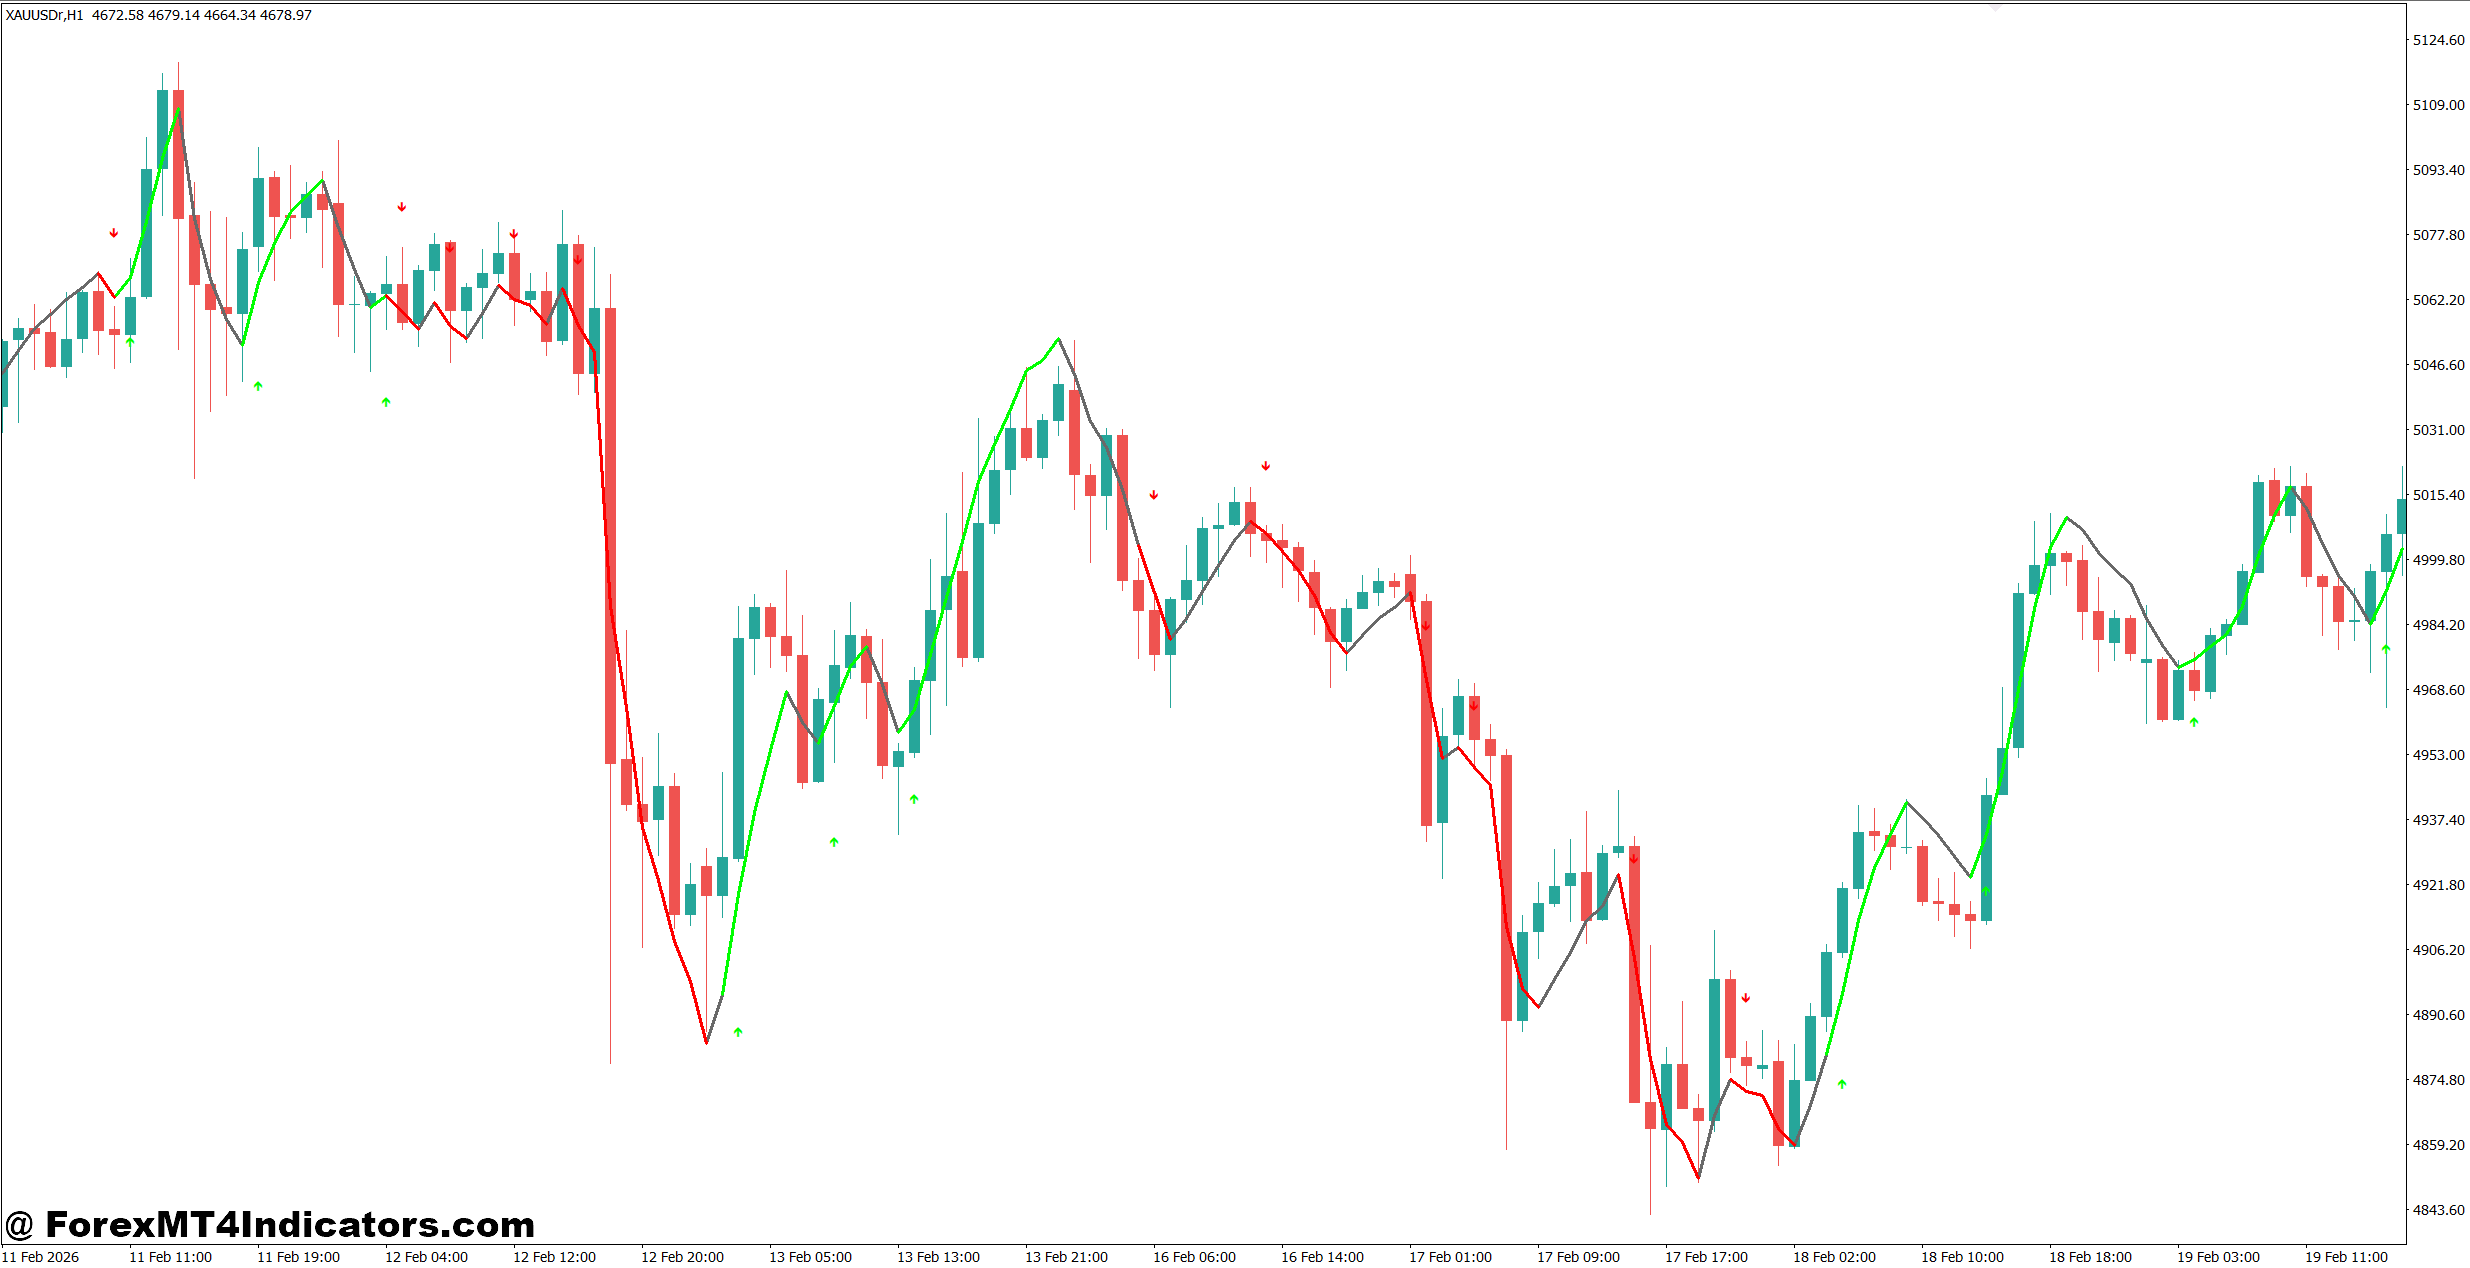
Although different developers use different formulas, the basic logic remains similar.
The indicator compares recent price movement with historical price action. It analyzes factors such as:
- Trend direction using moving averages
- Higher highs and higher lows
- Lower highs and lower lows
- Momentum strength
- Average price over a selected lookback period
Suppose EUR/USD is trading above its 50-period moving average on the 1-hour chart while momentum continues making higher highs. The indicator will likely display a bullish market bias.
Now imagine GBP/USD falls below both the 50-period and 200-period moving averages while momentum weakens. The indicator shifts to a bearish reading because sellers control the market.
Here’s the thing: market bias doesn’t tell traders the exact candle to enter. Instead, it answers an even more important question first.
Which side of the market deserves attention today?
That single filter often eliminates many fake-outs during choppy sessions.
Using the Market Bias Indicator in Real Trading
The indicator becomes much more valuable when combined with price action instead of being used alone.
A trader watching EUR/USD on the 1-hour timeframe notices the Market Bias Indicator remains bullish throughout the London session. Price pulls back toward a previous support zone around 1.1280 before printing a bullish engulfing candle.
Instead of buying randomly, the trader waits for:
- Bullish market bias
- Support holding
- Bullish confirmation candle
- Stop-loss placed 20-25 pips below support
- Target set near the next resistance, around 45-60 pips away
This creates nearly a 1:2 risk-to-reward ratio.
Another example involves USD/JPY during the New York session. The Market Bias Indicator turns bearish while price breaks below a major support level. Rather than entering immediately, the trader waits for a retest of the broken support before opening a short position. That patience often avoids entering during temporary spikes.
When testing this approach during volatile Non-Farm Payroll (NFP) releases, many traders notice that waiting 15-30 minutes after the news helps reduce false signals. Price often changes direction several times immediately after the announcement before settling into a clearer trend.
Trading forex carries substantial risk. No indicator guarantees profits.
Best Settings and Customization
Default settings usually perform well, but traders often adjust them based on their trading style.
Scalping
- Timeframe: M5 or M15
- Faster moving average periods
- Combine with volume or session indicators
- Target 10-20 pip moves
Scalpers should remember that lower timeframes naturally produce more market noise and occasional whipsaws.
Intraday Trading
- Timeframe: M30 or H1
- Standard indicator settings
- Confirm trades with support and resistance
- Typical stop-loss: 20-35 pips
This setup works well on pairs like EUR/USD, GBP/USD, and USD/CAD during active market sessions.
Swing Trading
- Timeframe: H4 or Daily
- Longer averaging periods
- Focus on major trend direction
- Stop-loss: 60-120 pips depending on volatility
Longer timeframes usually provide stronger trend confirmation because short-term fluctuations have less influence on the calculation.
Strengths, Weaknesses, and Comparison With Other Trend Indicators
The biggest advantage of the Market Bias Indicator MT4 is its ability to simplify market direction. Traders spend less time guessing whether they should buy or sell.
Another benefit is emotional control. Instead of reacting to every candle, they follow the dominant trend and wait for quality setups.
Still, the indicator has limitations.
During sideways markets, bias may change repeatedly as price moves within a narrow range. Those frequent shifts can produce unnecessary trades if traders ignore market structure.
It also reacts after price begins moving because it relies on historical data. That’s common with nearly every trend-following indicator.
Compared with a standard Moving Average, the Market Bias Indicator provides more context because it considers multiple market conditions instead of only price averages.
Compared with the Average Directional Index (ADX), it focuses more on trend direction rather than simply measuring trend strength.
Compared with MACD, the Market Bias Indicator is generally easier to interpret for traders who prefer visual trend confirmation over histogram analysis.
Many experienced traders combine all three tools. They first identify market bias, then confirm trend strength with ADX, and finally use price action for precise entries.
That combination often produces cleaner trading decisions than relying on a single indicator alone.
How to Trade with Market Bias Indicator MT4
Buy Entry
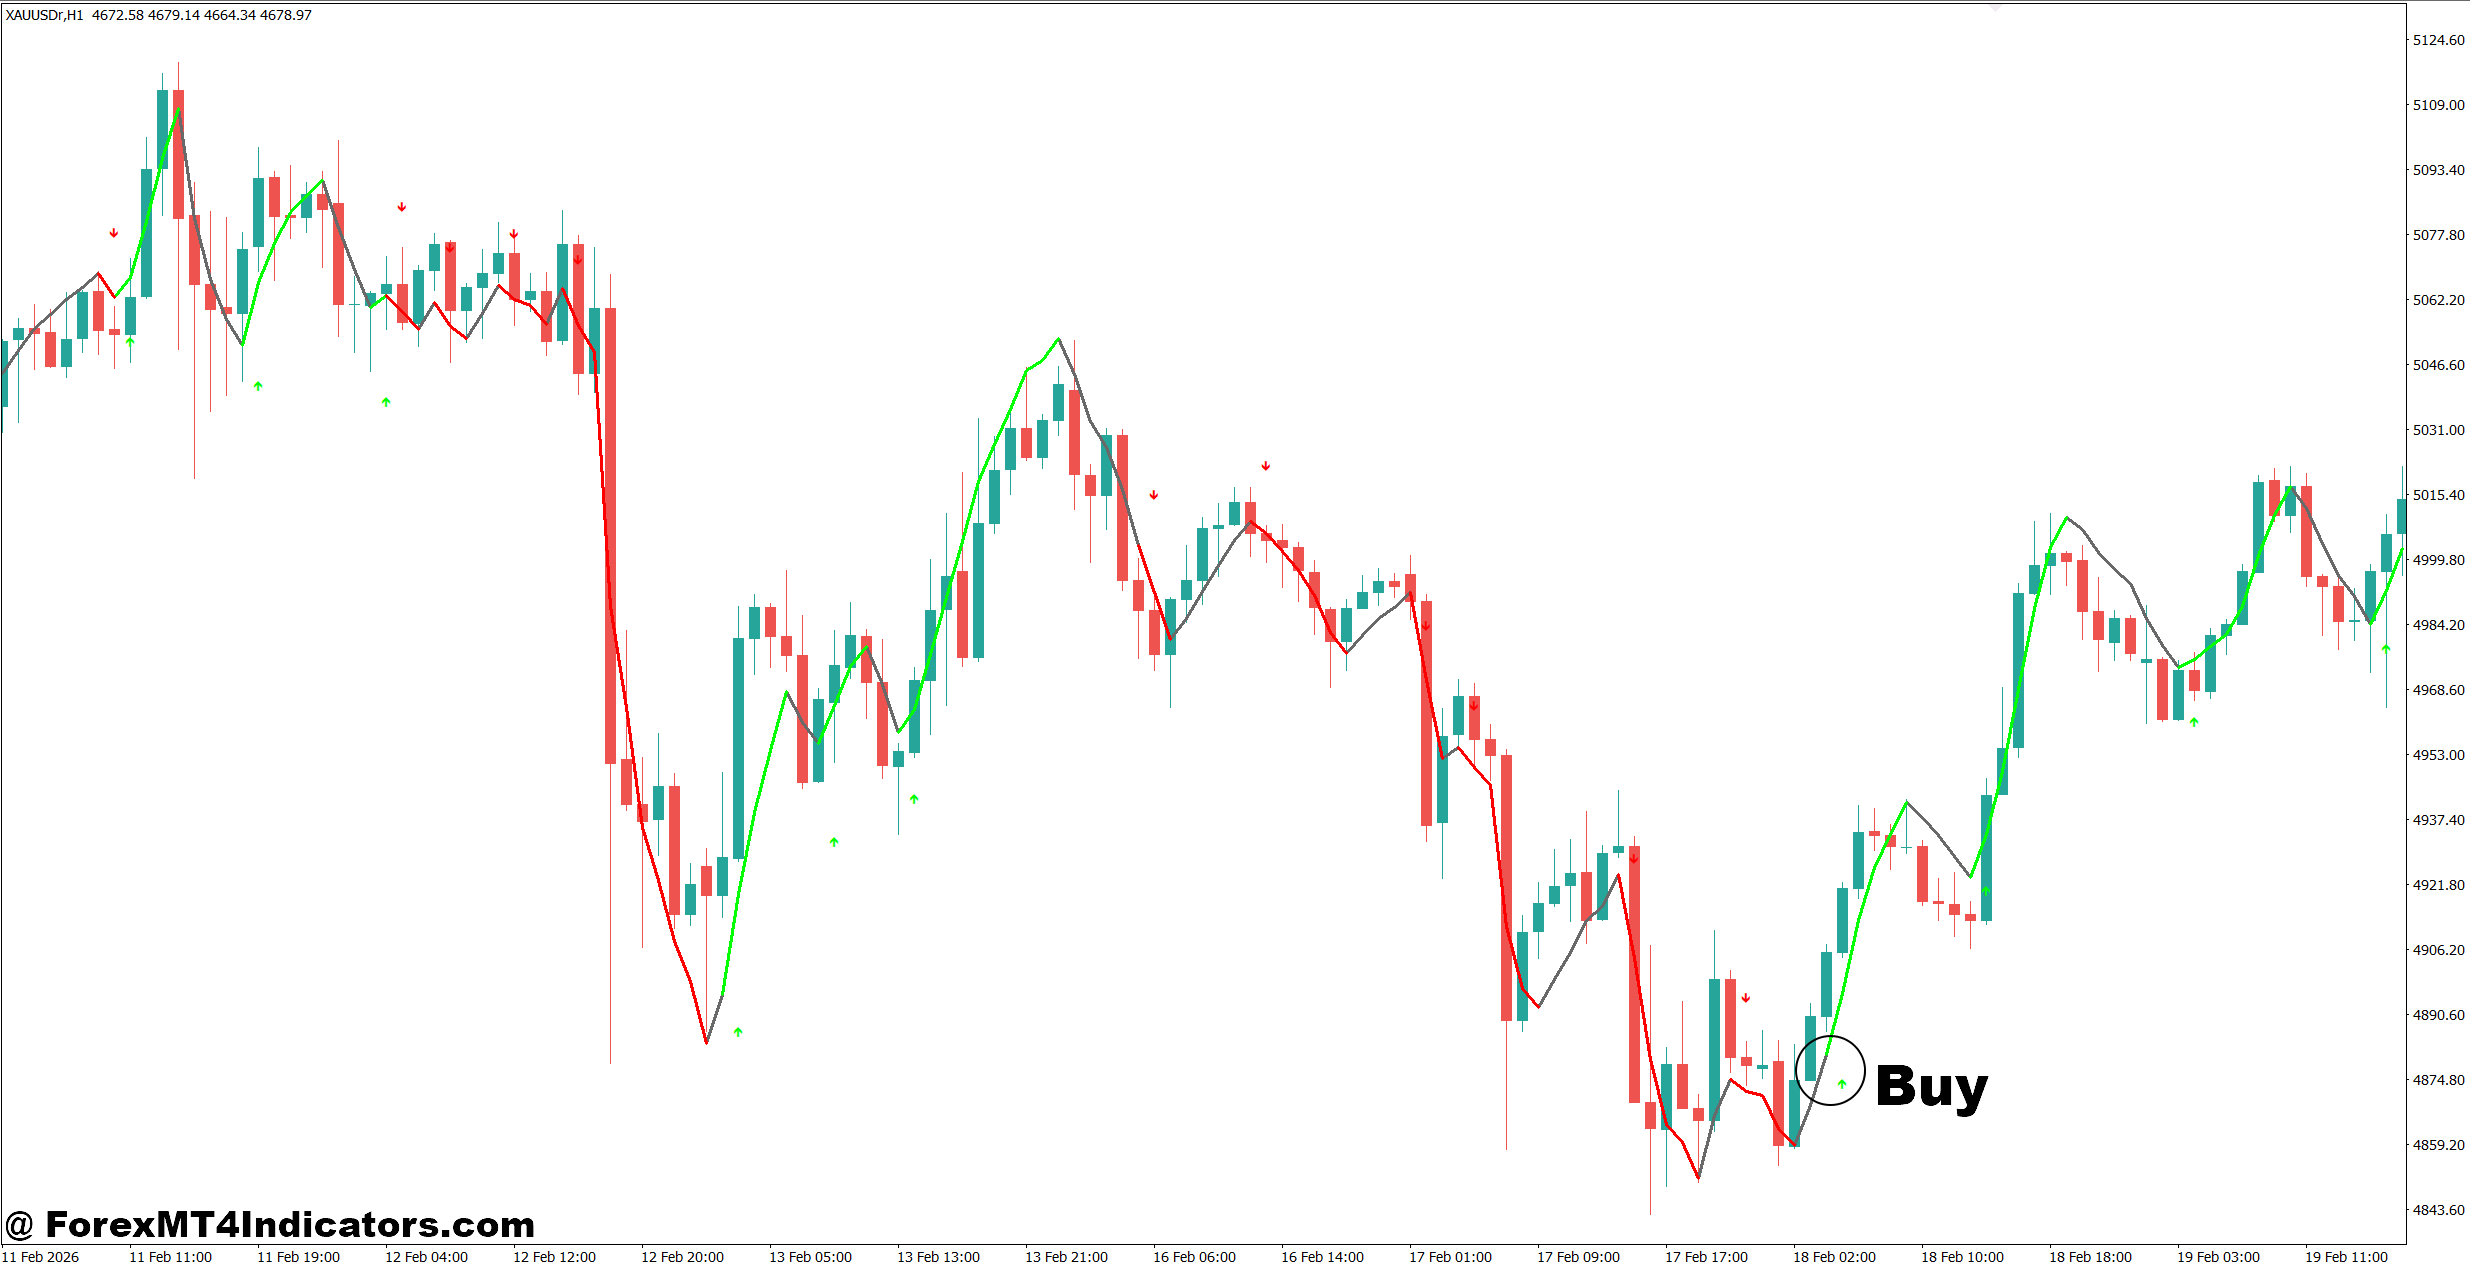
- Confirm bullish market bias – Enter only when the indicator turns bullish on the 1-hour chart and price stays above the recent swing high.
- Wait for a pullback – Buy after a retracement to support on EUR/USD with a 20-30 pip stop-loss below the swing low.
- Trade with higher timeframe – Confirm the 4-hour trend is bullish before taking a buy on the 1-hour chart.
- Use bullish candle confirmation – Enter after a bullish engulfing or pin bar forms with the bias still pointing up.
- Target a 1:2 risk-reward – Risk 25 pips to aim for at least 50 pips of profit whenever possible.
- Avoid major news events – Skip buy signals 15-30 minutes before high-impact news like NFP or CPI releases.
- Manage trade risk – Risk no more than 1-2% of account balance on a single position.
- Trail profits in strong trends – Move the stop-loss to breakeven after gaining 25-30 pips on GBP/USD.
Sell Entry
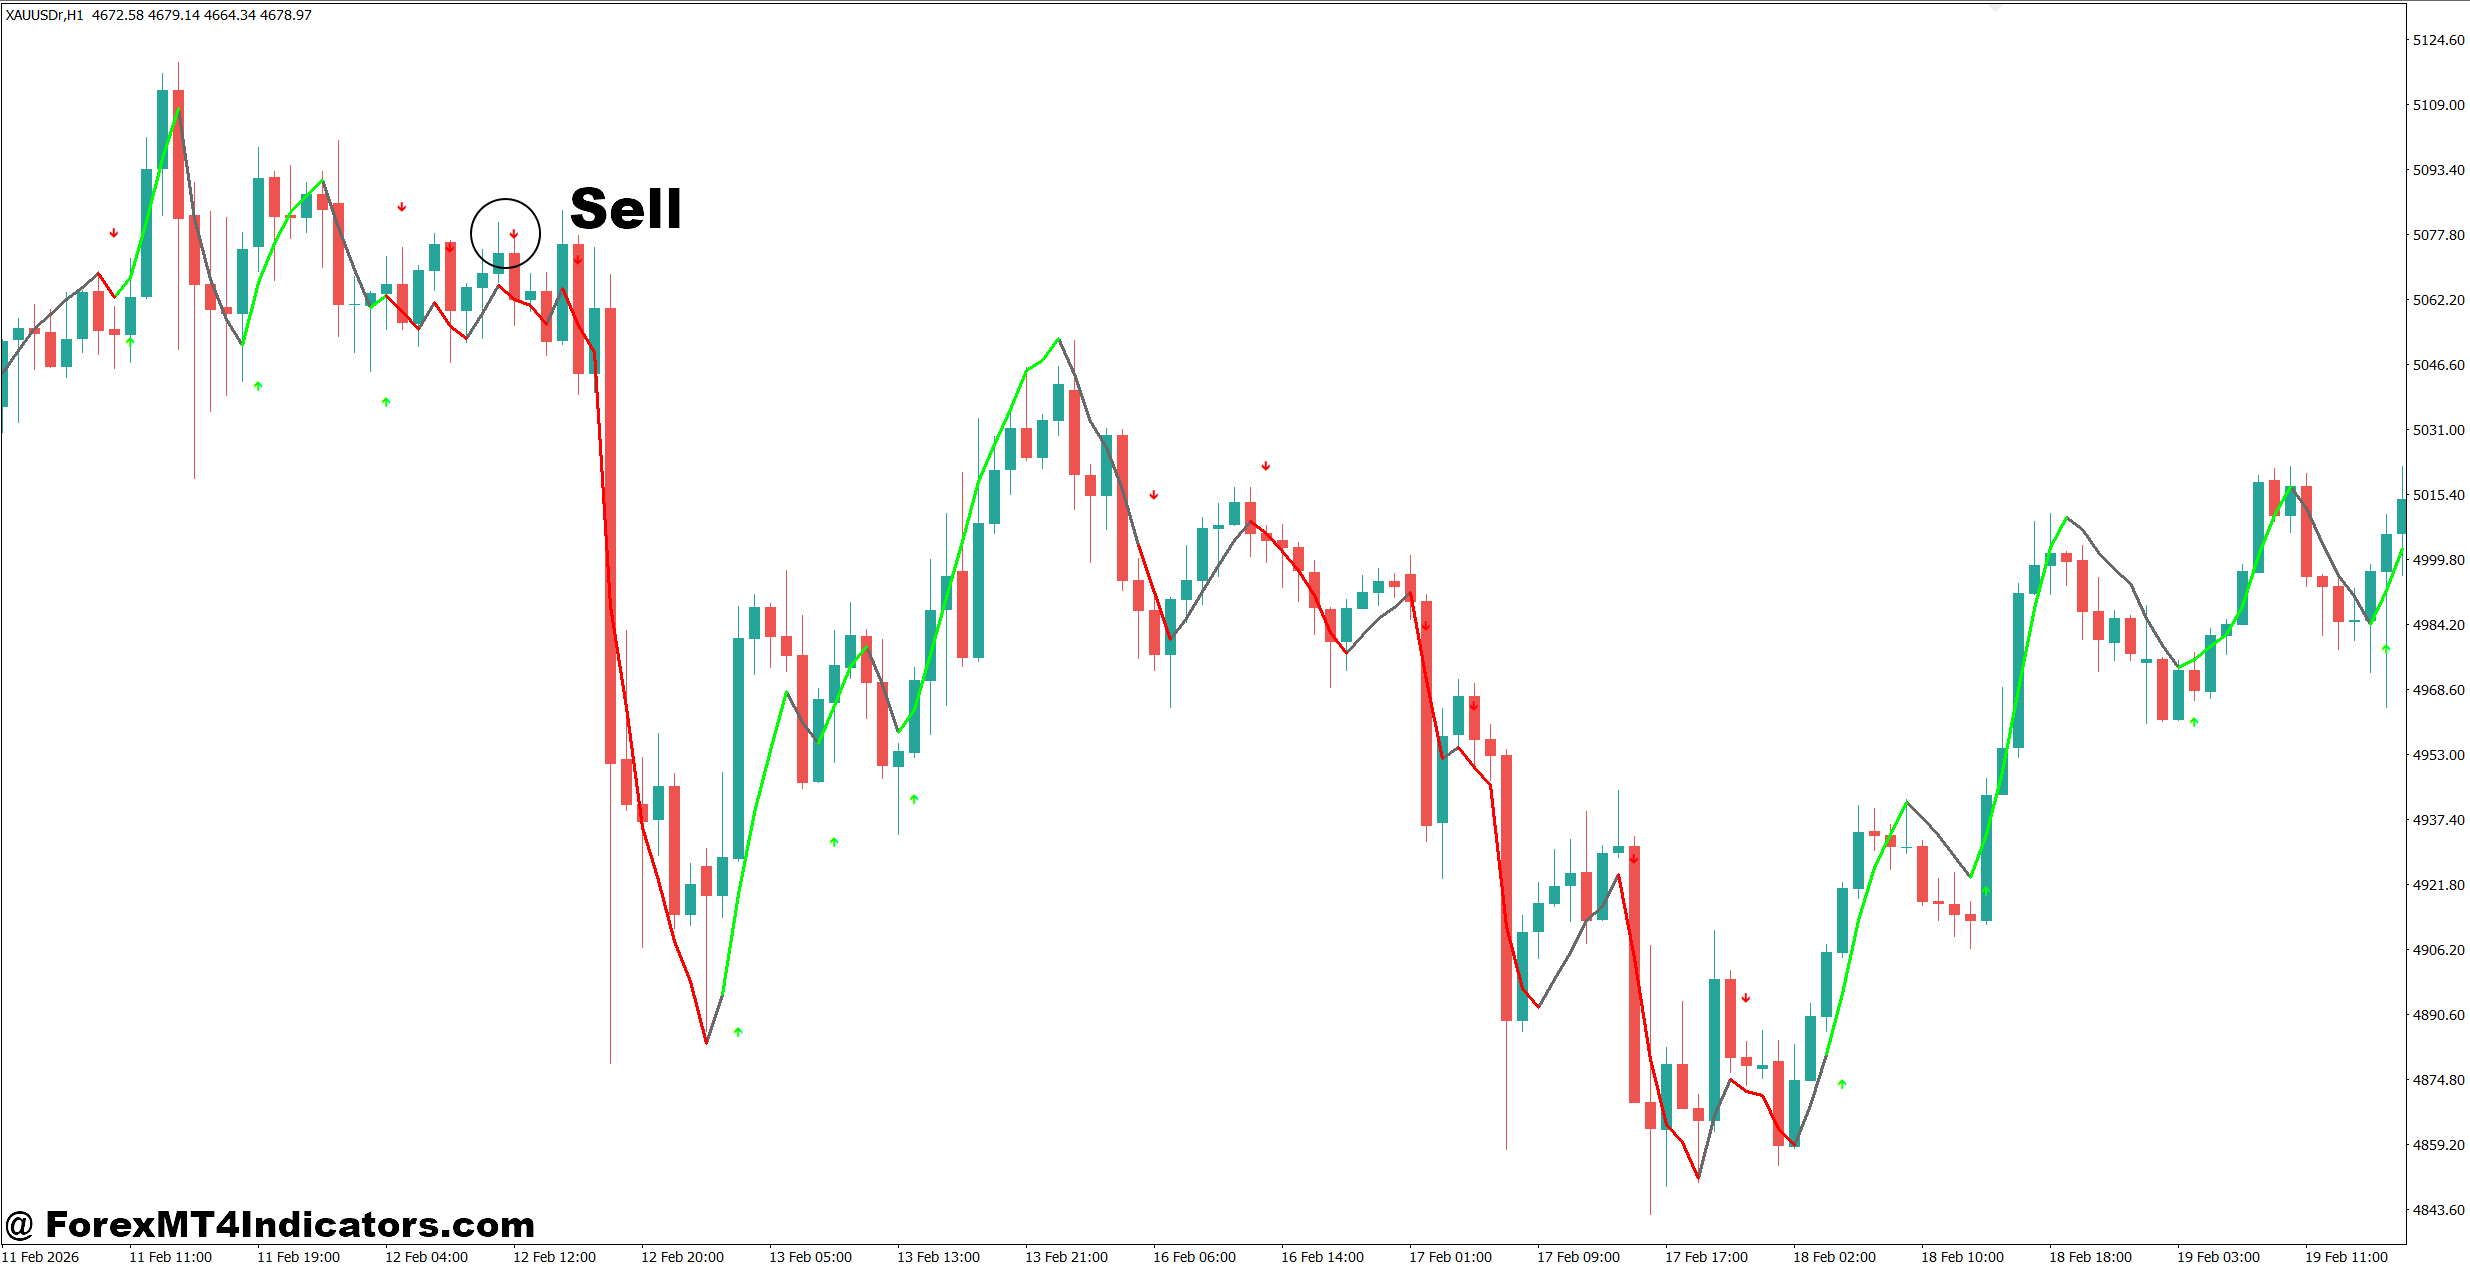
- Confirm bearish market bias – Sell only when the indicator shows a bearish trend on the 1-hour or 4-hour chart.
- Sell after resistance rejection – Enter after price rejects a resistance level on GBP/USD with a 20-30 pip stop-loss.
- Follow the daily trend – Take sell trades only if the daily trend also remains bearish.
- Wait for bearish confirmation – Enter after a bearish engulfing candle or lower high appears below resistance.
- Aim for a 1:2 reward ratio – Risk 30 pips to target around 60 pips on trending setups.
- Avoid ranging markets – Don’t sell when price moves sideways and the Market Bias Indicator frequently changes direction.
- Control position size – Limit risk to 1-2% per trade to protect trading capital during losing streaks.
- Lock in profits – Shift the stop-loss to breakeven after the trade moves 25-35 pips in profit on EUR/USD.
Final Thoughts
The Market Bias Indicator MT4 works best as a trend filter rather than a complete trading system. Traders who understand its role usually make better decisions because they align their trades with the dominant market direction instead of fighting it. The key takeaways are straightforward: identify the prevailing trend before entering, combine the indicator with support and resistance or candlestick confirmation, adjust settings to match the trading timeframe, and always manage risk because no tool is perfect. Used with patience and proper risk management, the Market Bias Indicator MT4 can become a valuable part of a trading plan, helping traders avoid unnecessary trades while staying focused on higher-probability opportunities.
Level up your trading
Learn to read the chart — not just the indicator
eBook · Instant PDF
Video Course · 12 modules
Recommended MT4/MT5 Brokers
- ✓ *FREE *$50 to start (withdrawable)
- ✓ Deposit bonus up to $5,000
- ✓ Negative balance protection
Trading forex and CFDs carries a significant risk of loss and is not suitable for everyone. Broker links are affiliate links — we may earn a commission at no cost to you.
Free MT4 Indicator Download

Enter Your Email Address below, download link will be sent to you.